
 Login Sign Up


| |||||
 |  | ||||

| 12Stocks.com Market Intelligence |
Best SmallCap Stocks
|
| In a hurry? Small Cap Stock Lists: Performance Trends Table, Stock Charts
Sort Small Cap stocks: Daily, Weekly, Year-to-Date, Market Cap & Trends. Filter Small Cap stocks list by sector: Show all, Tech, Finance, Energy, Staples, Retail, Industrial, Materials, Utilities and HealthCare Filter Small Cap stocks list by size: All Large Medium Small and MicroCap |
| 12Stocks.com Small Cap Stocks Performances & Trends Daily | |||||||||
|
|  The overall Smart Investing & Trading Score is 90 (0-bearish to 100-bullish) which puts Small Cap index in short term bullish trend. The Smart Investing & Trading Score from previous trading session is 100 and hence a deterioration of trend.
| ||||||||
Here are the Smart Investing & Trading Scores of the most requested small cap stocks at 12Stocks.com (click stock name for detailed review):
|


| 12Stocks.com: Investing in Smallcap Index with Stocks | |
|
The following table helps investors and traders sort through current performance and trends (as measured by Smart Investing & Trading Score) of various
stocks in the Smallcap Index. Quick View: Move mouse or cursor over stock symbol (ticker) to view short-term technical chart and over stock name to view long term chart. Click on  to add stock symbol to your watchlist and to add stock symbol to your watchlist and  to view watchlist. Click on any ticker or stock name for detailed market intelligence report for that stock. to view watchlist. Click on any ticker or stock name for detailed market intelligence report for that stock. |
12Stocks.com Performance of Stocks in Smallcap Index
| Ticker | Stock Name | Watchlist | Category | Recent Price | Smart Investing & Trading Score | Change % | YTD Change% |
| FFWM | First Foundation |   | Financials | 5.91 | 49 | 1.03 | -38.95% |
| ARL | American Realty | | Financials | 13.82 | 30 | 1.02 | -20.62% |
| NMRK | Newmark Group | | Financials | 10.92 | 69 | 1.02 | -0.36% |
| CBU | Community Bank | | Financials | 48.31 | 90 | 1.00 | -7.29% |
| CCNE | CNB Financial | | Financials | 20.45 | 95 | 0.99 | -9.47% |
| SASR | Sandy Spring | | Financials | 23.80 | 95 | 0.98 | -12.63% |
| INDB | Independent Bank | | Financials | 52.70 | 48 | 0.98 | -19.92% |
| DGICA | Donegal Group | | Financials | 13.33 | 25 | 0.98 | -4.72% |
| OCN | Ocwen Financial | | Financials | 25.91 | 63 | 0.97 | -15.77% |
| MCY | Mercury General | | Financials | 57.96 | 90 | 0.96 | 55.35% |
| NYMT | New York | | Financials | 6.33 | 49 | 0.96 | -25.79% |
| RLJ | RLJ Lodging | | Financials | 10.50 | 35 | 0.96 | -10.41% |
| NWFL | Norwood Financial | | Financials | 24.56 | 50 | 0.95 | -25.37% |
| FSBW | FS Bancorp | | Financials | 33.62 | 52 | 0.95 | -9.05% |
| CCBG | Capital City | | Financials | 28.22 | 64 | 0.93 | -4.11% |
| CTO | Consolidated-Tomoka Land | | Financials | 17.81 | 100 | 0.91 | 2.77% |
| TRTX | TPG RE | | Financials | 8.85 | 83 | 0.91 | 36.15% |
| TMP | Tompkins Financial | | Financials | 48.35 | 82 | 0.90 | -19.72% |
| BY | Byline Bancorp | | Financials | 23.79 | 90 | 0.89 | 0.98% |
| MAC | Macerich | | Financials | 16.07 | 59 | 0.88 | 4.15% |
| GABC | German American | | Financials | 33.22 | 100 | 0.88 | 2.50% |
| HBNC | Horizon Bancorp | | Financials | 12.73 | 83 | 0.87 | -11.04% |
| STRS | Stratus Properties | | Financials | 24.70 | 95 | 0.86 | -14.41% |
| MPB | Mid Penn | | Financials | 21.91 | 83 | 0.85 | -9.78% |
| AIV | Apartment | | Financials | 8.36 | 100 | 0.84 | 6.77% |
| For chart view version of above stock list: Chart View ➞ 0 - 25 , 25 - 50 , 50 - 75 , 75 - 100 , 100 - 125 , 125 - 150 , 150 - 175 , 175 - 200 , 200 - 225 , 225 - 250 , 250 - 275 , 275 - 300 , 300 - 325 , 325 - 350 , 350 - 375 , 375 - 400 | ||
 | Click To Change The Sort Order: By Market Cap or Company Size Performance: Year-to-date, Week and Day |  |
| Too many stocks? View smallcap stocks filtered by marketcap & sector |
| Marketcap: All SmallCap Stocks (default-no microcap), Large, Mid-Range, Small |
| Smallcap Sector: Tech, Finance, Energy, Staples, Retail, Industrial, Materials, & Medical |
|
Get the most comprehensive stock market coverage daily at 12Stocks.com ➞ Best Stocks Today ➞ Best Stocks Weekly ➞ Best Stocks Year-to-Date ➞ Best Stocks Trends ➞  Best Stocks Today 12Stocks.com Best Nasdaq Stocks ➞ Best S&P 500 Stocks ➞ Best Tech Stocks ➞ Best Biotech Stocks ➞ |
| Detailed Overview of SmallCap Stocks |
| SmallCap Technical Overview, Leaders & Laggards, Top SmallCap ETF Funds & Detailed SmallCap Stocks List, Charts, Trends & More |
| Smallcap: Technical Analysis, Trends & YTD Performance | |
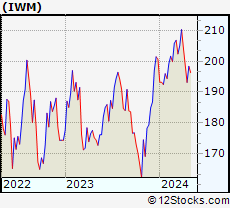
| SmallCap segment as represented by
IWM, an exchange-traded fund [ETF], holds basket of thousands of smallcap stocks from across all major sectors of the US stock market. The smallcap index (contains stocks like Riverbed & Sotheby's) is up by 3.6% and is currently underperforming the overall market by -6.82% year-to-date. Below is a quick view of technical charts and trends: | |
 IWM Weekly Chart |
|
| Long Term Trend: Very Good | |
| Medium Term Trend: Very Good | |
 IWM Daily Chart |
|
| Short Term Trend: Good | |
| Overall Trend Score: 90 | |
| YTD Performance: 3.6% | |
| **Trend Scores & Views Are Only For Educational Purposes And Not For Investing | |
| 12Stocks.com: Top Performing Small Cap Index Stocks | ||||||||||||||||||||||||||||||||||||||||||||||||
 The top performing Small Cap Index stocks year to date are
Now, more recently, over last week, the top performing Small Cap Index stocks on the move are


|
||||||||||||||||||||||||||||||||||||||||||||||||
| 12Stocks.com: Investing in Smallcap Index using Exchange Traded Funds | |
|
The following table shows list of key exchange traded funds (ETF) that
help investors track Smallcap index. The following list also includes leveraged ETF funds that track twice or thrice the daily returns of Smallcap indices. Short or inverse ETF funds move in the opposite direction to the index they track and are useful during market pullbacks or during bear markets. Quick View: Move mouse or cursor over ETF symbol (ticker) to view short-term technical chart and over ETF name to view long term chart. Click on ticker or stock name for detailed view. Click on to add stock symbol to your watchlist and to view watchlist. |
12Stocks.com List of ETFs that track Smallcap Index
| Ticker | ETF Name | Watchlist | Recent Price | Smart Investing & Trading Score | Change % | Week % | Year-to-date % |
| IWM | iShares Russell 2000 | | 207.93 | 90 | -0.72 | 1.77 | 3.6% |
| VTWO | Vanguard Russell 2000 ETF | | 84.11 | 90 | -0.61 | 1.8 | 3.71% |
| IJR | iShares Core S&P Small-Cap | | 110.63 | 83 | -0.14 | 1.51 | 2.2% |
| IWN | iShares Russell 2000 Value | | 158.82 | 88 | 0.06 | 1.68 | 2.25% |
| IJT | iShares S&P Small-Cap 600 Growth | | 131.29 | 83 | -0.69 | 1.1 | 4.91% |
| IJS | iShares S&P Small-Cap 600 Value | | 102.02 | 83 | -0.11 | 1.49 | -1.02% |
| IWO | iShares Russell 2000 Growth | | 267.15 | 95 | 0.21 | 2.78 | 5.92% |
| XSLV | PowerShares S&P SmallCap Low Volatil ETF | | 44.48 | 76 | -0.02 | 0.57 | 0.75% |
| SBB | ProShares Short SmallCap600 | | 15.71 | 17 | 0.32 | -1.54 | -1.38% |
| SAA | ProShares Ultra SmallCap600 | | 24.78 | 78 | -1.69 | 1.77 | -0.68% |
| SMLV | SPDR SSGA US Small Cap Low Volatil ETF | | 112.79 | 95 | 0.22 | 1.41 | 0.24% |
| SDD | ProShares UltraShort SmallCap600 | | 17.67 | 27 | 0.00 | -3.34 | -4.11% |
| 12Stocks.com: Charts, Trends, Fundamental Data and Performances of SmallCap Stocks | |
|
We now take in-depth look at all SmallCap stocks including charts, multi-period performances and overall trends (as measured by Smart Investing & Trading Score). One can sort SmallCap stocks (click link to choose) by Daily, Weekly and by Year-to-Date performances. Also, one can sort by size of the company or by market capitalization. |
| Select Your Default Chart Type: | |||||
| |||||
| Click on stock symbol or name for detailed view. Click on to add stock symbol to your watchlist and to view watchlist. Quick View: Move mouse or cursor over "Daily" to quickly view daily technical stock chart and over "Weekly" to view weekly technical stock chart. | |||||

 | FFWM First Foundation Inc. |
| Sector: Financials | |
| SubSector: Regional - Midwest Banks | |
| MarketCap: 457.17 Millions | |
| Recent Price: 5.91 Smart Investing & Trading Score: 49 | |
| Day Percent Change: 1.03% Day Change: 0.06 | |
| Week Change: 12.14% Year-to-date Change: -39.0% | |
| FFWM Links: Profile News Message Board | |
| Charts:- Daily , Weekly | |
| Add FFWM to Watchlist: View: Get Complete FFWM Trend Analysis ➞ | |
 | ARL American Realty Investors, Inc. |
| Sector: Financials | |
| SubSector: Property Management | |
| MarketCap: 132.242 Millions | |
| Recent Price: 13.82 Smart Investing & Trading Score: 30 | |
| Day Percent Change: 1.02% Day Change: 0.14 | |
| Week Change: -2.26% Year-to-date Change: -20.6% | |
| ARL Links: Profile News Message Board | |
| Charts:- Daily , Weekly | |
| Add ARL to Watchlist: View: Get Complete ARL Trend Analysis ➞ | |
 | NMRK Newmark Group, Inc. |
| Sector: Financials | |
| SubSector: Property Management | |
| MarketCap: 767.542 Millions | |
| Recent Price: 10.92 Smart Investing & Trading Score: 69 | |
| Day Percent Change: 1.02% Day Change: 0.11 | |
| Week Change: 6.28% Year-to-date Change: -0.4% | |
| NMRK Links: Profile News Message Board | |
| Charts:- Daily , Weekly | |
| Add NMRK to Watchlist: View: Get Complete NMRK Trend Analysis ➞ | |
 | CBU Community Bank System, Inc. |
| Sector: Financials | |
| SubSector: Regional - Midwest Banks | |
| MarketCap: 2787.8 Millions | |
| Recent Price: 48.31 Smart Investing & Trading Score: 90 | |
| Day Percent Change: 1.00% Day Change: 0.48 | |
| Week Change: 2.29% Year-to-date Change: -7.3% | |
| CBU Links: Profile News Message Board | |
| Charts:- Daily , Weekly | |
| Add CBU to Watchlist: View: Get Complete CBU Trend Analysis ➞ | |
 | CCNE CNB Financial Corporation |
| Sector: Financials | |
| SubSector: Regional - Northeast Banks | |
| MarketCap: 286.599 Millions | |
| Recent Price: 20.45 Smart Investing & Trading Score: 95 | |
| Day Percent Change: 0.99% Day Change: 0.20 | |
| Week Change: 1.84% Year-to-date Change: -9.5% | |
| CCNE Links: Profile News Message Board | |
| Charts:- Daily , Weekly | |
| Add CCNE to Watchlist: View: Get Complete CCNE Trend Analysis ➞ | |
 | SASR Sandy Spring Bancorp, Inc. |
| Sector: Financials | |
| SubSector: Regional - Mid-Atlantic Banks | |
| MarketCap: 764.659 Millions | |
| Recent Price: 23.80 Smart Investing & Trading Score: 95 | |
| Day Percent Change: 0.98% Day Change: 0.23 | |
| Week Change: 4.25% Year-to-date Change: -12.6% | |
| SASR Links: Profile News Message Board | |
| Charts:- Daily , Weekly | |
| Add SASR to Watchlist: View: Get Complete SASR Trend Analysis ➞ | |
 | INDB Independent Bank Corp. |
| Sector: Financials | |
| SubSector: Regional - Northeast Banks | |
| MarketCap: 2347.09 Millions | |
| Recent Price: 52.70 Smart Investing & Trading Score: 48 | |
| Day Percent Change: 0.98% Day Change: 0.51 | |
| Week Change: 1.74% Year-to-date Change: -19.9% | |
| INDB Links: Profile News Message Board | |
| Charts:- Daily , Weekly | |
| Add INDB to Watchlist: View: Get Complete INDB Trend Analysis ➞ | |
 | DGICA Donegal Group Inc. |
| Sector: Financials | |
| SubSector: Property & Casualty Insurance | |
| MarketCap: 350.512 Millions | |
| Recent Price: 13.33 Smart Investing & Trading Score: 25 | |
| Day Percent Change: 0.98% Day Change: 0.13 | |
| Week Change: 0.3% Year-to-date Change: -4.7% | |
| DGICA Links: Profile News Message Board | |
| Charts:- Daily , Weekly | |
| Add DGICA to Watchlist: View: Get Complete DGICA Trend Analysis ➞ | |
 | OCN Ocwen Financial Corporation |
| Sector: Financials | |
| SubSector: Mortgage Investment | |
| MarketCap: 73.7739 Millions | |
| Recent Price: 25.91 Smart Investing & Trading Score: 63 | |
| Day Percent Change: 0.97% Day Change: 0.25 | |
| Week Change: -1.22% Year-to-date Change: -15.8% | |
| OCN Links: Profile News Message Board | |
| Charts:- Daily , Weekly | |
| Add OCN to Watchlist: View: Get Complete OCN Trend Analysis ➞ | |
 | MCY Mercury General Corporation |
| Sector: Financials | |
| SubSector: Property & Casualty Insurance | |
| MarketCap: 2122.12 Millions | |
| Recent Price: 57.96 Smart Investing & Trading Score: 90 | |
| Day Percent Change: 0.96% Day Change: 0.55 | |
| Week Change: 0.69% Year-to-date Change: 55.4% | |
| MCY Links: Profile News Message Board | |
| Charts:- Daily , Weekly | |
| Add MCY to Watchlist: View: Get Complete MCY Trend Analysis ➞ | |
 | NYMT New York Mortgage Trust, Inc. |
| Sector: Financials | |
| SubSector: Mortgage Investment | |
| MarketCap: 1038.39 Millions | |
| Recent Price: 6.33 Smart Investing & Trading Score: 49 | |
| Day Percent Change: 0.96% Day Change: 0.06 | |
| Week Change: 2.93% Year-to-date Change: -25.8% | |
| NYMT Links: Profile News Message Board | |
| Charts:- Daily , Weekly | |
| Add NYMT to Watchlist: View: Get Complete NYMT Trend Analysis ➞ | |
 | RLJ RLJ Lodging Trust |
| Sector: Financials | |
| SubSector: REIT - Hotel/Motel | |
| MarketCap: 1019.34 Millions | |
| Recent Price: 10.50 Smart Investing & Trading Score: 35 | |
| Day Percent Change: 0.96% Day Change: 0.10 | |
| Week Change: 1.65% Year-to-date Change: -10.4% | |
| RLJ Links: Profile News Message Board | |
| Charts:- Daily , Weekly | |
| Add RLJ to Watchlist: View: Get Complete RLJ Trend Analysis ➞ | |
 | NWFL Norwood Financial Corp. |
| Sector: Financials | |
| SubSector: Regional - Northeast Banks | |
| MarketCap: 201.899 Millions | |
| Recent Price: 24.56 Smart Investing & Trading Score: 50 | |
| Day Percent Change: 0.95% Day Change: 0.23 | |
| Week Change: 3.94% Year-to-date Change: -25.4% | |
| NWFL Links: Profile News Message Board | |
| Charts:- Daily , Weekly | |
| Add NWFL to Watchlist: View: Get Complete NWFL Trend Analysis ➞ | |
 | FSBW FS Bancorp, Inc. |
| Sector: Financials | |
| SubSector: Regional - Pacific Banks | |
| MarketCap: 140.429 Millions | |
| Recent Price: 33.62 Smart Investing & Trading Score: 52 | |
| Day Percent Change: 0.95% Day Change: 0.32 | |
| Week Change: 2.83% Year-to-date Change: -9.1% | |
| FSBW Links: Profile News Message Board | |
| Charts:- Daily , Weekly | |
| Add FSBW to Watchlist: View: Get Complete FSBW Trend Analysis ➞ | |
 | CCBG Capital City Bank Group, Inc. |
| Sector: Financials | |
| SubSector: Regional - Mid-Atlantic Banks | |
| MarketCap: 314.459 Millions | |
| Recent Price: 28.22 Smart Investing & Trading Score: 64 | |
| Day Percent Change: 0.93% Day Change: 0.26 | |
| Week Change: 1.77% Year-to-date Change: -4.1% | |
| CCBG Links: Profile News Message Board | |
| Charts:- Daily , Weekly | |
| Add CCBG to Watchlist: View: Get Complete CCBG Trend Analysis ➞ | |
 | CTO Consolidated-Tomoka Land Co. |
| Sector: Financials | |
| SubSector: Real Estate Development | |
| MarketCap: 205.119 Millions | |
| Recent Price: 17.81 Smart Investing & Trading Score: 100 | |
| Day Percent Change: 0.91% Day Change: 0.16 | |
| Week Change: 2.95% Year-to-date Change: 2.8% | |
| CTO Links: Profile News Message Board | |
| Charts:- Daily , Weekly | |
| Add CTO to Watchlist: View: Get Complete CTO Trend Analysis ➞ | |
 | TRTX TPG RE Finance Trust, Inc. |
| Sector: Financials | |
| SubSector: Mortgage Investment | |
| MarketCap: 607.739 Millions | |
| Recent Price: 8.85 Smart Investing & Trading Score: 83 | |
| Day Percent Change: 0.91% Day Change: 0.08 | |
| Week Change: 3.09% Year-to-date Change: 36.2% | |
| TRTX Links: Profile News Message Board | |
| Charts:- Daily , Weekly | |
| Add TRTX to Watchlist: View: Get Complete TRTX Trend Analysis ➞ | |
 | TMP Tompkins Financial Corporation |
| Sector: Financials | |
| SubSector: Regional - Northeast Banks | |
| MarketCap: 1144.79 Millions | |
| Recent Price: 48.35 Smart Investing & Trading Score: 82 | |
| Day Percent Change: 0.90% Day Change: 0.43 | |
| Week Change: 3% Year-to-date Change: -19.7% | |
| TMP Links: Profile News Message Board | |
| Charts:- Daily , Weekly | |
| Add TMP to Watchlist: View: Get Complete TMP Trend Analysis ➞ | |
 | BY Byline Bancorp, Inc. |
| Sector: Financials | |
| SubSector: Regional - Midwest Banks | |
| MarketCap: 381.87 Millions | |
| Recent Price: 23.79 Smart Investing & Trading Score: 90 | |
| Day Percent Change: 0.89% Day Change: 0.21 | |
| Week Change: 1.45% Year-to-date Change: 1.0% | |
| BY Links: Profile News Message Board | |
| Charts:- Daily , Weekly | |
| Add BY to Watchlist: View: Get Complete BY Trend Analysis ➞ | |
 | MAC The Macerich Company |
| Sector: Financials | |
| SubSector: REIT - Retail | |
| MarketCap: 1172.54 Millions | |
| Recent Price: 16.07 Smart Investing & Trading Score: 59 | |
| Day Percent Change: 0.88% Day Change: 0.14 | |
| Week Change: 5.17% Year-to-date Change: 4.2% | |
| MAC Links: Profile News Message Board | |
| Charts:- Daily , Weekly | |
| Add MAC to Watchlist: View: Get Complete MAC Trend Analysis ➞ | |
 | GABC German American Bancorp, Inc. |
| Sector: Financials | |
| SubSector: Regional - Midwest Banks | |
| MarketCap: 731.47 Millions | |
| Recent Price: 33.22 Smart Investing & Trading Score: 100 | |
| Day Percent Change: 0.88% Day Change: 0.29 | |
| Week Change: 2.66% Year-to-date Change: 2.5% | |
| GABC Links: Profile News Message Board | |
| Charts:- Daily , Weekly | |
| Add GABC to Watchlist: View: Get Complete GABC Trend Analysis ➞ | |
 | HBNC Horizon Bancorp, Inc. |
| Sector: Financials | |
| SubSector: Regional - Northeast Banks | |
| MarketCap: 405.999 Millions | |
| Recent Price: 12.73 Smart Investing & Trading Score: 83 | |
| Day Percent Change: 0.87% Day Change: 0.11 | |
| Week Change: 0.63% Year-to-date Change: -11.0% | |
| HBNC Links: Profile News Message Board | |
| Charts:- Daily , Weekly | |
| Add HBNC to Watchlist: View: Get Complete HBNC Trend Analysis ➞ | |
 | STRS Stratus Properties Inc. |
| Sector: Financials | |
| SubSector: Real Estate Development | |
| MarketCap: 167.819 Millions | |
| Recent Price: 24.70 Smart Investing & Trading Score: 95 | |
| Day Percent Change: 0.86% Day Change: 0.21 | |
| Week Change: 4.97% Year-to-date Change: -14.4% | |
| STRS Links: Profile News Message Board | |
| Charts:- Daily , Weekly | |
| Add STRS to Watchlist: View: Get Complete STRS Trend Analysis ➞ | |
 | MPB Mid Penn Bancorp, Inc. |
| Sector: Financials | |
| SubSector: Regional - Northeast Banks | |
| MarketCap: 187.699 Millions | |
| Recent Price: 21.91 Smart Investing & Trading Score: 83 | |
| Day Percent Change: 0.85% Day Change: 0.19 | |
| Week Change: 1.79% Year-to-date Change: -9.8% | |
| MPB Links: Profile News Message Board | |
| Charts:- Daily , Weekly | |
| Add MPB to Watchlist: View: Get Complete MPB Trend Analysis ➞ | |
 | AIV Apartment Investment and Management Company |
| Sector: Financials | |
| SubSector: REIT - Residential | |
| MarketCap: 4485.11 Millions | |
| Recent Price: 8.36 Smart Investing & Trading Score: 100 | |
| Day Percent Change: 0.84% Day Change: 0.07 | |
| Week Change: 3.85% Year-to-date Change: 6.8% | |
| AIV Links: Profile News Message Board | |
| Charts:- Daily , Weekly | |
| Add AIV to Watchlist: View: Get Complete AIV Trend Analysis ➞ | |
| For tabular summary view of above stock list: Summary View ➞ 0 - 25 , 25 - 50 , 50 - 75 , 75 - 100 , 100 - 125 , 125 - 150 , 150 - 175 , 175 - 200 , 200 - 225 , 225 - 250 , 250 - 275 , 275 - 300 , 300 - 325 , 325 - 350 , 350 - 375 , 375 - 400 | ||
| Click To Change The Sort Order: By Market Cap or Company Size Performance: Year-to-date, Week and Day | |
| Select Chart Type: | ||
| Too many stocks? View smallcap stocks filtered by marketcap & sector |
| Marketcap: All SmallCap Stocks (default-no microcap), Large, Mid-Range, Small & MicroCap |
| Sector: Tech, Finance, Energy, Staples, Retail, Industrial, Materials, Utilities & Medical |
|
Best Stocks Today 12Stocks.com |
© 2024 12Stocks.com Terms & Conditions Privacy Contact Us
All Information Provided Only For Education And Not To Be Used For Investing or Trading. See Terms & Conditions


One More Thing ... Get Best Stocks Delivered Daily!
Never Ever Miss A Move With Our Top Ten Stocks Lists
Find Best Stocks In Any Market - Bull or Bear Market
Take A Peek At Our Top Ten Stocks Lists: Daily, Weekly, Year-to-Date & Top Trends
Find Best Stocks In Any Market - Bull or Bear Market
Take A Peek At Our Top Ten Stocks Lists: Daily, Weekly, Year-to-Date & Top Trends
Smallcap Stocks With Best Up Trends [0-bearish to 100-bullish]: Trupanion [100], Hawkins [100], Tejon Ranch[100], Gannett Co[100], Seneca Foods[100], BRC [100], BJ s[100], Life Time[100], Vanda [100], Kronos Worldwide[100], NovaGold Resources[100]
Best Smallcap Stocks Year-to-Date:
CareMax [471.13%], Bakkt [370.4%], Janux [342.16%], Viking [304.73%], Alpine Immune[241.18%], Longboard [235.68%], Super Micro[218.16%], Avidity Biosciences[217.7%], Novavax [200%], Arcutis Bio[182.35%], Sweetgreen [181.24%] Best Smallcap Stocks This Week:
Novavax [62.16%], MacroGenics [54.68%], Maxeon Solar[49.31%], SunPower [43.04%], Harrow Health[39.31%], Workhorse Group[39.06%], Humacyte [36.6%], ProKidney [34.88%], Allbirds [33.47%], Cadiz [28.76%], Fossil Group[28.72%] Best Smallcap Stocks Daily:
Maxeon Solar[26.56%], Allakos [22.36%], Ventyx Biosciences[18.85%], Trupanion [15.85%], Zura Bio[15.61%], Beyond Air[15.42%], SilverBow Resources[13.20%], Children s[13.09%], Comtech Tele[12.92%], Aceto [12.14%], Novavax [11.63%]