
 Login Sign Up


| |||||
 |  | ||||

| 12Stocks.com Market Intelligence |
Best SmallCap Stocks
|
| In a hurry? Small Cap Stock Lists: Performance Trends Table, Stock Charts
Sort Small Cap stocks: Daily, Weekly, Year-to-Date, Market Cap & Trends. Filter Small Cap stocks list by sector: Show all, Tech, Finance, Energy, Staples, Retail, Industrial, Materials, Utilities and HealthCare Filter Small Cap stocks list by size: All Large Medium Small and MicroCap |
| 12Stocks.com Small Cap Stocks Performances & Trends Daily | |||||||||
|
|  The overall Smart Investing & Trading Score is 95 (0-bearish to 100-bullish) which puts Small Cap index in short term bullish trend. The Smart Investing & Trading Score from previous trading session is 100 and hence a deterioration of trend.
| ||||||||
Here are the Smart Investing & Trading Scores of the most requested small cap stocks at 12Stocks.com (click stock name for detailed review):
|


| 12Stocks.com: Investing in Smallcap Index with Stocks | |
|
The following table helps investors and traders sort through current performance and trends (as measured by Smart Investing & Trading Score) of various
stocks in the Smallcap Index. Quick View: Move mouse or cursor over stock symbol (ticker) to view short-term technical chart and over stock name to view long term chart. Click on  to add stock symbol to your watchlist and to add stock symbol to your watchlist and  to view watchlist. Click on any ticker or stock name for detailed market intelligence report for that stock. to view watchlist. Click on any ticker or stock name for detailed market intelligence report for that stock. |
12Stocks.com Performance of Stocks in Smallcap Index
| Ticker | Stock Name | Watchlist | Category | Recent Price | Smart Investing & Trading Score | Change % | YTD Change% |
| BOX | Box |   | Technology | 26.87 | 93 | -0.63% | 4.92% |
| VSH | Vishay Inter | | Technology | 23.77 | 100 | 0.23% | -0.81% |
| RAMP | LiveRamp | | Technology | 32.92 | 57 | 0.03% | -13.09% |
| AVDX | AvidXchange | | Technology | 11.18 | 18 | -1.15% | -9.95% |
| LILA | Liberty Latin | | Technology | 8.60 | 90 | 1.60% | 17.58% |
| ALTR | Altair Engineering | | Technology | 89.95 | 100 | -1.00% | 6.89% |
| ALRM | Alarm.com | | Technology | 69.94 | 64 | -0.16% | 8.23% |
| TENB | Tenable | | Technology | 44.31 | 0 | -0.85% | -3.80% |
| RPD | Rapid7 | | Technology | 38.45 | 42 | -2.36% | -32.66% |
| FSLY | Fastly | | Technology | 8.88 | 42 | 0.91% | -50.11% |
| ESE | ESCO | | Technology | 107.09 | 80 | -0.20% | -8.49% |
| DIOD | Diodes | | Technology | 72.26 | 86 | 0.35% | -10.26% |
| AMKR | Amkor | | Technology | 33.64 | 95 | -0.41% | 1.11% |
| FN | Fabrinet | | Technology | 236.96 | 90 | 0.11% | 24.50% |
| EGHT | 8x8 | | Technology | 2.69 | 52 | -2.71% | -28.70% |
| TDS | Telephone and | | Technology | 20.00 | 68 | -2.32% | 8.96% |
| PGNY | Progyny | | Technology | 27.37 | 18 | 2.20% | -26.39% |
| SYNA | Synaptics | | Technology | 93.23 | 64 | 1.07% | -18.27% |
| SANM | Sanmina | | Technology | 66.30 | 95 | 0.53% | 29.06% |
| NVTS | Navitas Semiconductor | | Technology | 4.00 | 18 | 0.63% | -50.83% |
| EXLS | ExlService | | Technology | 31.04 | 82 | 1.47% | 0.62% |
| ZETA | Zeta Global | | Technology | 16.98 | 90 | -0.24% | 92.41% |
| ROG | Rogers | | Technology | 120.59 | 68 | -0.45% | -8.69% |
| VRNS | Varonis Systems | | Technology | 44.49 | 44 | -0.17% | -1.73% |
| PAYO | Payoneer Global | | Technology | 5.84 | 83 | 0.52% | 10.40% |
| For chart view version of above stock list: Chart View ➞ 0 - 25 , 25 - 50 , 50 - 75 , 75 - 100 , 100 - 125 , 125 - 150 , 150 - 175 , 175 - 200 , 200 - 225 , 225 - 250 | ||
 | Click To Change The Sort Order: By Market Cap or Company Size Performance: Year-to-date, Week and Day |  |
| Too many stocks? View smallcap stocks filtered by marketcap & sector |
| Marketcap: All SmallCap Stocks (default-no microcap), Large, Mid-Range, Small |
| Smallcap Sector: Tech, Finance, Energy, Staples, Retail, Industrial, Materials, & Medical |
|
Get the most comprehensive stock market coverage daily at 12Stocks.com ➞ Best Stocks Today ➞ Best Stocks Weekly ➞ Best Stocks Year-to-Date ➞ Best Stocks Trends ➞  Best Stocks Today 12Stocks.com Best Nasdaq Stocks ➞ Best S&P 500 Stocks ➞ Best Tech Stocks ➞ Best Biotech Stocks ➞ |
| Detailed Overview of SmallCap Stocks |
| SmallCap Technical Overview, Leaders & Laggards, Top SmallCap ETF Funds & Detailed SmallCap Stocks List, Charts, Trends & More |
| Smallcap: Technical Analysis, Trends & YTD Performance | |
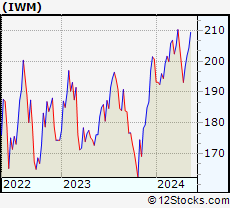
| SmallCap segment as represented by
IWM, an exchange-traded fund [ETF], holds basket of thousands of smallcap stocks from across all major sectors of the US stock market. The smallcap index (contains stocks like Riverbed & Sotheby's) is up by 4.12% and is currently underperforming the overall market by -6.85% year-to-date. Below is a quick view of technical charts and trends: | |
 IWM Weekly Chart |
|
| Long Term Trend: Very Good | |
| Medium Term Trend: Very Good | |
 IWM Daily Chart |
|
| Short Term Trend: Good | |
| Overall Trend Score: 95 | |
| YTD Performance: 4.12% | |
| **Trend Scores & Views Are Only For Educational Purposes And Not For Investing | |
| 12Stocks.com: Top Performing Small Cap Index Stocks | ||||||||||||||||||||||||||||||||||||||||||||||||
 The top performing Small Cap Index stocks year to date are
Now, more recently, over last week, the top performing Small Cap Index stocks on the move are


|
||||||||||||||||||||||||||||||||||||||||||||||||
| 12Stocks.com: Investing in Smallcap Index using Exchange Traded Funds | |
|
The following table shows list of key exchange traded funds (ETF) that
help investors track Smallcap index. The following list also includes leveraged ETF funds that track twice or thrice the daily returns of Smallcap indices. Short or inverse ETF funds move in the opposite direction to the index they track and are useful during market pullbacks or during bear markets. Quick View: Move mouse or cursor over ETF symbol (ticker) to view short-term technical chart and over ETF name to view long term chart. Click on ticker or stock name for detailed view. Click on to add stock symbol to your watchlist and to view watchlist. |
12Stocks.com List of ETFs that track Smallcap Index
| Ticker | ETF Name | Watchlist | Recent Price | Smart Investing & Trading Score | Change % | Week % | Year-to-date % |
| IWM | iShares Russell 2000 | | 208.97 | 95 | -0.22 | 2.28 | 4.12% |
| IJR | iShares Core S&P Small-Cap | | 110.63 | 83 | -0.14 | 1.51 | 2.2% |
| VTWO | Vanguard Russell 2000 ETF | | 84.43 | 90 | -0.24 | 2.18 | 4.11% |
| IWN | iShares Russell 2000 Value | | 158.82 | 88 | 0.06 | 1.68 | 2.25% |
| IJS | iShares S&P Small-Cap 600 Value | | 101.91 | 83 | -0.22 | 1.38 | -1.13% |
| IWO | iShares Russell 2000 Growth | | 267.15 | 95 | 0.21 | 2.78 | 5.92% |
| IJT | iShares S&P Small-Cap 600 Growth | | 131.69 | 90 | -0.39 | 1.41 | 5.23% |
| XSLV | PowerShares S&P SmallCap Low Volatil ETF | | 44.47 | 76 | -0.04 | 0.54 | 0.72% |
| SAA | ProShares Ultra SmallCap600 | | 25.05 | 85 | -0.60 | 2.89 | 0.42% |
| SBB | ProShares Short SmallCap600 | | 15.77 | 17 | 0.70 | -1.16 | -1% |
| SMLV | SPDR SSGA US Small Cap Low Volatil ETF | | 112.72 | 95 | 0.16 | 1.34 | 0.17% |
| SDD | ProShares UltraShort SmallCap600 | | 17.78 | 27 | 0.61 | -2.75 | -3.52% |
| 12Stocks.com: Charts, Trends, Fundamental Data and Performances of SmallCap Stocks | |
|
We now take in-depth look at all SmallCap stocks including charts, multi-period performances and overall trends (as measured by Smart Investing & Trading Score). One can sort SmallCap stocks (click link to choose) by Daily, Weekly and by Year-to-Date performances. Also, one can sort by size of the company or by market capitalization. |
| Select Your Default Chart Type: | |||||
| |||||
| Click on stock symbol or name for detailed view. Click on to add stock symbol to your watchlist and to view watchlist. Quick View: Move mouse or cursor over "Daily" to quickly view daily technical stock chart and over "Weekly" to view weekly technical stock chart. | |||||

 | BOX Box, Inc. |
| Sector: Technology | |
| SubSector: Application Software | |
| MarketCap: 2154.42 Millions | |
| Recent Price: 26.87 Smart Investing & Trading Score: 93 | |
| Day Percent Change: -0.63% Day Change: -0.17 | |
| Week Change: 2.05% Year-to-date Change: 4.9% | |
| BOX Links: Profile News Message Board | |
| Charts:- Daily , Weekly | |
| Add BOX to Watchlist: View: Get Complete BOX Trend Analysis ➞ | |
 | VSH Vishay Intertechnology, Inc. |
| Sector: Technology | |
| SubSector: Semiconductor - Broad Line | |
| MarketCap: 2132.52 Millions | |
| Recent Price: 23.77 Smart Investing & Trading Score: 100 | |
| Day Percent Change: 0.23% Day Change: 0.05 | |
| Week Change: 5.62% Year-to-date Change: -0.8% | |
| VSH Links: Profile News Message Board | |
| Charts:- Daily , Weekly | |
| Add VSH to Watchlist: View: Get Complete VSH Trend Analysis ➞ | |
 | RAMP LiveRamp Holdings, Inc. |
| Sector: Technology | |
| SubSector: Information Technology Services | |
| MarketCap: 2124.38 Millions | |
| Recent Price: 32.92 Smart Investing & Trading Score: 57 | |
| Day Percent Change: 0.03% Day Change: 0.01 | |
| Week Change: 1.6% Year-to-date Change: -13.1% | |
| RAMP Links: Profile News Message Board | |
| Charts:- Daily , Weekly | |
| Add RAMP to Watchlist: View: Get Complete RAMP Trend Analysis ➞ | |
 | AVDX AvidXchange Holdings, Inc. |
| Sector: Technology | |
| SubSector: Software - Infrastructure | |
| MarketCap: 2120 Millions | |
| Recent Price: 11.18 Smart Investing & Trading Score: 18 | |
| Day Percent Change: -1.15% Day Change: -0.13 | |
| Week Change: -0.53% Year-to-date Change: -10.0% | |
| AVDX Links: Profile News Message Board | |
| Charts:- Daily , Weekly | |
| Add AVDX to Watchlist: View: Get Complete AVDX Trend Analysis ➞ | |
 | LILA Liberty Latin America Ltd. |
| Sector: Technology | |
| SubSector: CATV Systems | |
| MarketCap: 2092.62 Millions | |
| Recent Price: 8.60 Smart Investing & Trading Score: 90 | |
| Day Percent Change: 1.60% Day Change: 0.13 | |
| Week Change: 2.57% Year-to-date Change: 17.6% | |
| LILA Links: Profile News Message Board | |
| Charts:- Daily , Weekly | |
| Add LILA to Watchlist: View: Get Complete LILA Trend Analysis ➞ | |
 | ALTR Altair Engineering Inc. |
| Sector: Technology | |
| SubSector: Semiconductor - Specialized | |
| MarketCap: 2072.2 Millions | |
| Recent Price: 89.95 Smart Investing & Trading Score: 100 | |
| Day Percent Change: -1.00% Day Change: -0.91 | |
| Week Change: 5.32% Year-to-date Change: 6.9% | |
| ALTR Links: Profile News Message Board | |
| Charts:- Daily , Weekly | |
| Add ALTR to Watchlist: View: Get Complete ALTR Trend Analysis ➞ | |
 | ALRM Alarm.com Holdings, Inc. |
| Sector: Technology | |
| SubSector: Application Software | |
| MarketCap: 2035.62 Millions | |
| Recent Price: 69.94 Smart Investing & Trading Score: 64 | |
| Day Percent Change: -0.16% Day Change: -0.11 | |
| Week Change: 2.96% Year-to-date Change: 8.2% | |
| ALRM Links: Profile News Message Board | |
| Charts:- Daily , Weekly | |
| Add ALRM to Watchlist: View: Get Complete ALRM Trend Analysis ➞ | |
 | TENB Tenable Holdings, Inc. |
| Sector: Technology | |
| SubSector: Business Software & Services | |
| MarketCap: 1986.68 Millions | |
| Recent Price: 44.31 Smart Investing & Trading Score: 0 | |
| Day Percent Change: -0.85% Day Change: -0.38 | |
| Week Change: -1.29% Year-to-date Change: -3.8% | |
| TENB Links: Profile News Message Board | |
| Charts:- Daily , Weekly | |
| Add TENB to Watchlist: View: Get Complete TENB Trend Analysis ➞ | |
 | RPD Rapid7, Inc. |
| Sector: Technology | |
| SubSector: Application Software | |
| MarketCap: 1981.12 Millions | |
| Recent Price: 38.45 Smart Investing & Trading Score: 42 | |
| Day Percent Change: -2.36% Day Change: -0.93 | |
| Week Change: 1.59% Year-to-date Change: -32.7% | |
| RPD Links: Profile News Message Board | |
| Charts:- Daily , Weekly | |
| Add RPD to Watchlist: View: Get Complete RPD Trend Analysis ➞ | |
 | FSLY Fastly, Inc. |
| Sector: Technology | |
| SubSector: Application Software | |
| MarketCap: 1973.72 Millions | |
| Recent Price: 8.88 Smart Investing & Trading Score: 42 | |
| Day Percent Change: 0.91% Day Change: 0.08 | |
| Week Change: 3.44% Year-to-date Change: -50.1% | |
| FSLY Links: Profile News Message Board | |
| Charts:- Daily , Weekly | |
| Add FSLY to Watchlist: View: Get Complete FSLY Trend Analysis ➞ | |
 | ESE ESCO Technologies Inc. |
| Sector: Technology | |
| SubSector: Scientific & Technical Instruments | |
| MarketCap: 1968.03 Millions | |
| Recent Price: 107.09 Smart Investing & Trading Score: 80 | |
| Day Percent Change: -0.20% Day Change: -0.21 | |
| Week Change: 1.99% Year-to-date Change: -8.5% | |
| ESE Links: Profile News Message Board | |
| Charts:- Daily , Weekly | |
| Add ESE to Watchlist: View: Get Complete ESE Trend Analysis ➞ | |
 | DIOD Diodes Incorporated |
| Sector: Technology | |
| SubSector: Semiconductor - Integrated Circuits | |
| MarketCap: 1967.6 Millions | |
| Recent Price: 72.26 Smart Investing & Trading Score: 86 | |
| Day Percent Change: 0.35% Day Change: 0.25 | |
| Week Change: 4.24% Year-to-date Change: -10.3% | |
| DIOD Links: Profile News Message Board | |
| Charts:- Daily , Weekly | |
| Add DIOD to Watchlist: View: Get Complete DIOD Trend Analysis ➞ | |
 | AMKR Amkor Technology, Inc. |
| Sector: Technology | |
| SubSector: Semiconductor - Integrated Circuits | |
| MarketCap: 1966.2 Millions | |
| Recent Price: 33.64 Smart Investing & Trading Score: 95 | |
| Day Percent Change: -0.41% Day Change: -0.14 | |
| Week Change: 3.1% Year-to-date Change: 1.1% | |
| AMKR Links: Profile News Message Board | |
| Charts:- Daily , Weekly | |
| Add AMKR to Watchlist: View: Get Complete AMKR Trend Analysis ➞ | |
 | FN Fabrinet |
| Sector: Technology | |
| SubSector: Electronic Equipment | |
| MarketCap: 1876 Millions | |
| Recent Price: 236.96 Smart Investing & Trading Score: 90 | |
| Day Percent Change: 0.11% Day Change: 0.27 | |
| Week Change: 6.39% Year-to-date Change: 24.5% | |
| FN Links: Profile News Message Board | |
| Charts:- Daily , Weekly | |
| Add FN to Watchlist: View: Get Complete FN Trend Analysis ➞ | |
 | EGHT 8x8, Inc. |
| Sector: Technology | |
| SubSector: Diversified Communication Services | |
| MarketCap: 1861.64 Millions | |
| Recent Price: 2.69 Smart Investing & Trading Score: 52 | |
| Day Percent Change: -2.71% Day Change: -0.08 | |
| Week Change: 4.05% Year-to-date Change: -28.7% | |
| EGHT Links: Profile News Message Board | |
| Charts:- Daily , Weekly | |
| Add EGHT to Watchlist: View: Get Complete EGHT Trend Analysis ➞ | |
 | TDS Telephone and Data Systems, Inc. |
| Sector: Technology | |
| SubSector: Wireless Communications | |
| MarketCap: 1851.87 Millions | |
| Recent Price: 20.00 Smart Investing & Trading Score: 68 | |
| Day Percent Change: -2.32% Day Change: -0.47 | |
| Week Change: -0.72% Year-to-date Change: 9.0% | |
| TDS Links: Profile News Message Board | |
| Charts:- Daily , Weekly | |
| Add TDS to Watchlist: View: Get Complete TDS Trend Analysis ➞ | |
 | PGNY Progyny, Inc. |
| Sector: Technology | |
| SubSector: Healthcare Information Services | |
| MarketCap: 1839.05 Millions | |
| Recent Price: 27.37 Smart Investing & Trading Score: 18 | |
| Day Percent Change: 2.20% Day Change: 0.59 | |
| Week Change: 2.01% Year-to-date Change: -26.4% | |
| PGNY Links: Profile News Message Board | |
| Charts:- Daily , Weekly | |
| Add PGNY to Watchlist: View: Get Complete PGNY Trend Analysis ➞ | |
 | SYNA Synaptics Incorporated |
| Sector: Technology | |
| SubSector: Application Software | |
| MarketCap: 1822.82 Millions | |
| Recent Price: 93.23 Smart Investing & Trading Score: 64 | |
| Day Percent Change: 1.07% Day Change: 0.98 | |
| Week Change: 4.83% Year-to-date Change: -18.3% | |
| SYNA Links: Profile News Message Board | |
| Charts:- Daily , Weekly | |
| Add SYNA to Watchlist: View: Get Complete SYNA Trend Analysis ➞ | |
 | SANM Sanmina Corporation |
| Sector: Technology | |
| SubSector: Diversified Electronics | |
| MarketCap: 1790.36 Millions | |
| Recent Price: 66.30 Smart Investing & Trading Score: 95 | |
| Day Percent Change: 0.53% Day Change: 0.35 | |
| Week Change: 2.11% Year-to-date Change: 29.1% | |
| SANM Links: Profile News Message Board | |
| Charts:- Daily , Weekly | |
| Add SANM to Watchlist: View: Get Complete SANM Trend Analysis ➞ | |
 | NVTS Navitas Semiconductor Corporation |
| Sector: Technology | |
| SubSector: Semiconductors | |
| MarketCap: 1790 Millions | |
| Recent Price: 4.00 Smart Investing & Trading Score: 18 | |
| Day Percent Change: 0.63% Day Change: 0.02 | |
| Week Change: -2.56% Year-to-date Change: -50.8% | |
| NVTS Links: Profile News Message Board | |
| Charts:- Daily , Weekly | |
| Add NVTS to Watchlist: View: Get Complete NVTS Trend Analysis ➞ | |
 | EXLS ExlService Holdings, Inc. |
| Sector: Technology | |
| SubSector: Information Technology Services | |
| MarketCap: 1781.78 Millions | |
| Recent Price: 31.04 Smart Investing & Trading Score: 82 | |
| Day Percent Change: 1.47% Day Change: 0.45 | |
| Week Change: 1.34% Year-to-date Change: 0.6% | |
| EXLS Links: Profile News Message Board | |
| Charts:- Daily , Weekly | |
| Add EXLS to Watchlist: View: Get Complete EXLS Trend Analysis ➞ | |
 | ZETA Zeta Global Holdings Corp. |
| Sector: Technology | |
| SubSector: Software - Application | |
| MarketCap: 1780 Millions | |
| Recent Price: 16.98 Smart Investing & Trading Score: 90 | |
| Day Percent Change: -0.24% Day Change: -0.04 | |
| Week Change: 7.47% Year-to-date Change: 92.4% | |
| ZETA Links: Profile News Message Board | |
| Charts:- Daily , Weekly | |
| Add ZETA to Watchlist: View: Get Complete ZETA Trend Analysis ➞ | |
 | ROG Rogers Corporation |
| Sector: Technology | |
| SubSector: Diversified Electronics | |
| MarketCap: 1756.36 Millions | |
| Recent Price: 120.59 Smart Investing & Trading Score: 68 | |
| Day Percent Change: -0.45% Day Change: -0.55 | |
| Week Change: -0.01% Year-to-date Change: -8.7% | |
| ROG Links: Profile News Message Board | |
| Charts:- Daily , Weekly | |
| Add ROG to Watchlist: View: Get Complete ROG Trend Analysis ➞ | |
 | VRNS Varonis Systems, Inc. |
| Sector: Technology | |
| SubSector: Technical & System Software | |
| MarketCap: 1715 Millions | |
| Recent Price: 44.49 Smart Investing & Trading Score: 44 | |
| Day Percent Change: -0.17% Day Change: -0.08 | |
| Week Change: -0.03% Year-to-date Change: -1.7% | |
| VRNS Links: Profile News Message Board | |
| Charts:- Daily , Weekly | |
| Add VRNS to Watchlist: View: Get Complete VRNS Trend Analysis ➞ | |
 | PAYO Payoneer Global Inc. |
| Sector: Technology | |
| SubSector: Software - Infrastructure | |
| MarketCap: 1710 Millions | |
| Recent Price: 5.84 Smart Investing & Trading Score: 83 | |
| Day Percent Change: 0.52% Day Change: 0.03 | |
| Week Change: 0% Year-to-date Change: 10.4% | |
| PAYO Links: Profile News Message Board | |
| Charts:- Daily , Weekly | |
| Add PAYO to Watchlist: View: Get Complete PAYO Trend Analysis ➞ | |
| For tabular summary view of above stock list: Summary View ➞ 0 - 25 , 25 - 50 , 50 - 75 , 75 - 100 , 100 - 125 , 125 - 150 , 150 - 175 , 175 - 200 , 200 - 225 , 225 - 250 | ||
| Click To Change The Sort Order: By Market Cap or Company Size Performance: Year-to-date, Week and Day | |
| Select Chart Type: | ||
| Too many stocks? View smallcap stocks filtered by marketcap & sector |
| Marketcap: All SmallCap Stocks (default-no microcap), Large, Mid-Range, Small & MicroCap |
| Sector: Tech, Finance, Energy, Staples, Retail, Industrial, Materials, Utilities & Medical |
|
Best Stocks Today 12Stocks.com |
© 2024 12Stocks.com Terms & Conditions Privacy Contact Us
All Information Provided Only For Education And Not To Be Used For Investing or Trading. See Terms & Conditions


One More Thing ... Get Best Stocks Delivered Daily!
Never Ever Miss A Move With Our Top Ten Stocks Lists
Find Best Stocks In Any Market - Bull or Bear Market
Take A Peek At Our Top Ten Stocks Lists: Daily, Weekly, Year-to-Date & Top Trends
Find Best Stocks In Any Market - Bull or Bear Market
Take A Peek At Our Top Ten Stocks Lists: Daily, Weekly, Year-to-Date & Top Trends
Smallcap Stocks With Best Up Trends [0-bearish to 100-bullish]: Trupanion [100], Hawkins [100], OneSpan [100], EverQuote [100], Silk Road[100], Boot Barn[100], Agilysys [100], Vanda [100], Guardant Health[100], Infinera [100], Tejon Ranch[100]
Best Smallcap Stocks Year-to-Date:
Viking [304.73%], Super Micro[231.02%], Sweetgreen [182.92%], Arcutis Bio[177.4%], Vera [175.32%], Novavax [171.77%], Stoke [168.25%], Oscar Health[147.78%], SoundHound AI[142.76%], MicroStrategy [131.72%], Carvana Co[127.35%] Best Smallcap Stocks This Week:
MacroGenics [48.64%], Novavax [46.9%], LivePerson [36.71%], ProKidney [36.48%], Treace Medical[29.45%], SunPower [28.91%], Workhorse Group[28.83%], Emergent BioSolutions[25.4%], Vuzix [25%], Tellurian [25%], Stoke [24.65%] Best Smallcap Stocks Daily:
Trupanion [12.53%], Extreme s[11.07%], Allakos [10.55%], Hawkins [8.45%], Ventyx Biosciences[6.68%], Semler Scientific[5.99%], Alphatec [5.88%], Verve [5.78%], Verrica [5.27%], GEO Group[5.19%], Aceto [5.00%]