
 Login Sign Up


| |||||
 |  | ||||

| 12Stocks.com Market Intelligence |
Best SmallCap Stocks
|
| In a hurry? Small Cap Stock Lists: Performance Trends Table, Stock Charts
Sort Small Cap stocks: Daily, Weekly, Year-to-Date, Market Cap & Trends. Filter Small Cap stocks list by sector: Show all, Tech, Finance, Energy, Staples, Retail, Industrial, Materials, Utilities and HealthCare Filter Small Cap stocks list by size: All Large Medium Small and MicroCap |
| 12Stocks.com Small Cap Stocks Performances & Trends Daily | |||||||||
|
|  The overall Smart Investing & Trading Score is 69 (0-bearish to 100-bullish) which puts Small Cap index in short term neutral to bullish trend. The Smart Investing & Trading Score from previous trading session is 49 and hence an improvement of trend.
| ||||||||
Here are the Smart Investing & Trading Scores of the most requested small cap stocks at 12Stocks.com (click stock name for detailed review):
|


| 12Stocks.com: Investing in Smallcap Index with Stocks | |
|
The following table helps investors and traders sort through current performance and trends (as measured by Smart Investing & Trading Score) of various
stocks in the Smallcap Index. Quick View: Move mouse or cursor over stock symbol (ticker) to view short-term technical chart and over stock name to view long term chart. Click on  to add stock symbol to your watchlist and to add stock symbol to your watchlist and  to view watchlist. Click on any ticker or stock name for detailed market intelligence report for that stock. to view watchlist. Click on any ticker or stock name for detailed market intelligence report for that stock. |
12Stocks.com Performance of Stocks in Smallcap Index
| Ticker | Stock Name | Watchlist | Category | Recent Price | Smart Investing & Trading Score | Change % | YTD Change% |
| VOXX | VOXX |   | Consumer Staples | 6.15 | 25 | 3.36% | -42.42% |
| AVNW | Aviat s | | Technology | 29.91 | 7 | 5.34% | -8.42% |
| BLNK | Blink Charging | | Services & Goods | 3.04 | 74 | 5.19% | -10.32% |
| VUZI | Vuzix | | Technology | 1.31 | 42 | -3.68% | -37.17% |
| MHLD | Maiden | | Financials | 2.25 | 100 | 1.81% | -1.75% |
| ALT | Altimmune | | Health Care | 7.30 | 42 | 1.53% | -35.14% |
| ALPN | Alpine Immune | | Health Care | 64.60 | 56 | 0.00% | 239.29% |
| CPSS | Consumer Portfolio | | Financials | 8.91 | 85 | 1.48% | -4.91% |
| PFMT | Performant Financial | | Services & Goods | 2.78 | 62 | -1.77% | -11.04% |
| CNTY | Century Casinos | | Services & Goods | 3.10 | 85 | -0.32% | -36.48% |
| LEU | Centrus Energy | | Materials | 45.05 | 90 | -0.04% | -17.20% |
| RNGR | Ranger Energy | | Energy | 10.05 | 42 | 1.11% | -1.76% |
| JILL | J.Jill | | Services & Goods | 27.54 | 100 | 2.38% | 6.83% |
| ACRS | Aclaris | | Health Care | 1.36 | 95 | 3.82% | 29.52% |
| STKS | ONE Group | | Services & Goods | 5.11 | 53 | 0.00% | -16.50% |
| PLL | Piedmont Lithium | | Industrials | 13.33 | 74 | 2.22% | -52.88% |
| ATNM | Actinium | | Health Care | 8.96 | 93 | 2.40% | 76.38% |
| AMPY | Amplify Energy | | Energy | 7.06 | 61 | -0.14% | 19.06% |
| SD | SandRidge Energy | | Energy | 13.62 | 54 | 0.15% | -0.37% |
| FLL | Full House | | Services & Goods | 4.99 | 10 | -1.38% | -7.08% |
| PLX | Protalix Bio | | Health Care | 1.14 | 17 | -1.72% | -35.96% |
| AEHR | Aehr Test | | Technology | 11.64 | 42 | -1.02% | -56.13% |
| MVIS | MicroVision | | Technology | 1.61 | 59 | 1.90% | -39.47% |
| BBW | Build-A-Bear Workshop | | Services & Goods | 29.95 | 70 | -0.40% | 30.27% |
| HNRG | Hallador Energy | | Materials | 5.17 | 52 | 0.98% | -41.52% |
| For chart view version of above stock list: Chart View ➞ 0 - 25 , 25 - 50 , 50 - 75 , 75 - 100 , 100 - 125 , 125 - 150 , 150 - 175 , 175 - 200 | ||
 | Click To Change The Sort Order: By Market Cap or Company Size Performance: Year-to-date, Week and Day |  |
| Too many stocks? View smallcap stocks filtered by marketcap & sector |
| Marketcap: All SmallCap Stocks (default-no microcap), Large, Mid-Range, Small |
| Smallcap Sector: Tech, Finance, Energy, Staples, Retail, Industrial, Materials, & Medical |
|
Get the most comprehensive stock market coverage daily at 12Stocks.com ➞ Best Stocks Today ➞ Best Stocks Weekly ➞ Best Stocks Year-to-Date ➞ Best Stocks Trends ➞  Best Stocks Today 12Stocks.com Best Nasdaq Stocks ➞ Best S&P 500 Stocks ➞ Best Tech Stocks ➞ Best Biotech Stocks ➞ |
| Detailed Overview of SmallCap Stocks |
| SmallCap Technical Overview, Leaders & Laggards, Top SmallCap ETF Funds & Detailed SmallCap Stocks List, Charts, Trends & More |
| Smallcap: Technical Analysis, Trends & YTD Performance | |
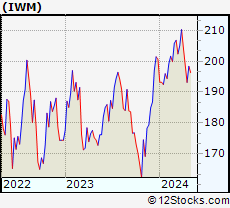
| SmallCap segment as represented by
IWM, an exchange-traded fund [ETF], holds basket of thousands of smallcap stocks from across all major sectors of the US stock market. The smallcap index (contains stocks like Riverbed & Sotheby's) is up by 0.59% and is currently underperforming the overall market by -6.29% year-to-date. Below is a quick view of technical charts and trends: | |
 IWM Weekly Chart |
|
| Long Term Trend: Not Good | |
| Medium Term Trend: Very Good | |
 IWM Daily Chart |
|
| Short Term Trend: Very Good | |
| Overall Trend Score: 69 | |
| YTD Performance: 0.59% | |
| **Trend Scores & Views Are Only For Educational Purposes And Not For Investing | |
| 12Stocks.com: Top Performing Small Cap Index Stocks | ||||||||||||||||||||||||||||||||||||||||||||||||
 The top performing Small Cap Index stocks year to date are
Now, more recently, over last week, the top performing Small Cap Index stocks on the move are


|
||||||||||||||||||||||||||||||||||||||||||||||||
| 12Stocks.com: Investing in Smallcap Index using Exchange Traded Funds | |
|
The following table shows list of key exchange traded funds (ETF) that
help investors track Smallcap index. The following list also includes leveraged ETF funds that track twice or thrice the daily returns of Smallcap indices. Short or inverse ETF funds move in the opposite direction to the index they track and are useful during market pullbacks or during bear markets. Quick View: Move mouse or cursor over ETF symbol (ticker) to view short-term technical chart and over ETF name to view long term chart. Click on ticker or stock name for detailed view. Click on to add stock symbol to your watchlist and to view watchlist. |
12Stocks.com List of ETFs that track Smallcap Index
| Ticker | ETF Name | Watchlist | Recent Price | Smart Investing & Trading Score | Change % | Week % | Year-to-date % |
| IWM | iShares Russell 2000 | | 201.90 | 69 | 0.99 | 1.77 | 0.59% |
| IJR | iShares Core S&P Small-Cap | | 107.13 | 82 | 0.75 | 1.4 | -1.03% |
| VTWO | Vanguard Russell 2000 ETF | | 81.61 | 69 | 0.94 | 1.73 | 0.63% |
| IWN | iShares Russell 2000 Value | | 154.21 | 100 | 0.87 | 2.03 | -0.72% |
| IJS | iShares S&P Small-Cap 600 Value | | 98.72 | 64 | 0.71 | 1.57 | -4.22% |
| IWO | iShares Russell 2000 Growth | | 256.87 | 57 | 0.99 | 1.49 | 1.84% |
| IJT | iShares S&P Small-Cap 600 Growth | | 127.76 | 95 | 0.82 | 1.32 | 2.09% |
| XSLV | PowerShares S&P SmallCap Low Volatil ETF | | 43.22 | 87 | 0.19 | 1.17 | -2.11% |
| SBB | ProShares Short SmallCap600 | | 16.16 | 13 | -1.28 | -1.37 | 1.44% |
| SDD | ProShares UltraShort SmallCap600 | | 18.84 | 23 | -2.41 | -2.61 | 2.27% |
| SAA | ProShares Ultra SmallCap600 | | 23.59 | 69 | 2.86 | 2.39 | -5.45% |
| SMLV | SPDR SSGA US Small Cap Low Volatil ETF | | 109.69 | 87 | 0.78 | 2.01 | -2.52% |
| 12Stocks.com: Charts, Trends, Fundamental Data and Performances of SmallCap Stocks | |
|
We now take in-depth look at all SmallCap stocks including charts, multi-period performances and overall trends (as measured by Smart Investing & Trading Score). One can sort SmallCap stocks (click link to choose) by Daily, Weekly and by Year-to-Date performances. Also, one can sort by size of the company or by market capitalization. |
| Select Your Default Chart Type: | |||||
| |||||
| Click on stock symbol or name for detailed view. Click on to add stock symbol to your watchlist and to view watchlist. Quick View: Move mouse or cursor over "Daily" to quickly view daily technical stock chart and over "Weekly" to view weekly technical stock chart. | |||||

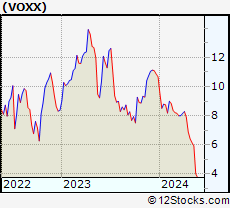 | VOXX VOXX International Corporation |
| Sector: Consumer Staples | |
| SubSector: Auto Parts | |
| MarketCap: 46.0939 Millions | |
| Recent Price: 6.15 Smart Investing & Trading Score: 25 | |
| Day Percent Change: 3.36% Day Change: 0.20 | |
| Week Change: -4.21% Year-to-date Change: -42.4% | |
| VOXX Links: Profile News Message Board | |
| Charts:- Daily , Weekly | |
| Add VOXX to Watchlist: View: Get Complete VOXX Trend Analysis ➞ | |
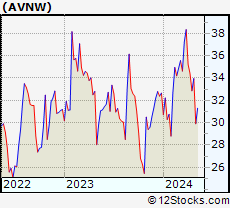 | AVNW Aviat Networks, Inc. |
| Sector: Technology | |
| SubSector: Communication Equipment | |
| MarketCap: 44.9539 Millions | |
| Recent Price: 29.91 Smart Investing & Trading Score: 7 | |
| Day Percent Change: 5.34% Day Change: 1.52 | |
| Week Change: -11.93% Year-to-date Change: -8.4% | |
| AVNW Links: Profile News Message Board | |
| Charts:- Daily , Weekly | |
| Add AVNW to Watchlist: View: Get Complete AVNW Trend Analysis ➞ | |
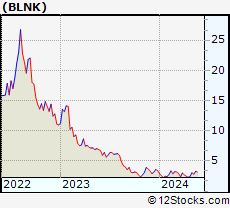 | BLNK Blink Charging Co. |
| Sector: Services & Goods | |
| SubSector: Business Services | |
| MarketCap: 44.4782 Millions | |
| Recent Price: 3.04 Smart Investing & Trading Score: 74 | |
| Day Percent Change: 5.19% Day Change: 0.15 | |
| Week Change: 25.62% Year-to-date Change: -10.3% | |
| BLNK Links: Profile News Message Board | |
| Charts:- Daily , Weekly | |
| Add BLNK to Watchlist: View: Get Complete BLNK Trend Analysis ➞ | |
 | VUZI Vuzix Corporation |
| Sector: Technology | |
| SubSector: Electronic Equipment | |
| MarketCap: 44.37 Millions | |
| Recent Price: 1.31 Smart Investing & Trading Score: 42 | |
| Day Percent Change: -3.68% Day Change: -0.05 | |
| Week Change: -0.76% Year-to-date Change: -37.2% | |
| VUZI Links: Profile News Message Board | |
| Charts:- Daily , Weekly | |
| Add VUZI to Watchlist: View: Get Complete VUZI Trend Analysis ➞ | |
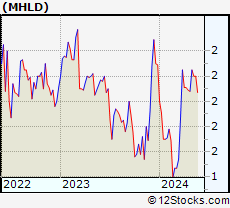 | MHLD Maiden Holdings, Ltd. |
| Sector: Financials | |
| SubSector: Property & Casualty Insurance | |
| MarketCap: 43.5812 Millions | |
| Recent Price: 2.25 Smart Investing & Trading Score: 100 | |
| Day Percent Change: 1.81% Day Change: 0.04 | |
| Week Change: 8.17% Year-to-date Change: -1.8% | |
| MHLD Links: Profile News Message Board | |
| Charts:- Daily , Weekly | |
| Add MHLD to Watchlist: View: Get Complete MHLD Trend Analysis ➞ | |
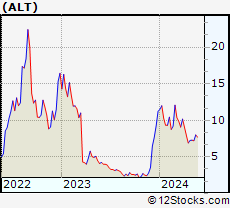 | ALT Altimmune, Inc. |
| Sector: Health Care | |
| SubSector: Biotechnology | |
| MarketCap: 43.5785 Millions | |
| Recent Price: 7.30 Smart Investing & Trading Score: 42 | |
| Day Percent Change: 1.53% Day Change: 0.11 | |
| Week Change: 0.55% Year-to-date Change: -35.1% | |
| ALT Links: Profile News Message Board | |
| Charts:- Daily , Weekly | |
| Add ALT to Watchlist: View: Get Complete ALT Trend Analysis ➞ | |
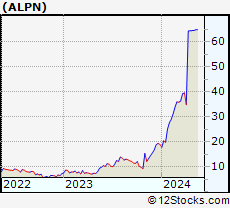 | ALPN Alpine Immune Sciences, Inc. |
| Sector: Health Care | |
| SubSector: Biotechnology | |
| MarketCap: 43.0785 Millions | |
| Recent Price: 64.60 Smart Investing & Trading Score: 56 | |
| Day Percent Change: 0.00% Day Change: 0.00 | |
| Week Change: 0.06% Year-to-date Change: 239.3% | |
| ALPN Links: Profile News Message Board | |
| Charts:- Daily , Weekly | |
| Add ALPN to Watchlist: View: Get Complete ALPN Trend Analysis ➞ | |
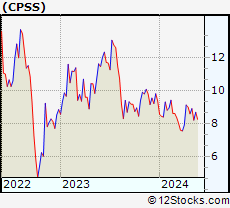 | CPSS Consumer Portfolio Services, Inc. |
| Sector: Financials | |
| SubSector: Credit Services | |
| MarketCap: 42.6208 Millions | |
| Recent Price: 8.91 Smart Investing & Trading Score: 85 | |
| Day Percent Change: 1.48% Day Change: 0.13 | |
| Week Change: 3.73% Year-to-date Change: -4.9% | |
| CPSS Links: Profile News Message Board | |
| Charts:- Daily , Weekly | |
| Add CPSS to Watchlist: View: Get Complete CPSS Trend Analysis ➞ | |
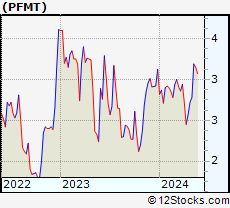 | PFMT Performant Financial Corporation |
| Sector: Services & Goods | |
| SubSector: Business Services | |
| MarketCap: 41.6782 Millions | |
| Recent Price: 2.78 Smart Investing & Trading Score: 62 | |
| Day Percent Change: -1.77% Day Change: -0.05 | |
| Week Change: 2.21% Year-to-date Change: -11.0% | |
| PFMT Links: Profile News Message Board | |
| Charts:- Daily , Weekly | |
| Add PFMT to Watchlist: View: Get Complete PFMT Trend Analysis ➞ | |
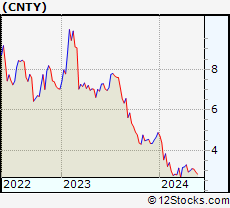 | CNTY Century Casinos, Inc. |
| Sector: Services & Goods | |
| SubSector: Resorts & Casinos | |
| MarketCap: 41.3794 Millions | |
| Recent Price: 3.10 Smart Investing & Trading Score: 85 | |
| Day Percent Change: -0.32% Day Change: -0.01 | |
| Week Change: 3.33% Year-to-date Change: -36.5% | |
| CNTY Links: Profile News Message Board | |
| Charts:- Daily , Weekly | |
| Add CNTY to Watchlist: View: Get Complete CNTY Trend Analysis ➞ | |
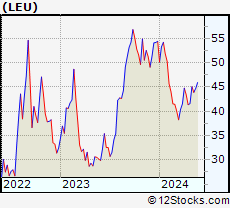 | LEU Centrus Energy Corp. |
| Sector: Materials | |
| SubSector: Industrial Metals & Minerals | |
| MarketCap: 41.191 Millions | |
| Recent Price: 45.05 Smart Investing & Trading Score: 90 | |
| Day Percent Change: -0.04% Day Change: -0.02 | |
| Week Change: 8.37% Year-to-date Change: -17.2% | |
| LEU Links: Profile News Message Board | |
| Charts:- Daily , Weekly | |
| Add LEU to Watchlist: View: Get Complete LEU Trend Analysis ➞ | |
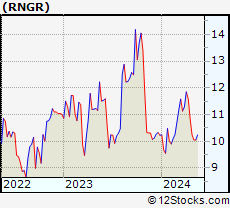 | RNGR Ranger Energy Services, Inc. |
| Sector: Energy | |
| SubSector: Oil & Gas Equipment & Services | |
| MarketCap: 39.4461 Millions | |
| Recent Price: 10.05 Smart Investing & Trading Score: 42 | |
| Day Percent Change: 1.11% Day Change: 0.11 | |
| Week Change: -1.95% Year-to-date Change: -1.8% | |
| RNGR Links: Profile News Message Board | |
| Charts:- Daily , Weekly | |
| Add RNGR to Watchlist: View: Get Complete RNGR Trend Analysis ➞ | |
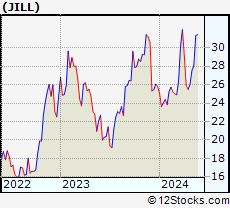 | JILL J.Jill, Inc. |
| Sector: Services & Goods | |
| SubSector: Apparel Stores | |
| MarketCap: 38.7408 Millions | |
| Recent Price: 27.54 Smart Investing & Trading Score: 100 | |
| Day Percent Change: 2.38% Day Change: 0.64 | |
| Week Change: 5.88% Year-to-date Change: 6.8% | |
| JILL Links: Profile News Message Board | |
| Charts:- Daily , Weekly | |
| Add JILL to Watchlist: View: Get Complete JILL Trend Analysis ➞ | |
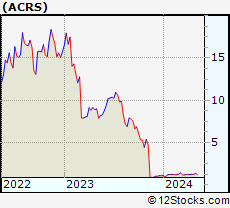 | ACRS Aclaris Therapeutics, Inc. |
| Sector: Health Care | |
| SubSector: Biotechnology | |
| MarketCap: 38.0785 Millions | |
| Recent Price: 1.36 Smart Investing & Trading Score: 95 | |
| Day Percent Change: 3.82% Day Change: 0.05 | |
| Week Change: 13.33% Year-to-date Change: 29.5% | |
| ACRS Links: Profile News Message Board | |
| Charts:- Daily , Weekly | |
| Add ACRS to Watchlist: View: Get Complete ACRS Trend Analysis ➞ | |
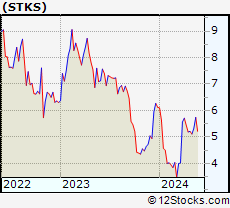 | STKS The ONE Group Hospitality, Inc. |
| Sector: Services & Goods | |
| SubSector: Restaurants | |
| MarketCap: 37.457 Millions | |
| Recent Price: 5.11 Smart Investing & Trading Score: 53 | |
| Day Percent Change: 0.00% Day Change: 0.00 | |
| Week Change: -1.92% Year-to-date Change: -16.5% | |
| STKS Links: Profile News Message Board | |
| Charts:- Daily , Weekly | |
| Add STKS to Watchlist: View: Get Complete STKS Trend Analysis ➞ | |
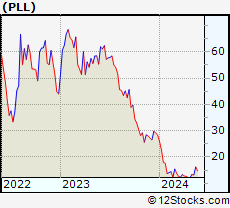 | PLL Piedmont Lithium Limited |
| Sector: Industrials | |
| SubSector: Diversified Machinery | |
| MarketCap: 36.2016 Millions | |
| Recent Price: 13.33 Smart Investing & Trading Score: 74 | |
| Day Percent Change: 2.22% Day Change: 0.29 | |
| Week Change: 9.53% Year-to-date Change: -52.9% | |
| PLL Links: Profile News Message Board | |
| Charts:- Daily , Weekly | |
| Add PLL to Watchlist: View: Get Complete PLL Trend Analysis ➞ | |
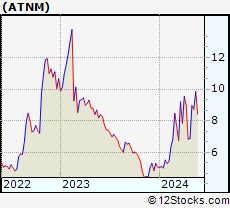 | ATNM Actinium Pharmaceuticals, Inc. |
| Sector: Health Care | |
| SubSector: Biotechnology | |
| MarketCap: 34.6785 Millions | |
| Recent Price: 8.96 Smart Investing & Trading Score: 93 | |
| Day Percent Change: 2.40% Day Change: 0.21 | |
| Week Change: 30.42% Year-to-date Change: 76.4% | |
| ATNM Links: Profile News Message Board | |
| Charts:- Daily , Weekly | |
| Add ATNM to Watchlist: View: Get Complete ATNM Trend Analysis ➞ | |
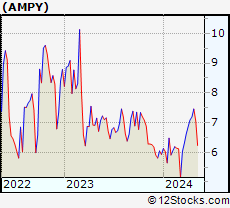 | AMPY Amplify Energy Corp. |
| Sector: Energy | |
| SubSector: Independent Oil & Gas | |
| MarketCap: 34.2593 Millions | |
| Recent Price: 7.06 Smart Investing & Trading Score: 61 | |
| Day Percent Change: -0.14% Day Change: -0.01 | |
| Week Change: -5.36% Year-to-date Change: 19.1% | |
| AMPY Links: Profile News Message Board | |
| Charts:- Daily , Weekly | |
| Add AMPY to Watchlist: View: Get Complete AMPY Trend Analysis ➞ | |
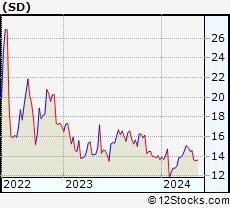 | SD SandRidge Energy, Inc. |
| Sector: Energy | |
| SubSector: Oil & Gas Drilling & Exploration | |
| MarketCap: 33.6139 Millions | |
| Recent Price: 13.62 Smart Investing & Trading Score: 54 | |
| Day Percent Change: 0.15% Day Change: 0.02 | |
| Week Change: -6.39% Year-to-date Change: -0.4% | |
| SD Links: Profile News Message Board | |
| Charts:- Daily , Weekly | |
| Add SD to Watchlist: View: Get Complete SD Trend Analysis ➞ | |
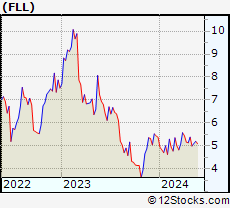 | FLL Full House Resorts, Inc. |
| Sector: Services & Goods | |
| SubSector: Resorts & Casinos | |
| MarketCap: 33.5794 Millions | |
| Recent Price: 4.99 Smart Investing & Trading Score: 10 | |
| Day Percent Change: -1.38% Day Change: -0.07 | |
| Week Change: -7.25% Year-to-date Change: -7.1% | |
| FLL Links: Profile News Message Board | |
| Charts:- Daily , Weekly | |
| Add FLL to Watchlist: View: Get Complete FLL Trend Analysis ➞ | |
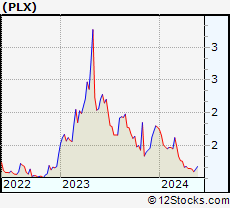 | PLX Protalix BioTherapeutics, Inc. |
| Sector: Health Care | |
| SubSector: Biotechnology | |
| MarketCap: 32.3785 Millions | |
| Recent Price: 1.14 Smart Investing & Trading Score: 17 | |
| Day Percent Change: -1.72% Day Change: -0.02 | |
| Week Change: -0.87% Year-to-date Change: -36.0% | |
| PLX Links: Profile News Message Board | |
| Charts:- Daily , Weekly | |
| Add PLX to Watchlist: View: Get Complete PLX Trend Analysis ➞ | |
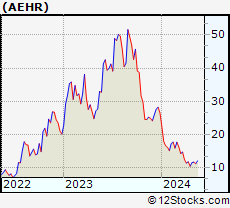 | AEHR Aehr Test Systems |
| Sector: Technology | |
| SubSector: Semiconductor Equipment & Materials | |
| MarketCap: 32.2918 Millions | |
| Recent Price: 11.64 Smart Investing & Trading Score: 42 | |
| Day Percent Change: -1.02% Day Change: -0.12 | |
| Week Change: 1.48% Year-to-date Change: -56.1% | |
| AEHR Links: Profile News Message Board | |
| Charts:- Daily , Weekly | |
| Add AEHR to Watchlist: View: Get Complete AEHR Trend Analysis ➞ | |
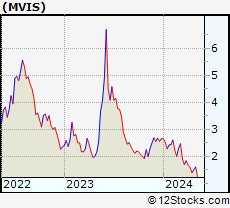 | MVIS MicroVision, Inc. |
| Sector: Technology | |
| SubSector: Scientific & Technical Instruments | |
| MarketCap: 32.1553 Millions | |
| Recent Price: 1.61 Smart Investing & Trading Score: 59 | |
| Day Percent Change: 1.90% Day Change: 0.03 | |
| Week Change: 7.33% Year-to-date Change: -39.5% | |
| MVIS Links: Profile News Message Board | |
| Charts:- Daily , Weekly | |
| Add MVIS to Watchlist: View: Get Complete MVIS Trend Analysis ➞ | |
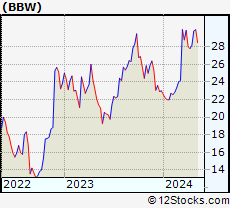 | BBW Build-A-Bear Workshop, Inc. |
| Sector: Services & Goods | |
| SubSector: Toy & Hobby Stores | |
| MarketCap: 31.997 Millions | |
| Recent Price: 29.95 Smart Investing & Trading Score: 70 | |
| Day Percent Change: -0.40% Day Change: -0.12 | |
| Week Change: 0.54% Year-to-date Change: 30.3% | |
| BBW Links: Profile News Message Board | |
| Charts:- Daily , Weekly | |
| Add BBW to Watchlist: View: Get Complete BBW Trend Analysis ➞ | |
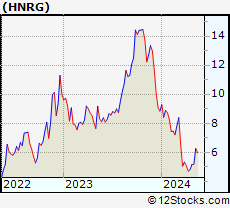 | HNRG Hallador Energy Company |
| Sector: Materials | |
| SubSector: Nonmetallic Mineral Mining | |
| MarketCap: 30.35 Millions | |
| Recent Price: 5.17 Smart Investing & Trading Score: 52 | |
| Day Percent Change: 0.98% Day Change: 0.05 | |
| Week Change: 0% Year-to-date Change: -41.5% | |
| HNRG Links: Profile News Message Board | |
| Charts:- Daily , Weekly | |
| Add HNRG to Watchlist: View: Get Complete HNRG Trend Analysis ➞ | |
| For tabular summary view of above stock list: Summary View ➞ 0 - 25 , 25 - 50 , 50 - 75 , 75 - 100 , 100 - 125 , 125 - 150 , 150 - 175 , 175 - 200 | ||
| Click To Change The Sort Order: By Market Cap or Company Size Performance: Year-to-date, Week and Day | |
| Select Chart Type: | ||
| Too many stocks? View smallcap stocks filtered by marketcap & sector |
| Marketcap: All SmallCap Stocks (default-no microcap), Large, Mid-Range, Small & MicroCap |
| Sector: Tech, Finance, Energy, Staples, Retail, Industrial, Materials, Utilities & Medical |
|
Best Stocks Today 12Stocks.com |
© 2024 12Stocks.com Terms & Conditions Privacy Contact Us
All Information Provided Only For Education And Not To Be Used For Investing or Trading. See Terms & Conditions


One More Thing ... Get Best Stocks Delivered Daily!
Never Ever Miss A Move With Our Top Ten Stocks Lists
Find Best Stocks In Any Market - Bull or Bear Market
Take A Peek At Our Top Ten Stocks Lists: Daily, Weekly, Year-to-Date & Top Trends
Find Best Stocks In Any Market - Bull or Bear Market
Take A Peek At Our Top Ten Stocks Lists: Daily, Weekly, Year-to-Date & Top Trends
Smallcap Stocks With Best Up Trends [0-bearish to 100-bullish]: Twist Bioscience[100], WideOpenWest [100], Joint [100], FTC Solar[100], Origin Materials[100], Alignment Healthcare[100], Clarus [100], IES [100], Emergent BioSolutions[100], Enovix [100], El Pollo[100]
Best Smallcap Stocks Year-to-Date:
Janux [482.74%], Viking [313.59%], Longboard [272.5%], Alpine Immune[239.29%], Bakkt [199.55%], Avidity Biosciences[192.48%], Vera [189.47%], Cullinan Oncology[176.9%], Super Micro[175.35%], Y-mAbs [151.47%], Sana [149.33%] Best Smallcap Stocks This Week:
Emergent BioSolutions[102.6%], Deciphera [73.24%], Origin Materials[66.52%], Eyenovia [60.78%], Cue Biopharma[56.04%], Aspen Aerogels[55.96%], Enovix [54.02%], Luna Innovations[53.77%], Codexis [47.37%], Carvana Co[44.31%], Office Properties[42.79%] Best Smallcap Stocks Daily:
Luna Innovations[36.00%], Twist Bioscience[28.74%], Ardelyx [28.42%], WideOpenWest [28.23%], 2U [26.63%], Joint [25.35%], FTC Solar[25.09%], Origin Materials[22.23%], Alignment Healthcare[21.97%], Clarus [18.67%], Aurora Innovation[18.09%]