
 Login Sign Up


| |||||
 |  | ||||

| 12Stocks.com Market Intelligence |
Best SmallCap Stocks
|
| In a hurry? Small Cap Stock Lists: Performance Trends Table, Stock Charts
Sort Small Cap stocks: Daily, Weekly, Year-to-Date, Market Cap & Trends. Filter Small Cap stocks list by sector: Show all, Tech, Finance, Energy, Staples, Retail, Industrial, Materials, Utilities and HealthCare Filter Small Cap stocks list by size: All Large Medium Small and MicroCap |
| 12Stocks.com Small Cap Stocks Performances & Trends Daily | |||||||||
|
|  The overall Smart Investing & Trading Score is 41 (0-bearish to 100-bullish) which puts Small Cap index in short term neutral trend. The Smart Investing & Trading Score from previous trading session is 88 and hence a deterioration of trend.
| ||||||||
Here are the Smart Investing & Trading Scores of the most requested small cap stocks at 12Stocks.com (click stock name for detailed review):
|


| 12Stocks.com: Investing in Smallcap Index with Stocks | |
|
The following table helps investors and traders sort through current performance and trends (as measured by Smart Investing & Trading Score) of various
stocks in the Smallcap Index. Quick View: Move mouse or cursor over stock symbol (ticker) to view short-term technical chart and over stock name to view long term chart. Click on  to add stock symbol to your watchlist and to add stock symbol to your watchlist and  to view watchlist. Click on any ticker or stock name for detailed market intelligence report for that stock. to view watchlist. Click on any ticker or stock name for detailed market intelligence report for that stock. |
12Stocks.com Performance of Stocks in Smallcap Index
| Ticker | Stock Name | Watchlist | Category | Recent Price | Smart Investing & Trading Score | Change % | YTD Change% |
| EXPI | eXp World |   | Financials | 9.94 | 43 | -3.40% | -35.95% |
| RILY | B. Riley | | Financials | 34.50 | 100 | -10.51% | 64.36% |
| UMH | UMH Properties | | Financials | 15.92 | 100 | -0.06% | 3.92% |
| THFF | First Financial | | Financials | 36.37 | 42 | -0.74% | -15.48% |
| BSIG | BrightSphere | | Financials | 22.24 | 51 | -1.46% | 16.08% |
| GOOD | Gladstone Commercial | | Financials | 13.38 | 68 | 0.64% | 1.02% |
| HTBK | Heritage Commerce | | Financials | 7.93 | 49 | -1.12% | -20.06% |
| AROW | Arrow Financial | | Financials | 22.35 | 49 | -1.97% | -20.01% |
| CPF | Central Pacific | | Financials | 19.94 | 88 | -1.48% | 1.32% |
| HBNC | Horizon Bancorp | | Financials | 11.48 | 27 | -0.52% | -19.78% |
| INN | Summit Hotel | | Financials | 6.01 | 30 | -2.75% | -10.57% |
| MSBI | Midland States | | Financials | 21.86 | 0 | -2.84% | -20.68% |
| LOB | Live Oak | | Financials | 32.32 | 0 | -3.46% | -28.97% |
| FCBC | First Community | | Financials | 33.34 | 32 | 0.09% | -10.13% |
| BLX | Banco Latinoamericano | | Financials | 28.41 | 31 | -2.94% | 14.83% |
| CUBI | Customers Bancorp | | Financials | 45.67 | 17 | -4.05% | -20.74% |
| BY | Byline Bancorp | | Financials | 21.67 | 80 | -0.23% | -8.02% |
| EFC | Ellington Financial | | Financials | 11.44 | 42 | -1.04% | -9.99% |
| OLP | One Liberty | | Financials | 22.91 | 100 | -0.13% | 4.56% |
| FSBC | Five Star | | Financials | 21.60 | 25 | 0.09% | -17.49% |
| HIPO | Hippo | | Financials | 21.39 | 68 | -2.55% | 134.80% |
| ONL | Orion Office | | Financials | 3.12 | 35 | -4.59% | -45.45% |
| FRPH | FRP | | Financials | 30.24 | 25 | -1.63% | -51.91% |
| FMBH | First Mid | | Financials | 30.98 | 42 | -1.51% | -10.63% |
| MBWM | Mercantile Bank | | Financials | 36.10 | 25 | 0.00% | -10.60% |
| For chart view version of above stock list: Chart View ➞ 0 - 25 , 25 - 50 , 50 - 75 , 75 - 100 , 100 - 125 , 125 - 150 , 150 - 175 , 175 - 200 , 200 - 225 , 225 - 250 , 250 - 275 , 275 - 300 , 300 - 325 , 325 - 350 , 350 - 375 , 375 - 400 | ||
 | Click To Change The Sort Order: By Market Cap or Company Size Performance: Year-to-date, Week and Day |  |
| Too many stocks? View smallcap stocks filtered by marketcap & sector |
| Marketcap: All SmallCap Stocks (default-no microcap), Large, Mid-Range, Small |
| Smallcap Sector: Tech, Finance, Energy, Staples, Retail, Industrial, Materials, & Medical |
|
Get the most comprehensive stock market coverage daily at 12Stocks.com ➞ Best Stocks Today ➞ Best Stocks Weekly ➞ Best Stocks Year-to-Date ➞ Best Stocks Trends ➞  Best Stocks Today 12Stocks.com Best Nasdaq Stocks ➞ Best S&P 500 Stocks ➞ Best Tech Stocks ➞ Best Biotech Stocks ➞ |
| Detailed Overview of SmallCap Stocks |
| SmallCap Technical Overview, Leaders & Laggards, Top SmallCap ETF Funds & Detailed SmallCap Stocks List, Charts, Trends & More |
| Smallcap: Technical Analysis, Trends & YTD Performance | |
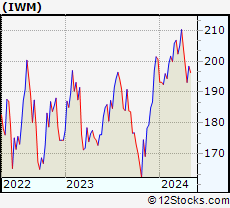
| SmallCap segment as represented by
IWM, an exchange-traded fund [ETF], holds basket of thousands of smallcap stocks from across all major sectors of the US stock market. The smallcap index (contains stocks like Riverbed & Sotheby's) is down by -2.4% and is currently underperforming the overall market by -7.2% year-to-date. Below is a quick view of technical charts and trends: | |
 IWM Weekly Chart |
|
| Long Term Trend: Good | |
| Medium Term Trend: Not Good | |
 IWM Daily Chart |
|
| Short Term Trend: Good | |
| Overall Trend Score: 41 | |
| YTD Performance: -2.4% | |
| **Trend Scores & Views Are Only For Educational Purposes And Not For Investing | |
| 12Stocks.com: Top Performing Small Cap Index Stocks | ||||||||||||||||||||||||||||||||||||||||||||||||
 The top performing Small Cap Index stocks year to date are
Now, more recently, over last week, the top performing Small Cap Index stocks on the move are


|
||||||||||||||||||||||||||||||||||||||||||||||||
| 12Stocks.com: Investing in Smallcap Index using Exchange Traded Funds | |
|
The following table shows list of key exchange traded funds (ETF) that
help investors track Smallcap index. The following list also includes leveraged ETF funds that track twice or thrice the daily returns of Smallcap indices. Short or inverse ETF funds move in the opposite direction to the index they track and are useful during market pullbacks or during bear markets. Quick View: Move mouse or cursor over ETF symbol (ticker) to view short-term technical chart and over ETF name to view long term chart. Click on ticker or stock name for detailed view. Click on to add stock symbol to your watchlist and to view watchlist. |
12Stocks.com List of ETFs that track Smallcap Index
| Ticker | ETF Name | Watchlist | Recent Price | Smart Investing & Trading Score | Change % | Week % | Year-to-date % |
| IWM | iShares Russell 2000 | | 195.90 | 41 | -2.03 | -1.26 | -2.4% |
| IJR | iShares Core S&P Small-Cap | | 104.44 | 86 | -1.85 | -1.15 | -3.52% |
| VTWO | Vanguard Russell 2000 ETF | | 79.17 | 81 | -2.01 | -1.32 | -2.39% |
| IWN | iShares Russell 2000 Value | | 148.97 | 86 | -2.03 | -1.44 | -4.09% |
| IWO | iShares Russell 2000 Growth | | 250.22 | 81 | -2.16 | -1.13 | -0.79% |
| IJS | iShares S&P Small-Cap 600 Value | | 96.07 | 68 | -1.92 | -1.15 | -6.79% |
| IJT | iShares S&P Small-Cap 600 Growth | | 124.59 | 88 | -1.87 | -1.19 | -0.44% |
| XSLV | PowerShares S&P SmallCap Low Volatil ETF | | 42.74 | 73 | -0.29 | 0.06 | -3.18% |
| SMLV | SPDR SSGA US Small Cap Low Volatil ETF | | 106.26 | 61 | -1.40 | -1.17 | -5.56% |
| SDD | ProShares UltraShort SmallCap600 | | 19.57 | 17 | 2.51 | 1.14 | 6.21% |
| SAA | ProShares Ultra SmallCap600 | | 22.60 | 81 | -2.88 | -1.91 | -9.42% |
| SBB | ProShares Short SmallCap600 | | 16.55 | 15 | 1.66 | 1.01 | 3.89% |
| 12Stocks.com: Charts, Trends, Fundamental Data and Performances of SmallCap Stocks | |
|
We now take in-depth look at all SmallCap stocks including charts, multi-period performances and overall trends (as measured by Smart Investing & Trading Score). One can sort SmallCap stocks (click link to choose) by Daily, Weekly and by Year-to-Date performances. Also, one can sort by size of the company or by market capitalization. |
| Select Your Default Chart Type: | |||||
| |||||
| Click on stock symbol or name for detailed view. Click on to add stock symbol to your watchlist and to view watchlist. Quick View: Move mouse or cursor over "Daily" to quickly view daily technical stock chart and over "Weekly" to view weekly technical stock chart. | |||||

 | EXPI eXp World Holdings, Inc. |
| Sector: Financials | |
| SubSector: Property Management | |
| MarketCap: 448.042 Millions | |
| Recent Price: 9.94 Smart Investing & Trading Score: 43 | |
| Day Percent Change: -3.40% Day Change: -0.35 | |
| Week Change: -1.78% Year-to-date Change: -36.0% | |
| EXPI Links: Profile News Message Board | |
| Charts:- Daily , Weekly | |
| Add EXPI to Watchlist: View: Get Complete EXPI Trend Analysis ➞ | |
 | RILY B. Riley Financial, Inc. |
| Sector: Financials | |
| SubSector: Asset Management | |
| MarketCap: 443.703 Millions | |
| Recent Price: 34.50 Smart Investing & Trading Score: 100 | |
| Day Percent Change: -10.51% Day Change: -4.05 | |
| Week Change: -6.3% Year-to-date Change: 64.4% | |
| RILY Links: Profile News Message Board | |
| Charts:- Daily , Weekly | |
| Add RILY to Watchlist: View: Get Complete RILY Trend Analysis ➞ | |
 | UMH UMH Properties, Inc. |
| Sector: Financials | |
| SubSector: REIT - Diversified | |
| MarketCap: 433.353 Millions | |
| Recent Price: 15.92 Smart Investing & Trading Score: 100 | |
| Day Percent Change: -0.06% Day Change: -0.01 | |
| Week Change: 1.66% Year-to-date Change: 3.9% | |
| UMH Links: Profile News Message Board | |
| Charts:- Daily , Weekly | |
| Add UMH to Watchlist: View: Get Complete UMH Trend Analysis ➞ | |
 | THFF First Financial Corporation |
| Sector: Financials | |
| SubSector: Regional - Midwest Banks | |
| MarketCap: 433.07 Millions | |
| Recent Price: 36.37 Smart Investing & Trading Score: 42 | |
| Day Percent Change: -0.74% Day Change: -0.27 | |
| Week Change: -1.33% Year-to-date Change: -15.5% | |
| THFF Links: Profile News Message Board | |
| Charts:- Daily , Weekly | |
| Add THFF to Watchlist: View: Get Complete THFF Trend Analysis ➞ | |
 | BSIG BrightSphere Investment Group Inc. |
| Sector: Financials | |
| SubSector: Asset Management | |
| MarketCap: 430.103 Millions | |
| Recent Price: 22.24 Smart Investing & Trading Score: 51 | |
| Day Percent Change: -1.46% Day Change: -0.33 | |
| Week Change: -1.64% Year-to-date Change: 16.1% | |
| BSIG Links: Profile News Message Board | |
| Charts:- Daily , Weekly | |
| Add BSIG to Watchlist: View: Get Complete BSIG Trend Analysis ➞ | |
 | GOOD Gladstone Commercial Corporation |
| Sector: Financials | |
| SubSector: REIT - Diversified | |
| MarketCap: 425.253 Millions | |
| Recent Price: 13.38 Smart Investing & Trading Score: 68 | |
| Day Percent Change: 0.64% Day Change: 0.09 | |
| Week Change: 0.34% Year-to-date Change: 1.0% | |
| GOOD Links: Profile News Message Board | |
| Charts:- Daily , Weekly | |
| Add GOOD to Watchlist: View: Get Complete GOOD Trend Analysis ➞ | |
 | HTBK Heritage Commerce Corp |
| Sector: Financials | |
| SubSector: Regional - Pacific Banks | |
| MarketCap: 416.129 Millions | |
| Recent Price: 7.93 Smart Investing & Trading Score: 49 | |
| Day Percent Change: -1.12% Day Change: -0.09 | |
| Week Change: -0.88% Year-to-date Change: -20.1% | |
| HTBK Links: Profile News Message Board | |
| Charts:- Daily , Weekly | |
| Add HTBK to Watchlist: View: Get Complete HTBK Trend Analysis ➞ | |
 | AROW Arrow Financial Corporation |
| Sector: Financials | |
| SubSector: Regional - Northeast Banks | |
| MarketCap: 413.999 Millions | |
| Recent Price: 22.35 Smart Investing & Trading Score: 49 | |
| Day Percent Change: -1.97% Day Change: -0.45 | |
| Week Change: -2.66% Year-to-date Change: -20.0% | |
| AROW Links: Profile News Message Board | |
| Charts:- Daily , Weekly | |
| Add AROW to Watchlist: View: Get Complete AROW Trend Analysis ➞ | |
 | CPF Central Pacific Financial Corp. |
| Sector: Financials | |
| SubSector: Regional - Pacific Banks | |
| MarketCap: 407.429 Millions | |
| Recent Price: 19.94 Smart Investing & Trading Score: 88 | |
| Day Percent Change: -1.48% Day Change: -0.30 | |
| Week Change: -0.89% Year-to-date Change: 1.3% | |
| CPF Links: Profile News Message Board | |
| Charts:- Daily , Weekly | |
| Add CPF to Watchlist: View: Get Complete CPF Trend Analysis ➞ | |
 | HBNC Horizon Bancorp, Inc. |
| Sector: Financials | |
| SubSector: Regional - Northeast Banks | |
| MarketCap: 405.999 Millions | |
| Recent Price: 11.48 Smart Investing & Trading Score: 27 | |
| Day Percent Change: -0.52% Day Change: -0.06 | |
| Week Change: -1.54% Year-to-date Change: -19.8% | |
| HBNC Links: Profile News Message Board | |
| Charts:- Daily , Weekly | |
| Add HBNC to Watchlist: View: Get Complete HBNC Trend Analysis ➞ | |
 | INN Summit Hotel Properties, Inc. |
| Sector: Financials | |
| SubSector: Real Estate Development | |
| MarketCap: 402.019 Millions | |
| Recent Price: 6.01 Smart Investing & Trading Score: 30 | |
| Day Percent Change: -2.75% Day Change: -0.17 | |
| Week Change: -1.96% Year-to-date Change: -10.6% | |
| INN Links: Profile News Message Board | |
| Charts:- Daily , Weekly | |
| Add INN to Watchlist: View: Get Complete INN Trend Analysis ➞ | |
 | MSBI Midland States Bancorp, Inc. |
| Sector: Financials | |
| SubSector: Regional - Midwest Banks | |
| MarketCap: 400.27 Millions | |
| Recent Price: 21.86 Smart Investing & Trading Score: 0 | |
| Day Percent Change: -2.84% Day Change: -0.64 | |
| Week Change: -2.24% Year-to-date Change: -20.7% | |
| MSBI Links: Profile News Message Board | |
| Charts:- Daily , Weekly | |
| Add MSBI to Watchlist: View: Get Complete MSBI Trend Analysis ➞ | |
 | LOB Live Oak Bancshares, Inc. |
| Sector: Financials | |
| SubSector: Savings & Loans | |
| MarketCap: 394.23 Millions | |
| Recent Price: 32.32 Smart Investing & Trading Score: 0 | |
| Day Percent Change: -3.46% Day Change: -1.16 | |
| Week Change: -2.59% Year-to-date Change: -29.0% | |
| LOB Links: Profile News Message Board | |
| Charts:- Daily , Weekly | |
| Add LOB to Watchlist: View: Get Complete LOB Trend Analysis ➞ | |
 | FCBC First Community Bankshares, Inc. |
| Sector: Financials | |
| SubSector: Regional - Mid-Atlantic Banks | |
| MarketCap: 393.459 Millions | |
| Recent Price: 33.34 Smart Investing & Trading Score: 32 | |
| Day Percent Change: 0.09% Day Change: 0.03 | |
| Week Change: -0.51% Year-to-date Change: -10.1% | |
| FCBC Links: Profile News Message Board | |
| Charts:- Daily , Weekly | |
| Add FCBC to Watchlist: View: Get Complete FCBC Trend Analysis ➞ | |
 | BLX Banco Latinoamericano de Comercio Exterior, S.A |
| Sector: Financials | |
| SubSector: Foreign Money Center Banks | |
| MarketCap: 390.471 Millions | |
| Recent Price: 28.41 Smart Investing & Trading Score: 31 | |
| Day Percent Change: -2.94% Day Change: -0.86 | |
| Week Change: -3.96% Year-to-date Change: 14.8% | |
| BLX Links: Profile News Message Board | |
| Charts:- Daily , Weekly | |
| Add BLX to Watchlist: View: Get Complete BLX Trend Analysis ➞ | |
 | CUBI Customers Bancorp, Inc. |
| Sector: Financials | |
| SubSector: Regional - Northeast Banks | |
| MarketCap: 385.399 Millions | |
| Recent Price: 45.67 Smart Investing & Trading Score: 17 | |
| Day Percent Change: -4.05% Day Change: -1.93 | |
| Week Change: -2.46% Year-to-date Change: -20.7% | |
| CUBI Links: Profile News Message Board | |
| Charts:- Daily , Weekly | |
| Add CUBI to Watchlist: View: Get Complete CUBI Trend Analysis ➞ | |
 | BY Byline Bancorp, Inc. |
| Sector: Financials | |
| SubSector: Regional - Midwest Banks | |
| MarketCap: 381.87 Millions | |
| Recent Price: 21.67 Smart Investing & Trading Score: 80 | |
| Day Percent Change: -0.23% Day Change: -0.05 | |
| Week Change: -0.51% Year-to-date Change: -8.0% | |
| BY Links: Profile News Message Board | |
| Charts:- Daily , Weekly | |
| Add BY to Watchlist: View: Get Complete BY Trend Analysis ➞ | |
 | EFC Ellington Financial Inc. |
| Sector: Financials | |
| SubSector: Mortgage Investment | |
| MarketCap: 380.239 Millions | |
| Recent Price: 11.44 Smart Investing & Trading Score: 42 | |
| Day Percent Change: -1.04% Day Change: -0.12 | |
| Week Change: -2.31% Year-to-date Change: -10.0% | |
| EFC Links: Profile News Message Board | |
| Charts:- Daily , Weekly | |
| Add EFC to Watchlist: View: Get Complete EFC Trend Analysis ➞ | |
 | OLP One Liberty Properties, Inc. |
| Sector: Financials | |
| SubSector: REIT - Diversified | |
| MarketCap: 378.353 Millions | |
| Recent Price: 22.91 Smart Investing & Trading Score: 100 | |
| Day Percent Change: -0.13% Day Change: -0.03 | |
| Week Change: 0.79% Year-to-date Change: 4.6% | |
| OLP Links: Profile News Message Board | |
| Charts:- Daily , Weekly | |
| Add OLP to Watchlist: View: Get Complete OLP Trend Analysis ➞ | |
 | FSBC Five Star Bancorp |
| Sector: Financials | |
| SubSector: Banks - Regional | |
| MarketCap: 377 Millions | |
| Recent Price: 21.60 Smart Investing & Trading Score: 25 | |
| Day Percent Change: 0.09% Day Change: 0.02 | |
| Week Change: -0.69% Year-to-date Change: -17.5% | |
| FSBC Links: Profile News Message Board | |
| Charts:- Daily , Weekly | |
| Add FSBC to Watchlist: View: Get Complete FSBC Trend Analysis ➞ | |
 | HIPO Hippo Holdings Inc. |
| Sector: Financials | |
| SubSector: Insurance - Specialty | |
| MarketCap: 377 Millions | |
| Recent Price: 21.39 Smart Investing & Trading Score: 68 | |
| Day Percent Change: -2.55% Day Change: -0.56 | |
| Week Change: -1.97% Year-to-date Change: 134.8% | |
| HIPO Links: Profile News Message Board | |
| Charts:- Daily , Weekly | |
| Add HIPO to Watchlist: View: Get Complete HIPO Trend Analysis ➞ | |
 | ONL Orion Office REIT Inc. |
| Sector: Financials | |
| SubSector: REIT - Office | |
| MarketCap: 375 Millions | |
| Recent Price: 3.12 Smart Investing & Trading Score: 35 | |
| Day Percent Change: -4.59% Day Change: -0.15 | |
| Week Change: -4% Year-to-date Change: -45.5% | |
| ONL Links: Profile News Message Board | |
| Charts:- Daily , Weekly | |
| Add ONL to Watchlist: View: Get Complete ONL Trend Analysis ➞ | |
 | FRPH FRP Holdings, Inc. |
| Sector: Financials | |
| SubSector: Property Management | |
| MarketCap: 374.442 Millions | |
| Recent Price: 30.24 Smart Investing & Trading Score: 25 | |
| Day Percent Change: -1.63% Day Change: -0.50 | |
| Week Change: -0.62% Year-to-date Change: -51.9% | |
| FRPH Links: Profile News Message Board | |
| Charts:- Daily , Weekly | |
| Add FRPH to Watchlist: View: Get Complete FRPH Trend Analysis ➞ | |
 | FMBH First Mid Bancshares, Inc. |
| Sector: Financials | |
| SubSector: Regional - Midwest Banks | |
| MarketCap: 373.27 Millions | |
| Recent Price: 30.98 Smart Investing & Trading Score: 42 | |
| Day Percent Change: -1.51% Day Change: -0.47 | |
| Week Change: -1.7% Year-to-date Change: -10.6% | |
| FMBH Links: Profile News Message Board | |
| Charts:- Daily , Weekly | |
| Add FMBH to Watchlist: View: Get Complete FMBH Trend Analysis ➞ | |
 | MBWM Mercantile Bank Corporation |
| Sector: Financials | |
| SubSector: Regional - Midwest Banks | |
| MarketCap: 372.77 Millions | |
| Recent Price: 36.10 Smart Investing & Trading Score: 25 | |
| Day Percent Change: 0.00% Day Change: 0.00 | |
| Week Change: -0.25% Year-to-date Change: -10.6% | |
| MBWM Links: Profile News Message Board | |
| Charts:- Daily , Weekly | |
| Add MBWM to Watchlist: View: Get Complete MBWM Trend Analysis ➞ | |
| For tabular summary view of above stock list: Summary View ➞ 0 - 25 , 25 - 50 , 50 - 75 , 75 - 100 , 100 - 125 , 125 - 150 , 150 - 175 , 175 - 200 , 200 - 225 , 225 - 250 , 250 - 275 , 275 - 300 , 300 - 325 , 325 - 350 , 350 - 375 , 375 - 400 | ||
| Click To Change The Sort Order: By Market Cap or Company Size Performance: Year-to-date, Week and Day | |
| Select Chart Type: | ||
| Too many stocks? View smallcap stocks filtered by marketcap & sector |
| Marketcap: All SmallCap Stocks (default-no microcap), Large, Mid-Range, Small & MicroCap |
| Sector: Tech, Finance, Energy, Staples, Retail, Industrial, Materials, Utilities & Medical |
|
Best Stocks Today 12Stocks.com |
© 2024 12Stocks.com Terms & Conditions Privacy Contact Us
All Information Provided Only For Education And Not To Be Used For Investing or Trading. See Terms & Conditions


One More Thing ... Get Best Stocks Delivered Daily!
Never Ever Miss A Move With Our Top Ten Stocks Lists
Find Best Stocks In Any Market - Bull or Bear Market
Take A Peek At Our Top Ten Stocks Lists: Daily, Weekly, Year-to-Date & Top Trends
Find Best Stocks In Any Market - Bull or Bear Market
Take A Peek At Our Top Ten Stocks Lists: Daily, Weekly, Year-to-Date & Top Trends
Smallcap Stocks With Best Up Trends [0-bearish to 100-bullish]: Allegheny [100], Brinker [100], Day One[100], Heartland Financial[100], Carpenter [100], LTC Properties[100], California Water[100], Semtech [100], Impinj [100], Sensient [100], Costamare [100]
Best Smallcap Stocks Year-to-Date:
Janux [431.32%], Viking [327.24%], Longboard [248.2%], Alpine Immune[239.15%], Super Micro[202.31%], Bakkt [200.9%], Avidity Biosciences[167.04%], Cullinan Oncology[164.88%], Arcutis Bio[157.12%], Vera [155.36%], Hippo [134.8%] Best Smallcap Stocks This Week:
Deciphera [72.49%], Cue Biopharma[39.19%], GrowGeneration [35.14%], Phibro Animal[31.15%], LendingTree [27.26%], Janux [20.3%], Seres [20.07%], Eyenovia [18.75%], P3 Health[18.22%], Heartland Financial[17.92%], Harmonic [16.96%] Best Smallcap Stocks Daily:
Cue Biopharma[33.80%], GrowGeneration [30.43%], LendingTree [29.13%], SES AI[17.04%], Allegheny [15.03%], AnaptysBio [14.58%], Harmonic [14.47%], LSB Industries[13.14%], P3 Health[12.09%], Clearwater Paper[10.69%], Brightcove [9.15%]