
 Login Sign Up


| |||||
 |  | ||||

| 12Stocks.com Market Intelligence |
Best SmallCap Stocks
|
| In a hurry? Small Cap Stock Lists: Performance Trends Table, Stock Charts
Sort Small Cap stocks: Daily, Weekly, Year-to-Date, Market Cap & Trends. Filter Small Cap stocks list by sector: Show all, Tech, Finance, Energy, Staples, Retail, Industrial, Materials, Utilities and HealthCare Filter Small Cap stocks list by size: All Large Medium Small and MicroCap |
| 12Stocks.com Small Cap Stocks Performances & Trends Daily | |||||||||
|
|  The overall Smart Investing & Trading Score is 49 (0-bearish to 100-bullish) which puts Small Cap index in short term neutral trend. The Smart Investing & Trading Score from previous trading session is 14 and hence an improvement of trend.
| ||||||||
Here are the Smart Investing & Trading Scores of the most requested small cap stocks at 12Stocks.com (click stock name for detailed review):
|


| 12Stocks.com: Investing in Smallcap Index with Stocks | |
|
The following table helps investors and traders sort through current performance and trends (as measured by Smart Investing & Trading Score) of various
stocks in the Smallcap Index. Quick View: Move mouse or cursor over stock symbol (ticker) to view short-term technical chart and over stock name to view long term chart. Click on  to add stock symbol to your watchlist and to add stock symbol to your watchlist and  to view watchlist. Click on any ticker or stock name for detailed market intelligence report for that stock. to view watchlist. Click on any ticker or stock name for detailed market intelligence report for that stock. |
12Stocks.com Performance of Stocks in Smallcap Index
| Ticker | Stock Name | Watchlist | Category | Recent Price | Smart Investing & Trading Score | Change % | YTD Change% |
| CRC | California Resources |   | Energy | 51.50 | 0 | 0.80% | -5.82% |
| CHRD | Chord Energy | | Energy | 176.22 | 46 | 1.99% | 5.60% |
| NE | Noble | | Energy | 44.07 | 36 | 0.96% | -8.49% |
| VAL | Valaris | | Energy | 65.05 | 43 | 1.55% | -5.13% |
| SDRL | Seadrill | | Energy | 48.16 | 36 | -0.13% | 1.57% |
| DM | Dominion Midstream | | Energy | 0.80 | 25 | 1.41% | 6.09% |
| CVI | CVR Energy | | Energy | 29.43 | 0 | 0.20% | -2.87% |
| GPOR | Gulfport Energy | | Energy | 150.59 | 26 | 0.01% | 13.06% |
| ACDC | ProFrac Holding | | Energy | 6.77 | 10 | -0.88% | -20.45% |
| HP | Helmerich & Payne | | Energy | 37.83 | 0 | -0.99% | 4.45% |
| ETRN | Equitrans Midstream | | Energy | 13.44 | 60 | 2.60% | 32.02% |
| CRGY | Crescent Energy | | Energy | 10.47 | 10 | 2.25% | -20.62% |
| CNX | CNX Resources | | Energy | 23.20 | 41 | 1.18% | 16.00% |
| DO | Diamond Offshore | | Energy | 12.60 | 53 | 2.52% | -3.60% |
| DK | Delek US | | Energy | 26.71 | 36 | -0.11% | 3.53% |
| KGS | Kodiak Gas | | Energy | 27.10 | 54 | 2.81% | 35.64% |
| DRQ | Dril-Quip | | Energy | 18.54 | 17 | 2.49% | -20.33% |
| PBF | PBF Energy | | Energy | 52.60 | 36 | 0.79% | 19.65% |
| MGY | Magnolia Oil | | Energy | 24.91 | 43 | 1.30% | 17.00% |
| MUR | Murphy Oil | | Energy | 44.22 | 53 | 0.09% | 3.66% |
| CRK | Comstock Resources | | Energy | 9.86 | 63 | 0.92% | 11.41% |
| AESI | Atlas Energy | | Energy | 22.15 | 36 | 0.82% | 29.38% |
| WHD | Cactus | | Energy | 51.30 | 68 | 3.55% | 13.00% |
| GRNT | Granite Ridge | | Energy | 6.34 | 36 | 0.87% | 5.22% |
| DNOW | NOW | | Energy | 14.26 | 35 | 2.66% | 25.97% |
| For chart view version of above stock list: Chart View ➞ 0 - 25 , 25 - 50 , 50 - 75 | ||
 | Click To Change The Sort Order: By Market Cap or Company Size Performance: Year-to-date, Week and Day |  |
| Too many stocks? View smallcap stocks filtered by marketcap & sector |
| Marketcap: All SmallCap Stocks (default-no microcap), Large, Mid-Range, Small |
| Smallcap Sector: Tech, Finance, Energy, Staples, Retail, Industrial, Materials, & Medical |
|
Get the most comprehensive stock market coverage daily at 12Stocks.com ➞ Best Stocks Today ➞ Best Stocks Weekly ➞ Best Stocks Year-to-Date ➞ Best Stocks Trends ➞  Best Stocks Today 12Stocks.com Best Nasdaq Stocks ➞ Best S&P 500 Stocks ➞ Best Tech Stocks ➞ Best Biotech Stocks ➞ |
| Detailed Overview of SmallCap Stocks |
| SmallCap Technical Overview, Leaders & Laggards, Top SmallCap ETF Funds & Detailed SmallCap Stocks List, Charts, Trends & More |
| Smallcap: Technical Analysis, Trends & YTD Performance | |
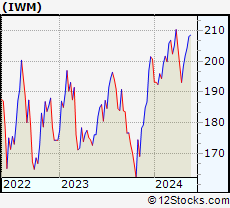
| SmallCap segment as represented by
IWM, an exchange-traded fund [ETF], holds basket of thousands of smallcap stocks from across all major sectors of the US stock market. The smallcap index (contains stocks like Riverbed & Sotheby's) is down by -0.39% and is currently underperforming the overall market by -6.01% year-to-date. Below is a quick view of technical charts and trends: | |
 IWM Weekly Chart |
|
| Long Term Trend: Not Good | |
| Medium Term Trend: Good | |
 IWM Daily Chart |
|
| Short Term Trend: Deteriorating | |
| Overall Trend Score: 49 | |
| YTD Performance: -0.39% | |
| **Trend Scores & Views Are Only For Educational Purposes And Not For Investing | |
| 12Stocks.com: Top Performing Small Cap Index Stocks | ||||||||||||||||||||||||||||||||||||||||||||||||
 The top performing Small Cap Index stocks year to date are
Now, more recently, over last week, the top performing Small Cap Index stocks on the move are


|
||||||||||||||||||||||||||||||||||||||||||||||||
| 12Stocks.com: Investing in Smallcap Index using Exchange Traded Funds | |
|
The following table shows list of key exchange traded funds (ETF) that
help investors track Smallcap index. The following list also includes leveraged ETF funds that track twice or thrice the daily returns of Smallcap indices. Short or inverse ETF funds move in the opposite direction to the index they track and are useful during market pullbacks or during bear markets. Quick View: Move mouse or cursor over ETF symbol (ticker) to view short-term technical chart and over ETF name to view long term chart. Click on ticker or stock name for detailed view. Click on to add stock symbol to your watchlist and to view watchlist. |
12Stocks.com List of ETFs that track Smallcap Index
| Ticker | ETF Name | Watchlist | Recent Price | Smart Investing & Trading Score | Change % | Week % | Year-to-date % |
| IWM | iShares Russell 2000 | | 199.92 | 49 | 1.84 | 0.77 | -0.39% |
| IJR | iShares Core S&P Small-Cap | | 106.33 | 50 | 1.52 | 0.64 | -1.77% |
| VTWO | Vanguard Russell 2000 ETF | | 80.85 | 7 | 1.88 | 0.79 | -0.31% |
| IWN | iShares Russell 2000 Value | | 152.88 | 57 | 2.04 | 1.15 | -1.58% |
| IWO | iShares Russell 2000 Growth | | 254.34 | 17 | 1.91 | 0.49 | 0.84% |
| IJS | iShares S&P Small-Cap 600 Value | | 98.02 | 13 | 1.68 | 0.85 | -4.9% |
| IJT | iShares S&P Small-Cap 600 Growth | | 126.72 | 20 | 1.42 | 0.5 | 1.26% |
| XSLV | PowerShares S&P SmallCap Low Volatil ETF | | 43.14 | 42 | 0.72 | 0.98 | -2.29% |
| SDD | ProShares UltraShort SmallCap600 | | 19.31 | 61 | -2.02 | -0.21 | 4.79% |
| SMLV | SPDR SSGA US Small Cap Low Volatil ETF | | 108.83 | 44 | 1.30 | 1.22 | -3.27% |
| SAA | ProShares Ultra SmallCap600 | | 22.93 | 32 | 1.56 | -0.46 | -8.08% |
| SBB | ProShares Short SmallCap600 | | 16.37 | 71 | -1.14 | -0.09 | 2.76% |
| 12Stocks.com: Charts, Trends, Fundamental Data and Performances of SmallCap Stocks | |
|
We now take in-depth look at all SmallCap stocks including charts, multi-period performances and overall trends (as measured by Smart Investing & Trading Score). One can sort SmallCap stocks (click link to choose) by Daily, Weekly and by Year-to-Date performances. Also, one can sort by size of the company or by market capitalization. |
| Select Your Default Chart Type: | |||||
| |||||
| Click on stock symbol or name for detailed view. Click on to add stock symbol to your watchlist and to view watchlist. Quick View: Move mouse or cursor over "Daily" to quickly view daily technical stock chart and over "Weekly" to view weekly technical stock chart. | |||||

 | CRC California Resources Corporation |
| Sector: Energy | |
| SubSector: Oil & Gas E&P | |
| MarketCap: 18247 Millions | |
| Recent Price: 51.50 Smart Investing & Trading Score: 0 | |
| Day Percent Change: 0.80% Day Change: 0.41 | |
| Week Change: -6.19% Year-to-date Change: -5.8% | |
| CRC Links: Profile News Message Board | |
| Charts:- Daily , Weekly | |
| Add CRC to Watchlist: View: Get Complete CRC Trend Analysis ➞ | |
 | CHRD Chord Energy Corporation |
| Sector: Energy | |
| SubSector: Oil & Gas E&P | |
| MarketCap: 6280 Millions | |
| Recent Price: 176.22 Smart Investing & Trading Score: 46 | |
| Day Percent Change: 1.99% Day Change: 3.44 | |
| Week Change: -5.08% Year-to-date Change: 5.6% | |
| CHRD Links: Profile News Message Board | |
| Charts:- Daily , Weekly | |
| Add CHRD to Watchlist: View: Get Complete CHRD Trend Analysis ➞ | |
 | NE Noble Corporation Plc |
| Sector: Energy | |
| SubSector: Oil & Gas Drilling | |
| MarketCap: 5520 Millions | |
| Recent Price: 44.07 Smart Investing & Trading Score: 36 | |
| Day Percent Change: 0.96% Day Change: 0.42 | |
| Week Change: -4.8% Year-to-date Change: -8.5% | |
| NE Links: Profile News Message Board | |
| Charts:- Daily , Weekly | |
| Add NE to Watchlist: View: Get Complete NE Trend Analysis ➞ | |
 | VAL Valaris Limited |
| Sector: Energy | |
| SubSector: Oil & Gas Equipment & Services | |
| MarketCap: 4520 Millions | |
| Recent Price: 65.05 Smart Investing & Trading Score: 43 | |
| Day Percent Change: 1.55% Day Change: 0.99 | |
| Week Change: -6% Year-to-date Change: -5.1% | |
| VAL Links: Profile News Message Board | |
| Charts:- Daily , Weekly | |
| Add VAL to Watchlist: View: Get Complete VAL Trend Analysis ➞ | |
 | SDRL Seadrill Limited |
| Sector: Energy | |
| SubSector: Oil & Gas Drilling | |
| MarketCap: 3300 Millions | |
| Recent Price: 48.16 Smart Investing & Trading Score: 36 | |
| Day Percent Change: -0.13% Day Change: -0.06 | |
| Week Change: -4.04% Year-to-date Change: 1.6% | |
| SDRL Links: Profile News Message Board | |
| Charts:- Daily , Weekly | |
| Add SDRL to Watchlist: View: Get Complete SDRL Trend Analysis ➞ | |
 | DM Dominion Midstream Partners, LP |
| Sector: Energy | |
| SubSector: Oil & Gas Pipelines | |
| MarketCap: 3017.01 Millions | |
| Recent Price: 0.80 Smart Investing & Trading Score: 25 | |
| Day Percent Change: 1.41% Day Change: 0.01 | |
| Week Change: -3.03% Year-to-date Change: 6.1% | |
| DM Links: Profile News Message Board | |
| Charts:- Daily , Weekly | |
| Add DM to Watchlist: View: Get Complete DM Trend Analysis ➞ | |
 | CVI CVR Energy, Inc. |
| Sector: Energy | |
| SubSector: Oil & Gas Refining & Marketing | |
| MarketCap: 2482.14 Millions | |
| Recent Price: 29.43 Smart Investing & Trading Score: 0 | |
| Day Percent Change: 0.20% Day Change: 0.06 | |
| Week Change: -11.41% Year-to-date Change: -2.9% | |
| CVI Links: Profile News Message Board | |
| Charts:- Daily , Weekly | |
| Add CVI to Watchlist: View: Get Complete CVI Trend Analysis ➞ | |
 | GPOR Gulfport Energy Corporation |
| Sector: Energy | |
| SubSector: Oil & Gas E&P | |
| MarketCap: 1890 Millions | |
| Recent Price: 150.59 Smart Investing & Trading Score: 26 | |
| Day Percent Change: 0.01% Day Change: 0.02 | |
| Week Change: -7.77% Year-to-date Change: 13.1% | |
| GPOR Links: Profile News Message Board | |
| Charts:- Daily , Weekly | |
| Add GPOR to Watchlist: View: Get Complete GPOR Trend Analysis ➞ | |
 | ACDC ProFrac Holding Corp. |
| Sector: Energy | |
| SubSector: Oil & Gas Equipment & Services | |
| MarketCap: 1830 Millions | |
| Recent Price: 6.77 Smart Investing & Trading Score: 10 | |
| Day Percent Change: -0.88% Day Change: -0.06 | |
| Week Change: -17.64% Year-to-date Change: -20.5% | |
| ACDC Links: Profile News Message Board | |
| Charts:- Daily , Weekly | |
| Add ACDC to Watchlist: View: Get Complete ACDC Trend Analysis ➞ | |
 | HP Helmerich & Payne, Inc. |
| Sector: Energy | |
| SubSector: Oil & Gas Drilling & Exploration | |
| MarketCap: 1796.39 Millions | |
| Recent Price: 37.83 Smart Investing & Trading Score: 0 | |
| Day Percent Change: -0.99% Day Change: -0.38 | |
| Week Change: -6.34% Year-to-date Change: 4.5% | |
| HP Links: Profile News Message Board | |
| Charts:- Daily , Weekly | |
| Add HP to Watchlist: View: Get Complete HP Trend Analysis ➞ | |
 | ETRN Equitrans Midstream Corporation |
| Sector: Energy | |
| SubSector: Independent Oil & Gas | |
| MarketCap: 1772.73 Millions | |
| Recent Price: 13.44 Smart Investing & Trading Score: 60 | |
| Day Percent Change: 2.60% Day Change: 0.34 | |
| Week Change: -2.18% Year-to-date Change: 32.0% | |
| ETRN Links: Profile News Message Board | |
| Charts:- Daily , Weekly | |
| Add ETRN to Watchlist: View: Get Complete ETRN Trend Analysis ➞ | |
 | CRGY Crescent Energy Company |
| Sector: Energy | |
| SubSector: Oil & Gas E&P | |
| MarketCap: 1700 Millions | |
| Recent Price: 10.47 Smart Investing & Trading Score: 10 | |
| Day Percent Change: 2.25% Day Change: 0.23 | |
| Week Change: -3.32% Year-to-date Change: -20.6% | |
| CRGY Links: Profile News Message Board | |
| Charts:- Daily , Weekly | |
| Add CRGY to Watchlist: View: Get Complete CRGY Trend Analysis ➞ | |
 | CNX CNX Resources Corporation |
| Sector: Energy | |
| SubSector: Independent Oil & Gas | |
| MarketCap: 1344.33 Millions | |
| Recent Price: 23.20 Smart Investing & Trading Score: 41 | |
| Day Percent Change: 1.18% Day Change: 0.27 | |
| Week Change: -3.33% Year-to-date Change: 16.0% | |
| CNX Links: Profile News Message Board | |
| Charts:- Daily , Weekly | |
| Add CNX to Watchlist: View: Get Complete CNX Trend Analysis ➞ | |
 | DO Diamond Offshore Drilling, Inc. |
| Sector: Energy | |
| SubSector: Oil & Gas Drilling | |
| MarketCap: 1340 Millions | |
| Recent Price: 12.60 Smart Investing & Trading Score: 53 | |
| Day Percent Change: 2.52% Day Change: 0.31 | |
| Week Change: -4.55% Year-to-date Change: -3.6% | |
| DO Links: Profile News Message Board | |
| Charts:- Daily , Weekly | |
| Add DO to Watchlist: View: Get Complete DO Trend Analysis ➞ | |
 | DK Delek US Holdings, Inc. |
| Sector: Energy | |
| SubSector: Oil & Gas Refining & Marketing | |
| MarketCap: 1328.54 Millions | |
| Recent Price: 26.71 Smart Investing & Trading Score: 36 | |
| Day Percent Change: -0.11% Day Change: -0.03 | |
| Week Change: -8.96% Year-to-date Change: 3.5% | |
| DK Links: Profile News Message Board | |
| Charts:- Daily , Weekly | |
| Add DK to Watchlist: View: Get Complete DK Trend Analysis ➞ | |
 | KGS Kodiak Gas Services, LLC |
| Sector: Energy | |
| SubSector: Oil & Gas Equipment & Services | |
| MarketCap: 1220 Millions | |
| Recent Price: 27.10 Smart Investing & Trading Score: 54 | |
| Day Percent Change: 2.81% Day Change: 0.74 | |
| Week Change: -2.83% Year-to-date Change: 35.6% | |
| KGS Links: Profile News Message Board | |
| Charts:- Daily , Weekly | |
| Add KGS to Watchlist: View: Get Complete KGS Trend Analysis ➞ | |
 | DRQ Dril-Quip, Inc. |
| Sector: Energy | |
| SubSector: Oil & Gas Equipment & Services | |
| MarketCap: 1211.61 Millions | |
| Recent Price: 18.54 Smart Investing & Trading Score: 17 | |
| Day Percent Change: 2.49% Day Change: 0.45 | |
| Week Change: -6.88% Year-to-date Change: -20.3% | |
| DRQ Links: Profile News Message Board | |
| Charts:- Daily , Weekly | |
| Add DRQ to Watchlist: View: Get Complete DRQ Trend Analysis ➞ | |
 | PBF PBF Energy Inc |
| Sector: Energy | |
| SubSector: Oil & Gas Refining & Marketing | |
| MarketCap: 1118.54 Millions | |
| Recent Price: 52.60 Smart Investing & Trading Score: 36 | |
| Day Percent Change: 0.79% Day Change: 0.41 | |
| Week Change: -8.97% Year-to-date Change: 19.7% | |
| PBF Links: Profile News Message Board | |
| Charts:- Daily , Weekly | |
| Add PBF to Watchlist: View: Get Complete PBF Trend Analysis ➞ | |
 | MGY Magnolia Oil & Gas Corporation |
| Sector: Energy | |
| SubSector: Independent Oil & Gas | |
| MarketCap: 1088.93 Millions | |
| Recent Price: 24.91 Smart Investing & Trading Score: 43 | |
| Day Percent Change: 1.30% Day Change: 0.32 | |
| Week Change: -5.43% Year-to-date Change: 17.0% | |
| MGY Links: Profile News Message Board | |
| Charts:- Daily , Weekly | |
| Add MGY to Watchlist: View: Get Complete MGY Trend Analysis ➞ | |
 | MUR Murphy Oil Corporation |
| Sector: Energy | |
| SubSector: Independent Oil & Gas | |
| MarketCap: 985.993 Millions | |
| Recent Price: 44.22 Smart Investing & Trading Score: 53 | |
| Day Percent Change: 0.09% Day Change: 0.04 | |
| Week Change: -4.78% Year-to-date Change: 3.7% | |
| MUR Links: Profile News Message Board | |
| Charts:- Daily , Weekly | |
| Add MUR to Watchlist: View: Get Complete MUR Trend Analysis ➞ | |
 | CRK Comstock Resources, Inc. |
| Sector: Energy | |
| SubSector: Independent Oil & Gas | |
| MarketCap: 959.793 Millions | |
| Recent Price: 9.86 Smart Investing & Trading Score: 63 | |
| Day Percent Change: 0.92% Day Change: 0.09 | |
| Week Change: -4.46% Year-to-date Change: 11.4% | |
| CRK Links: Profile News Message Board | |
| Charts:- Daily , Weekly | |
| Add CRK to Watchlist: View: Get Complete CRK Trend Analysis ➞ | |
 | AESI Atlas Energy Solutions Inc. |
| Sector: Energy | |
| SubSector: Oil & Gas Equipment & Services | |
| MarketCap: 947 Millions | |
| Recent Price: 22.15 Smart Investing & Trading Score: 36 | |
| Day Percent Change: 0.82% Day Change: 0.18 | |
| Week Change: -5.46% Year-to-date Change: 29.4% | |
| AESI Links: Profile News Message Board | |
| Charts:- Daily , Weekly | |
| Add AESI to Watchlist: View: Get Complete AESI Trend Analysis ➞ | |
 | WHD Cactus, Inc. |
| Sector: Energy | |
| SubSector: Oil & Gas Equipment & Services | |
| MarketCap: 920.261 Millions | |
| Recent Price: 51.30 Smart Investing & Trading Score: 68 | |
| Day Percent Change: 3.55% Day Change: 1.76 | |
| Week Change: -0.97% Year-to-date Change: 13.0% | |
| WHD Links: Profile News Message Board | |
| Charts:- Daily , Weekly | |
| Add WHD to Watchlist: View: Get Complete WHD Trend Analysis ➞ | |
 | GRNT Granite Ridge Resources, Inc. |
| Sector: Energy | |
| SubSector: Oil & Gas E&P | |
| MarketCap: 890 Millions | |
| Recent Price: 6.34 Smart Investing & Trading Score: 36 | |
| Day Percent Change: 0.87% Day Change: 0.05 | |
| Week Change: -4.3% Year-to-date Change: 5.2% | |
| GRNT Links: Profile News Message Board | |
| Charts:- Daily , Weekly | |
| Add GRNT to Watchlist: View: Get Complete GRNT Trend Analysis ➞ | |
 | DNOW NOW Inc. |
| Sector: Energy | |
| SubSector: Oil & Gas Equipment & Services | |
| MarketCap: 679.661 Millions | |
| Recent Price: 14.26 Smart Investing & Trading Score: 35 | |
| Day Percent Change: 2.66% Day Change: 0.37 | |
| Week Change: -2.53% Year-to-date Change: 26.0% | |
| DNOW Links: Profile News Message Board | |
| Charts:- Daily , Weekly | |
| Add DNOW to Watchlist: View: Get Complete DNOW Trend Analysis ➞ | |
| For tabular summary view of above stock list: Summary View ➞ 0 - 25 , 25 - 50 , 50 - 75 | ||
| Click To Change The Sort Order: By Market Cap or Company Size Performance: Year-to-date, Week and Day | |
| Select Chart Type: | ||
| Too many stocks? View smallcap stocks filtered by marketcap & sector |
| Marketcap: All SmallCap Stocks (default-no microcap), Large, Mid-Range, Small & MicroCap |
| Sector: Tech, Finance, Energy, Staples, Retail, Industrial, Materials, Utilities & Medical |
|
Best Stocks Today 12Stocks.com |
© 2024 12Stocks.com Terms & Conditions Privacy Contact Us
All Information Provided Only For Education And Not To Be Used For Investing or Trading. See Terms & Conditions


One More Thing ... Get Best Stocks Delivered Daily!
Never Ever Miss A Move With Our Top Ten Stocks Lists
Find Best Stocks In Any Market - Bull or Bear Market
Take A Peek At Our Top Ten Stocks Lists: Daily, Weekly, Year-to-Date & Top Trends
Find Best Stocks In Any Market - Bull or Bear Market
Take A Peek At Our Top Ten Stocks Lists: Daily, Weekly, Year-to-Date & Top Trends
Smallcap Stocks With Best Up Trends [0-bearish to 100-bullish]: Emergent BioSolutions[100], Aspen Aerogels[100], Perdoceo Education[100], Gannett Co[100], Pitney Bowes[100], Benchmark Electronics[100], Origin Materials[100], FormFactor [100], Lantheus [100], Q2 [100], Blueprint Medicines[100]
Best Smallcap Stocks Year-to-Date:
Janux [440.16%], Viking [307.09%], Longboard [273.98%], Alpine Immune[239.23%], Bakkt [187.89%], Avidity Biosciences[182.96%], Vera [170.74%], Cullinan Oncology[169.74%], Super Micro[168.25%], Arcutis Bio[166.25%], Y-mAbs [152.93%] Best Smallcap Stocks This Week:
Deciphera [73.24%], Emergent BioSolutions[71.88%], Eyenovia [48.36%], Aspen Aerogels[48.14%], P3 Health[38.51%], Carvana Co[38.18%], Cue Biopharma[37.73%], Origin Materials[36.24%], TransMedics Group[35.14%], Seres [34.55%], Enovix [32.07%] Best Smallcap Stocks Daily:
Emergent BioSolutions[70.98%], Aspen Aerogels[56.70%], Carvana Co[33.77%], Perdoceo Education[31.46%], Enovix [31.06%], Office Properties[28.00%], Gannett Co[26.97%], Sunnova Energy[25.21%], Pitney Bowes[24.70%], Pulmonx [21.37%], CommScope Holding[20.95%]