
 Login Sign Up


| |||||
 |  | ||||

| 12Stocks.com Market Intelligence |
Best SmallCap Stocks
|
| In a hurry? Small Cap Stock Lists: Performance Trends Table, Stock Charts
Sort Small Cap stocks: Daily, Weekly, Year-to-Date, Market Cap & Trends. Filter Small Cap stocks list by sector: Show all, Tech, Finance, Energy, Staples, Retail, Industrial, Materials, Utilities and HealthCare Filter Small Cap stocks list by size: All Large Medium Small and MicroCap |
| 12Stocks.com Small Cap Stocks Performances & Trends Daily | |||||||||
|
|  The overall Smart Investing & Trading Score is 49 (0-bearish to 100-bullish) which puts Small Cap index in short term neutral trend. The Smart Investing & Trading Score from previous trading session is 14 and hence an improvement of trend.
| ||||||||
Here are the Smart Investing & Trading Scores of the most requested small cap stocks at 12Stocks.com (click stock name for detailed review):
|


| 12Stocks.com: Investing in Smallcap Index with Stocks | |
|
The following table helps investors and traders sort through current performance and trends (as measured by Smart Investing & Trading Score) of various
stocks in the Smallcap Index. Quick View: Move mouse or cursor over stock symbol (ticker) to view short-term technical chart and over stock name to view long term chart. Click on  to add stock symbol to your watchlist and to add stock symbol to your watchlist and  to view watchlist. Click on any ticker or stock name for detailed market intelligence report for that stock. to view watchlist. Click on any ticker or stock name for detailed market intelligence report for that stock. |
12Stocks.com Performance of Stocks in Smallcap Index
| Ticker | Stock Name | Watchlist | Category | Recent Price | Smart Investing & Trading Score | Change % | YTD Change% |
| LXFR | Luxfer |   | Industrials | 11.07 | 100 | 4.63% | 23.83% |
| PSN | Parsons | | Industrials | 77.30 | 0 | -0.43% | 23.27% |
| AAON | AAON | | Industrials | 90.89 | 58 | -3.79% | 23.04% |
| DY | Dycom Industries | | Industrials | 140.13 | 53 | 0.45% | 21.76% |
| SPXC | SPX | | Industrials | 121.95 | 66 | 0.12% | 20.73% |
| MLI | Mueller Industries | | Industrials | 56.88 | 63 | 1.41% | 20.64% |
| PCT | PureCycle | | Industrials | 4.88 | 27 | 5.05% | 20.47% |
| WTTR | Select Energy | | Industrials | 9.05 | 31 | -0.77% | 19.24% |
| APOG | Apogee Enterprises | | Industrials | 63.59 | 100 | 1.70% | 19.06% |
| ROAD | Construction Partners | | Industrials | 51.31 | 43 | 0.47% | 17.90% |
| REX | REX American | | Industrials | 55.60 | 41 | 1.22% | 17.55% |
| EPAC | Enerpac Tool | | Industrials | 36.48 | 83 | 2.79% | 17.34% |
| CSWI | CSW Industrials | | Industrials | 241.87 | 90 | 0.53% | 16.61% |
| TH | Target Hospitality | | Industrials | 11.23 | 73 | 1.17% | 15.42% |
| BDC | Belden | | Industrials | 88.91 | 100 | 9.33% | 15.09% |
| GMS | GMS | | Industrials | 94.72 | 65 | 1.61% | 14.91% |
| STRL | Sterling Construction | | Industrials | 100.65 | 7 | 1.50% | 14.47% |
| GFF | Griffon | | Industrials | 68.71 | 47 | 2.28% | 12.73% |
| PACK | Ranpak | | Industrials | 6.56 | 31 | -10.50% | 12.71% |
| LLAP | Terran Orbital | | Industrials | 1.29 | 53 | 0.78% | 12.66% |
| GVA | Granite Construction | | Industrials | 57.26 | 95 | 4.13% | 12.58% |
| MWA | Mueller Water | | Industrials | 16.18 | 88 | 1.70% | 12.36% |
| BECN | Beacon Roofing | | Industrials | 97.52 | 46 | 0.59% | 12.07% |
| AIR | AAR | | Industrials | 69.89 | 90 | 1.32% | 12.00% |
| NX | Quanex Building | | Industrials | 34.22 | 32 | 3.41% | 11.94% |
| For chart view version of above stock list: Chart View ➞ 0 - 25 , 25 - 50 , 50 - 75 , 75 - 100 , 100 - 125 , 125 - 150 , 150 - 175 | ||
 | Click To Change The Sort Order: By Market Cap or Company Size Performance: Year-to-date, Week and Day |  |
| Too many stocks? View smallcap stocks filtered by marketcap & sector |
| Marketcap: All SmallCap Stocks (default-no microcap), Large, Mid-Range, Small |
| Smallcap Sector: Tech, Finance, Energy, Staples, Retail, Industrial, Materials, & Medical |
|
Get the most comprehensive stock market coverage daily at 12Stocks.com ➞ Best Stocks Today ➞ Best Stocks Weekly ➞ Best Stocks Year-to-Date ➞ Best Stocks Trends ➞  Best Stocks Today 12Stocks.com Best Nasdaq Stocks ➞ Best S&P 500 Stocks ➞ Best Tech Stocks ➞ Best Biotech Stocks ➞ |
| Detailed Overview of SmallCap Stocks |
| SmallCap Technical Overview, Leaders & Laggards, Top SmallCap ETF Funds & Detailed SmallCap Stocks List, Charts, Trends & More |
| Smallcap: Technical Analysis, Trends & YTD Performance | |
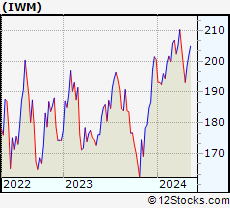
| SmallCap segment as represented by
IWM, an exchange-traded fund [ETF], holds basket of thousands of smallcap stocks from across all major sectors of the US stock market. The smallcap index (contains stocks like Riverbed & Sotheby's) is down by -0.39% and is currently underperforming the overall market by -6.01% year-to-date. Below is a quick view of technical charts and trends: | |
 IWM Weekly Chart |
|
| Long Term Trend: Not Good | |
| Medium Term Trend: Good | |
 IWM Daily Chart |
|
| Short Term Trend: Deteriorating | |
| Overall Trend Score: 49 | |
| YTD Performance: -0.39% | |
| **Trend Scores & Views Are Only For Educational Purposes And Not For Investing | |
| 12Stocks.com: Top Performing Small Cap Index Stocks | ||||||||||||||||||||||||||||||||||||||||||||||||
 The top performing Small Cap Index stocks year to date are
Now, more recently, over last week, the top performing Small Cap Index stocks on the move are


|
||||||||||||||||||||||||||||||||||||||||||||||||
| 12Stocks.com: Investing in Smallcap Index using Exchange Traded Funds | |
|
The following table shows list of key exchange traded funds (ETF) that
help investors track Smallcap index. The following list also includes leveraged ETF funds that track twice or thrice the daily returns of Smallcap indices. Short or inverse ETF funds move in the opposite direction to the index they track and are useful during market pullbacks or during bear markets. Quick View: Move mouse or cursor over ETF symbol (ticker) to view short-term technical chart and over ETF name to view long term chart. Click on ticker or stock name for detailed view. Click on to add stock symbol to your watchlist and to view watchlist. |
12Stocks.com List of ETFs that track Smallcap Index
| Ticker | ETF Name | Watchlist | Recent Price | Smart Investing & Trading Score | Change % | Week % | Year-to-date % |
| IWM | iShares Russell 2000 | | 199.92 | 49 | 1.84 | 0.77 | -0.39% |
| IJR | iShares Core S&P Small-Cap | | 106.33 | 50 | 1.52 | 0.64 | -1.77% |
| VTWO | Vanguard Russell 2000 ETF | | 80.85 | 42 | 1.88 | 0.79 | -0.31% |
| IWN | iShares Russell 2000 Value | | 152.88 | 75 | 2.04 | 1.15 | -1.58% |
| IWO | iShares Russell 2000 Growth | | 254.34 | 32 | 1.91 | 0.49 | 0.84% |
| IJS | iShares S&P Small-Cap 600 Value | | 98.02 | 43 | 1.68 | 0.85 | -4.9% |
| IJT | iShares S&P Small-Cap 600 Growth | | 126.72 | 63 | 1.42 | 0.5 | 1.26% |
| XSLV | PowerShares S&P SmallCap Low Volatil ETF | | 43.14 | 73 | 0.72 | 0.98 | -2.29% |
| SDD | ProShares UltraShort SmallCap600 | | 19.31 | 56 | -2.02 | -0.21 | 4.79% |
| SMLV | SPDR SSGA US Small Cap Low Volatil ETF | | 108.83 | 87 | 1.30 | 1.22 | -3.27% |
| SAA | ProShares Ultra SmallCap600 | | 22.93 | 42 | 1.56 | -0.46 | -8.08% |
| SBB | ProShares Short SmallCap600 | | 16.37 | 49 | -1.14 | -0.09 | 2.76% |
| 12Stocks.com: Charts, Trends, Fundamental Data and Performances of SmallCap Stocks | |
|
We now take in-depth look at all SmallCap stocks including charts, multi-period performances and overall trends (as measured by Smart Investing & Trading Score). One can sort SmallCap stocks (click link to choose) by Daily, Weekly and by Year-to-Date performances. Also, one can sort by size of the company or by market capitalization. |
| Select Your Default Chart Type: | |||||
| |||||
| Click on stock symbol or name for detailed view. Click on to add stock symbol to your watchlist and to view watchlist. Quick View: Move mouse or cursor over "Daily" to quickly view daily technical stock chart and over "Weekly" to view weekly technical stock chart. | |||||

 | LXFR Luxfer Holdings PLC |
| Sector: Industrials | |
| SubSector: Diversified Machinery | |
| MarketCap: 406.716 Millions | |
| Recent Price: 11.07 Smart Investing & Trading Score: 100 | |
| Day Percent Change: 4.63% Day Change: 0.49 | |
| Week Change: 13.77% Year-to-date Change: 23.8% | |
| LXFR Links: Profile News Message Board | |
| Charts:- Daily , Weekly | |
| Add LXFR to Watchlist: View: Get Complete LXFR Trend Analysis ➞ | |
 | PSN Parsons Corporation |
| Sector: Industrials | |
| SubSector: Diversified Machinery | |
| MarketCap: 3021.16 Millions | |
| Recent Price: 77.30 Smart Investing & Trading Score: 0 | |
| Day Percent Change: -0.43% Day Change: -0.33 | |
| Week Change: -3.05% Year-to-date Change: 23.3% | |
| PSN Links: Profile News Message Board | |
| Charts:- Daily , Weekly | |
| Add PSN to Watchlist: View: Get Complete PSN Trend Analysis ➞ | |
 | AAON AAON, Inc. |
| Sector: Industrials | |
| SubSector: General Building Materials | |
| MarketCap: 2533.63 Millions | |
| Recent Price: 90.89 Smart Investing & Trading Score: 58 | |
| Day Percent Change: -3.79% Day Change: -3.58 | |
| Week Change: -0.29% Year-to-date Change: 23.0% | |
| AAON Links: Profile News Message Board | |
| Charts:- Daily , Weekly | |
| Add AAON to Watchlist: View: Get Complete AAON Trend Analysis ➞ | |
 | DY Dycom Industries, Inc. |
| Sector: Industrials | |
| SubSector: Heavy Construction | |
| MarketCap: 576.295 Millions | |
| Recent Price: 140.13 Smart Investing & Trading Score: 53 | |
| Day Percent Change: 0.45% Day Change: 0.63 | |
| Week Change: -1.84% Year-to-date Change: 21.8% | |
| DY Links: Profile News Message Board | |
| Charts:- Daily , Weekly | |
| Add DY to Watchlist: View: Get Complete DY Trend Analysis ➞ | |
 | SPXC SPX Corporation |
| Sector: Industrials | |
| SubSector: Diversified Machinery | |
| MarketCap: 1415.56 Millions | |
| Recent Price: 121.95 Smart Investing & Trading Score: 66 | |
| Day Percent Change: 0.12% Day Change: 0.15 | |
| Week Change: 0.35% Year-to-date Change: 20.7% | |
| SPXC Links: Profile News Message Board | |
| Charts:- Daily , Weekly | |
| Add SPXC to Watchlist: View: Get Complete SPXC Trend Analysis ➞ | |
 | MLI Mueller Industries, Inc. |
| Sector: Industrials | |
| SubSector: Metal Fabrication | |
| MarketCap: 1259.5 Millions | |
| Recent Price: 56.88 Smart Investing & Trading Score: 63 | |
| Day Percent Change: 1.41% Day Change: 0.79 | |
| Week Change: -0.78% Year-to-date Change: 20.6% | |
| MLI Links: Profile News Message Board | |
| Charts:- Daily , Weekly | |
| Add MLI to Watchlist: View: Get Complete MLI Trend Analysis ➞ | |
 | PCT PureCycle Technologies, Inc. |
| Sector: Industrials | |
| SubSector: Pollution & Treatment Controls | |
| MarketCap: 1610 Millions | |
| Recent Price: 4.88 Smart Investing & Trading Score: 27 | |
| Day Percent Change: 5.05% Day Change: 0.23 | |
| Week Change: -1.91% Year-to-date Change: 20.5% | |
| PCT Links: Profile News Message Board | |
| Charts:- Daily , Weekly | |
| Add PCT to Watchlist: View: Get Complete PCT Trend Analysis ➞ | |
 | WTTR Select Energy Services, Inc. |
| Sector: Industrials | |
| SubSector: Pollution & Treatment Controls | |
| MarketCap: 347.075 Millions | |
| Recent Price: 9.05 Smart Investing & Trading Score: 31 | |
| Day Percent Change: -0.77% Day Change: -0.07 | |
| Week Change: -4.54% Year-to-date Change: 19.2% | |
| WTTR Links: Profile News Message Board | |
| Charts:- Daily , Weekly | |
| Add WTTR to Watchlist: View: Get Complete WTTR Trend Analysis ➞ | |
 | APOG Apogee Enterprises, Inc. |
| Sector: Industrials | |
| SubSector: General Building Materials | |
| MarketCap: 510.653 Millions | |
| Recent Price: 63.59 Smart Investing & Trading Score: 100 | |
| Day Percent Change: 1.70% Day Change: 1.06 | |
| Week Change: 2.48% Year-to-date Change: 19.1% | |
| APOG Links: Profile News Message Board | |
| Charts:- Daily , Weekly | |
| Add APOG to Watchlist: View: Get Complete APOG Trend Analysis ➞ | |
 | ROAD Construction Partners, Inc. |
| Sector: Industrials | |
| SubSector: Heavy Construction | |
| MarketCap: 903.095 Millions | |
| Recent Price: 51.31 Smart Investing & Trading Score: 43 | |
| Day Percent Change: 0.47% Day Change: 0.24 | |
| Week Change: -2.77% Year-to-date Change: 17.9% | |
| ROAD Links: Profile News Message Board | |
| Charts:- Daily , Weekly | |
| Add ROAD to Watchlist: View: Get Complete ROAD Trend Analysis ➞ | |
 | REX REX American Resources Corporation |
| Sector: Industrials | |
| SubSector: Conglomerates | |
| MarketCap: 373.748 Millions | |
| Recent Price: 55.60 Smart Investing & Trading Score: 41 | |
| Day Percent Change: 1.22% Day Change: 0.67 | |
| Week Change: -2.52% Year-to-date Change: 17.6% | |
| REX Links: Profile News Message Board | |
| Charts:- Daily , Weekly | |
| Add REX to Watchlist: View: Get Complete REX Trend Analysis ➞ | |
 | EPAC Enerpac Tool Group Corp. |
| Sector: Industrials | |
| SubSector: Diversified Machinery | |
| MarketCap: 1044.16 Millions | |
| Recent Price: 36.48 Smart Investing & Trading Score: 83 | |
| Day Percent Change: 2.79% Day Change: 0.99 | |
| Week Change: 0.94% Year-to-date Change: 17.3% | |
| EPAC Links: Profile News Message Board | |
| Charts:- Daily , Weekly | |
| Add EPAC to Watchlist: View: Get Complete EPAC Trend Analysis ➞ | |
 | CSWI CSW Industrials, Inc. |
| Sector: Industrials | |
| SubSector: Diversified Machinery | |
| MarketCap: 985.616 Millions | |
| Recent Price: 241.87 Smart Investing & Trading Score: 90 | |
| Day Percent Change: 0.53% Day Change: 1.27 | |
| Week Change: 1.2% Year-to-date Change: 16.6% | |
| CSWI Links: Profile News Message Board | |
| Charts:- Daily , Weekly | |
| Add CSWI to Watchlist: View: Get Complete CSWI Trend Analysis ➞ | |
 | TH Target Hospitality Corp. |
| Sector: Industrials | |
| SubSector: Conglomerates | |
| MarketCap: 218.048 Millions | |
| Recent Price: 11.23 Smart Investing & Trading Score: 73 | |
| Day Percent Change: 1.17% Day Change: 0.13 | |
| Week Change: 0.99% Year-to-date Change: 15.4% | |
| TH Links: Profile News Message Board | |
| Charts:- Daily , Weekly | |
| Add TH to Watchlist: View: Get Complete TH Trend Analysis ➞ | |
 | BDC Belden Inc. |
| Sector: Industrials | |
| SubSector: Industrial Electrical Equipment | |
| MarketCap: 1490.59 Millions | |
| Recent Price: 88.91 Smart Investing & Trading Score: 100 | |
| Day Percent Change: 9.33% Day Change: 7.59 | |
| Week Change: 6.61% Year-to-date Change: 15.1% | |
| BDC Links: Profile News Message Board | |
| Charts:- Daily , Weekly | |
| Add BDC to Watchlist: View: Get Complete BDC Trend Analysis ➞ | |
 | GMS GMS Inc. |
| Sector: Industrials | |
| SubSector: General Building Materials | |
| MarketCap: 587.753 Millions | |
| Recent Price: 94.72 Smart Investing & Trading Score: 65 | |
| Day Percent Change: 1.61% Day Change: 1.50 | |
| Week Change: 1.97% Year-to-date Change: 14.9% | |
| GMS Links: Profile News Message Board | |
| Charts:- Daily , Weekly | |
| Add GMS to Watchlist: View: Get Complete GMS Trend Analysis ➞ | |
 | STRL Sterling Construction Company, Inc. |
| Sector: Industrials | |
| SubSector: Heavy Construction | |
| MarketCap: 237.395 Millions | |
| Recent Price: 100.65 Smart Investing & Trading Score: 7 | |
| Day Percent Change: 1.50% Day Change: 1.49 | |
| Week Change: -4.95% Year-to-date Change: 14.5% | |
| STRL Links: Profile News Message Board | |
| Charts:- Daily , Weekly | |
| Add STRL to Watchlist: View: Get Complete STRL Trend Analysis ➞ | |
 | GFF Griffon Corporation |
| Sector: Industrials | |
| SubSector: General Building Materials | |
| MarketCap: 616 Millions | |
| Recent Price: 68.71 Smart Investing & Trading Score: 47 | |
| Day Percent Change: 2.28% Day Change: 1.53 | |
| Week Change: 0.64% Year-to-date Change: 12.7% | |
| GFF Links: Profile News Message Board | |
| Charts:- Daily , Weekly | |
| Add GFF to Watchlist: View: Get Complete GFF Trend Analysis ➞ | |
 | PACK Ranpak Holdings Corp. |
| Sector: Industrials | |
| SubSector: Conglomerates | |
| MarketCap: 492.648 Millions | |
| Recent Price: 6.56 Smart Investing & Trading Score: 31 | |
| Day Percent Change: -10.50% Day Change: -0.77 | |
| Week Change: -11.71% Year-to-date Change: 12.7% | |
| PACK Links: Profile News Message Board | |
| Charts:- Daily , Weekly | |
| Add PACK to Watchlist: View: Get Complete PACK Trend Analysis ➞ | |
 | LLAP Terran Orbital Corporation |
| Sector: Industrials | |
| SubSector: Aerospace & Defense | |
| MarketCap: 206 Millions | |
| Recent Price: 1.29 Smart Investing & Trading Score: 53 | |
| Day Percent Change: 0.78% Day Change: 0.01 | |
| Week Change: -3.73% Year-to-date Change: 12.7% | |
| LLAP Links: Profile News Message Board | |
| Charts:- Daily , Weekly | |
| Add LLAP to Watchlist: View: Get Complete LLAP Trend Analysis ➞ | |
 | GVA Granite Construction Incorporated |
| Sector: Industrials | |
| SubSector: Heavy Construction | |
| MarketCap: 725.895 Millions | |
| Recent Price: 57.26 Smart Investing & Trading Score: 95 | |
| Day Percent Change: 4.13% Day Change: 2.27 | |
| Week Change: 3.12% Year-to-date Change: 12.6% | |
| GVA Links: Profile News Message Board | |
| Charts:- Daily , Weekly | |
| Add GVA to Watchlist: View: Get Complete GVA Trend Analysis ➞ | |
 | MWA Mueller Water Products, Inc. |
| Sector: Industrials | |
| SubSector: Industrial Equipment & Components | |
| MarketCap: 1321.09 Millions | |
| Recent Price: 16.18 Smart Investing & Trading Score: 88 | |
| Day Percent Change: 1.70% Day Change: 0.27 | |
| Week Change: 1.25% Year-to-date Change: 12.4% | |
| MWA Links: Profile News Message Board | |
| Charts:- Daily , Weekly | |
| Add MWA to Watchlist: View: Get Complete MWA Trend Analysis ➞ | |
 | BECN Beacon Roofing Supply, Inc. |
| Sector: Industrials | |
| SubSector: General Building Materials | |
| MarketCap: 1210.13 Millions | |
| Recent Price: 97.52 Smart Investing & Trading Score: 46 | |
| Day Percent Change: 0.59% Day Change: 0.57 | |
| Week Change: -1.49% Year-to-date Change: 12.1% | |
| BECN Links: Profile News Message Board | |
| Charts:- Daily , Weekly | |
| Add BECN to Watchlist: View: Get Complete BECN Trend Analysis ➞ | |
 | AIR AAR Corp. |
| Sector: Industrials | |
| SubSector: Aerospace/Defense Products & Services | |
| MarketCap: 591.701 Millions | |
| Recent Price: 69.89 Smart Investing & Trading Score: 90 | |
| Day Percent Change: 1.32% Day Change: 0.91 | |
| Week Change: 2.37% Year-to-date Change: 12.0% | |
| AIR Links: Profile News Message Board | |
| Charts:- Daily , Weekly | |
| Add AIR to Watchlist: View: Get Complete AIR Trend Analysis ➞ | |
 | NX Quanex Building Products Corporation |
| Sector: Industrials | |
| SubSector: General Building Materials | |
| MarketCap: 315.453 Millions | |
| Recent Price: 34.22 Smart Investing & Trading Score: 32 | |
| Day Percent Change: 3.41% Day Change: 1.13 | |
| Week Change: 1.21% Year-to-date Change: 11.9% | |
| NX Links: Profile News Message Board | |
| Charts:- Daily , Weekly | |
| Add NX to Watchlist: View: Get Complete NX Trend Analysis ➞ | |
| For tabular summary view of above stock list: Summary View ➞ 0 - 25 , 25 - 50 , 50 - 75 , 75 - 100 , 100 - 125 , 125 - 150 , 150 - 175 | ||
| Click To Change The Sort Order: By Market Cap or Company Size Performance: Year-to-date, Week and Day | |
| Select Chart Type: | ||
| Too many stocks? View smallcap stocks filtered by marketcap & sector |
| Marketcap: All SmallCap Stocks (default-no microcap), Large, Mid-Range, Small & MicroCap |
| Sector: Tech, Finance, Energy, Staples, Retail, Industrial, Materials, Utilities & Medical |
|
Best Stocks Today 12Stocks.com |
© 2024 12Stocks.com Terms & Conditions Privacy Contact Us
All Information Provided Only For Education And Not To Be Used For Investing or Trading. See Terms & Conditions


One More Thing ... Get Best Stocks Delivered Daily!
Never Ever Miss A Move With Our Top Ten Stocks Lists
Find Best Stocks In Any Market - Bull or Bear Market
Take A Peek At Our Top Ten Stocks Lists: Daily, Weekly, Year-to-Date & Top Trends
Find Best Stocks In Any Market - Bull or Bear Market
Take A Peek At Our Top Ten Stocks Lists: Daily, Weekly, Year-to-Date & Top Trends
Smallcap Stocks With Best Up Trends [0-bearish to 100-bullish]: Emergent BioSolutions[100], Aspen Aerogels[100], Carvana Co[100], Perdoceo Education[100], Gannett Co[100], Pitney Bowes[100], Benchmark Electronics[100], Origin Materials[100], FormFactor [100], Lantheus [100], Q2 [100]
Best Smallcap Stocks Year-to-Date:
Janux [440.16%], Viking [307.09%], Longboard [273.98%], Alpine Immune[239.29%], Bakkt [187.89%], Avidity Biosciences[182.96%], Vera [170.74%], Cullinan Oncology[169.74%], Super Micro[168.25%], Arcutis Bio[166.25%], Y-mAbs [152.93%] Best Smallcap Stocks This Week:
Deciphera [73.24%], Emergent BioSolutions[71.88%], Eyenovia [49.22%], Aspen Aerogels[48.14%], P3 Health[38.51%], Carvana Co[38.18%], Cue Biopharma[37.73%], Origin Materials[36.24%], TransMedics Group[35.14%], Seres [34.55%], Enovix [32.07%] Best Smallcap Stocks Daily:
Emergent BioSolutions[70.98%], Aspen Aerogels[56.70%], Carvana Co[33.77%], Perdoceo Education[31.46%], Enovix [31.06%], Office Properties[28.00%], Gannett Co[26.97%], Sunnova Energy[25.21%], Pitney Bowes[24.70%], Pulmonx [21.50%], CommScope Holding[20.95%]