
 Login Sign Up


| |||||
 |  | ||||

| 12Stocks.com Market Intelligence |
Best SmallCap Stocks
|
| In a hurry? Small Cap Stock Lists: Performance Trends Table, Stock Charts
Sort Small Cap stocks: Daily, Weekly, Year-to-Date, Market Cap & Trends. Filter Small Cap stocks list by sector: Show all, Tech, Finance, Energy, Staples, Retail, Industrial, Materials, Utilities and HealthCare Filter Small Cap stocks list by size: All Large Medium Small and MicroCap |
| 12Stocks.com Small Cap Stocks Performances & Trends Daily | |||||||||
|
|  The overall Smart Investing & Trading Score is 14 (0-bearish to 100-bullish) which puts Small Cap index in short term bearish trend. The Smart Investing & Trading Score from previous trading session is 41 and hence a deterioration of trend.
| ||||||||
Here are the Smart Investing & Trading Scores of the most requested small cap stocks at 12Stocks.com (click stock name for detailed review):
|


| 12Stocks.com: Investing in Smallcap Index with Stocks | |
|
The following table helps investors and traders sort through current performance and trends (as measured by Smart Investing & Trading Score) of various
stocks in the Smallcap Index. Quick View: Move mouse or cursor over stock symbol (ticker) to view short-term technical chart and over stock name to view long term chart. Click on  to add stock symbol to your watchlist and to add stock symbol to your watchlist and  to view watchlist. Click on any ticker or stock name for detailed market intelligence report for that stock. to view watchlist. Click on any ticker or stock name for detailed market intelligence report for that stock. |
12Stocks.com Performance of Stocks in Smallcap Index
| Ticker | Stock Name | Watchlist | Category | Recent Price | Smart Investing & Trading Score | Change % | YTD Change% |
| VMEO | Vimeo |   | Technology | 3.63 | 25 | 0.97 | -7.39% |
| LAW | CS Disco | | Technology | 7.62 | 41 | 0.93 | -0.26% |
| HCKT | Hackett Group | | Technology | 21.89 | 18 | 0.92 | -3.86% |
| OSPN | OneSpan | | Technology | 10.92 | 100 | 0.92 | 1.87% |
| STNE | StoneCo | | Technology | 15.74 | 22 | 0.90 | -12.70% |
| PRST | Presto Automation | | Technology | 0.17 | 20 | 0.89 | -67.83% |
| QLYS | Qualys | | Technology | 165.29 | 25 | 0.84 | -15.79% |
| SATS | EchoStar | | Technology | 16.12 | 83 | 0.81 | -2.72% |
| VRNT | Verint Systems | | Technology | 30.52 | 30 | 0.79 | 12.91% |
| SHEN | Shenandoah Tele | | Technology | 12.92 | 20 | 0.78 | -40.24% |
| PKE | Park Aerospace | | Technology | 14.38 | 10 | 0.77 | -2.18% |
| JAMF | Jamf Holding | | Technology | 19.62 | 76 | 0.77 | 8.58% |
| FARO | FARO | | Technology | 18.89 | 47 | 0.75 | -16.16% |
| ACIW | ACI Worldwide | | Technology | 34.35 | 95 | 0.73 | 12.25% |
| PGNY | Progyny | | Technology | 32.29 | 28 | 0.72 | -13.15% |
| ESE | ESCO | | Technology | 102.17 | 28 | 0.71 | -12.70% |
| QTWO | Q2 | | Technology | 51.73 | 46 | 0.66 | 19.17% |
| CRCT | Cricut | | Technology | 5.36 | 83 | 0.66 | -19.70% |
| RBBN | Ribbon | | Technology | 3.19 | 78 | 0.63 | 10.00% |
| TGAN | Transphorm | | Technology | 4.83 | 43 | 0.63 | 31.79% |
| KVHI | KVH Industries | | Technology | 4.89 | 68 | 0.62 | -7.03% |
| ALRM | Alarm.com | | Technology | 66.90 | 39 | 0.60 | 3.53% |
| WIRE | Encore Wire | | Technology | 281.00 | 51 | 0.59 | 31.55% |
| MLNK | MeridianLink | | Technology | 16.92 | 17 | 0.59 | -31.69% |
| PRGS | Progress | | Technology | 50.11 | 25 | 0.58 | -7.72% |
| For chart view version of above stock list: Chart View ➞ 0 - 25 , 25 - 50 , 50 - 75 , 75 - 100 , 100 - 125 , 125 - 150 , 150 - 175 , 175 - 200 , 200 - 225 , 225 - 250 , 250 - 275 | ||
 | Click To Change The Sort Order: By Market Cap or Company Size Performance: Year-to-date, Week and Day |  |
| Too many stocks? View smallcap stocks filtered by marketcap & sector |
| Marketcap: All SmallCap Stocks (default-no microcap), Large, Mid-Range, Small |
| Smallcap Sector: Tech, Finance, Energy, Staples, Retail, Industrial, Materials, & Medical |
|
Get the most comprehensive stock market coverage daily at 12Stocks.com ➞ Best Stocks Today ➞ Best Stocks Weekly ➞ Best Stocks Year-to-Date ➞ Best Stocks Trends ➞  Best Stocks Today 12Stocks.com Best Nasdaq Stocks ➞ Best S&P 500 Stocks ➞ Best Tech Stocks ➞ Best Biotech Stocks ➞ |
| Detailed Overview of SmallCap Stocks |
| SmallCap Technical Overview, Leaders & Laggards, Top SmallCap ETF Funds & Detailed SmallCap Stocks List, Charts, Trends & More |
| Smallcap: Technical Analysis, Trends & YTD Performance | |
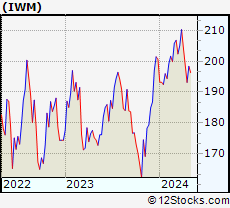
| SmallCap segment as represented by
IWM, an exchange-traded fund [ETF], holds basket of thousands of smallcap stocks from across all major sectors of the US stock market. The smallcap index (contains stocks like Riverbed & Sotheby's) is down by -2.19% and is currently underperforming the overall market by -6.73% year-to-date. Below is a quick view of technical charts and trends: | |
 IWM Weekly Chart |
|
| Long Term Trend: Not Good | |
| Medium Term Trend: Not Good | |
 IWM Daily Chart |
|
| Short Term Trend: Not Good | |
| Overall Trend Score: 14 | |
| YTD Performance: -2.19% | |
| **Trend Scores & Views Are Only For Educational Purposes And Not For Investing | |
| 12Stocks.com: Top Performing Small Cap Index Stocks | ||||||||||||||||||||||||||||||||||||||||||||||||
 The top performing Small Cap Index stocks year to date are
Now, more recently, over last week, the top performing Small Cap Index stocks on the move are


|
||||||||||||||||||||||||||||||||||||||||||||||||
| 12Stocks.com: Investing in Smallcap Index using Exchange Traded Funds | |
|
The following table shows list of key exchange traded funds (ETF) that
help investors track Smallcap index. The following list also includes leveraged ETF funds that track twice or thrice the daily returns of Smallcap indices. Short or inverse ETF funds move in the opposite direction to the index they track and are useful during market pullbacks or during bear markets. Quick View: Move mouse or cursor over ETF symbol (ticker) to view short-term technical chart and over ETF name to view long term chart. Click on ticker or stock name for detailed view. Click on to add stock symbol to your watchlist and to view watchlist. |
12Stocks.com List of ETFs that track Smallcap Index
| Ticker | ETF Name | Watchlist | Recent Price | Smart Investing & Trading Score | Change % | Week % | Year-to-date % |
| IWM | iShares Russell 2000 | | 196.31 | 14 | 0.21 | -1.05 | -2.19% |
| IJR | iShares Core S&P Small-Cap | | 104.74 | 22 | 0.34 | -0.86 | -3.24% |
| VTWO | Vanguard Russell 2000 ETF | | 79.36 | 14 | 0.25 | -1.07 | -2.15% |
| IWN | iShares Russell 2000 Value | | 149.82 | 22 | 0.52 | -0.87 | -3.55% |
| IJS | iShares S&P Small-Cap 600 Value | | 96.40 | 15 | 0.33 | -0.81 | -6.47% |
| IWO | iShares Russell 2000 Growth | | 249.58 | 7 | -0.30 | -1.39 | -1.05% |
| IJT | iShares S&P Small-Cap 600 Growth | | 124.94 | 15 | 0.27 | -0.91 | -0.16% |
| XSLV | PowerShares S&P SmallCap Low Volatil ETF | | 42.94 | 52 | 0.93 | 0.5 | -2.75% |
| SDD | ProShares UltraShort SmallCap600 | | 19.50 | 78 | -0.36 | 0.78 | 5.83% |
| SMLV | SPDR SSGA US Small Cap Low Volatil ETF | | 107.81 | 40 | 1.45 | 0.27 | -4.19% |
| SBB | ProShares Short SmallCap600 | | 16.50 | 71 | -0.30 | 0.7 | 3.58% |
| SAA | ProShares Ultra SmallCap600 | | 22.53 | 8 | -0.31 | -2.21 | -9.7% |
| 12Stocks.com: Charts, Trends, Fundamental Data and Performances of SmallCap Stocks | |
|
We now take in-depth look at all SmallCap stocks including charts, multi-period performances and overall trends (as measured by Smart Investing & Trading Score). One can sort SmallCap stocks (click link to choose) by Daily, Weekly and by Year-to-Date performances. Also, one can sort by size of the company or by market capitalization. |
| Select Your Default Chart Type: | |||||
| |||||
| Click on stock symbol or name for detailed view. Click on to add stock symbol to your watchlist and to view watchlist. Quick View: Move mouse or cursor over "Daily" to quickly view daily technical stock chart and over "Weekly" to view weekly technical stock chart. | |||||

 | VMEO Vimeo, Inc. |
| Sector: Technology | |
| SubSector: Software - Application | |
| MarketCap: 678 Millions | |
| Recent Price: 3.63 Smart Investing & Trading Score: 25 | |
| Day Percent Change: 0.97% Day Change: 0.03 | |
| Week Change: -1.49% Year-to-date Change: -7.4% | |
| VMEO Links: Profile News Message Board | |
| Charts:- Daily , Weekly | |
| Add VMEO to Watchlist: View: Get Complete VMEO Trend Analysis ➞ | |
 | LAW CS Disco, Inc. |
| Sector: Technology | |
| SubSector: Software - Application | |
| MarketCap: 505 Millions | |
| Recent Price: 7.62 Smart Investing & Trading Score: 41 | |
| Day Percent Change: 0.93% Day Change: 0.07 | |
| Week Change: -2.81% Year-to-date Change: -0.3% | |
| LAW Links: Profile News Message Board | |
| Charts:- Daily , Weekly | |
| Add LAW to Watchlist: View: Get Complete LAW Trend Analysis ➞ | |
 | HCKT The Hackett Group, Inc. |
| Sector: Technology | |
| SubSector: Information Technology Services | |
| MarketCap: 334.468 Millions | |
| Recent Price: 21.89 Smart Investing & Trading Score: 18 | |
| Day Percent Change: 0.92% Day Change: 0.20 | |
| Week Change: -0.27% Year-to-date Change: -3.9% | |
| HCKT Links: Profile News Message Board | |
| Charts:- Daily , Weekly | |
| Add HCKT to Watchlist: View: Get Complete HCKT Trend Analysis ➞ | |
 | OSPN OneSpan Inc. |
| Sector: Technology | |
| SubSector: Application Software | |
| MarketCap: 657.762 Millions | |
| Recent Price: 10.92 Smart Investing & Trading Score: 100 | |
| Day Percent Change: 0.92% Day Change: 0.10 | |
| Week Change: 1.2% Year-to-date Change: 1.9% | |
| OSPN Links: Profile News Message Board | |
| Charts:- Daily , Weekly | |
| Add OSPN to Watchlist: View: Get Complete OSPN Trend Analysis ➞ | |
 | STNE StoneCo Ltd. |
| Sector: Technology | |
| SubSector: Application Software | |
| MarketCap: 7347.82 Millions | |
| Recent Price: 15.74 Smart Investing & Trading Score: 22 | |
| Day Percent Change: 0.90% Day Change: 0.14 | |
| Week Change: -3.73% Year-to-date Change: -12.7% | |
| STNE Links: Profile News Message Board | |
| Charts:- Daily , Weekly | |
| Add STNE to Watchlist: View: Get Complete STNE Trend Analysis ➞ | |
 | PRST Presto Automation Inc. |
| Sector: Technology | |
| SubSector: Software - Application | |
| MarketCap: 238 Millions | |
| Recent Price: 0.17 Smart Investing & Trading Score: 20 | |
| Day Percent Change: 0.89% Day Change: 0.00 | |
| Week Change: 0.65% Year-to-date Change: -67.8% | |
| PRST Links: Profile News Message Board | |
| Charts:- Daily , Weekly | |
| Add PRST to Watchlist: View: Get Complete PRST Trend Analysis ➞ | |
 | QLYS Qualys, Inc. |
| Sector: Technology | |
| SubSector: Application Software | |
| MarketCap: 3475.02 Millions | |
| Recent Price: 165.29 Smart Investing & Trading Score: 25 | |
| Day Percent Change: 0.84% Day Change: 1.38 | |
| Week Change: -2.98% Year-to-date Change: -15.8% | |
| QLYS Links: Profile News Message Board | |
| Charts:- Daily , Weekly | |
| Add QLYS to Watchlist: View: Get Complete QLYS Trend Analysis ➞ | |
 | SATS EchoStar Corporation |
| Sector: Technology | |
| SubSector: Communication Equipment | |
| MarketCap: 3175.69 Millions | |
| Recent Price: 16.12 Smart Investing & Trading Score: 83 | |
| Day Percent Change: 0.81% Day Change: 0.13 | |
| Week Change: 0.75% Year-to-date Change: -2.7% | |
| SATS Links: Profile News Message Board | |
| Charts:- Daily , Weekly | |
| Add SATS to Watchlist: View: Get Complete SATS Trend Analysis ➞ | |
 | VRNT Verint Systems Inc. |
| Sector: Technology | |
| SubSector: Business Software & Services | |
| MarketCap: 2902.18 Millions | |
| Recent Price: 30.52 Smart Investing & Trading Score: 30 | |
| Day Percent Change: 0.79% Day Change: 0.24 | |
| Week Change: -1.33% Year-to-date Change: 12.9% | |
| VRNT Links: Profile News Message Board | |
| Charts:- Daily , Weekly | |
| Add VRNT to Watchlist: View: Get Complete VRNT Trend Analysis ➞ | |
 | SHEN Shenandoah Telecommunications Company |
| Sector: Technology | |
| SubSector: Telecom Services - Domestic | |
| MarketCap: 2329.67 Millions | |
| Recent Price: 12.92 Smart Investing & Trading Score: 20 | |
| Day Percent Change: 0.78% Day Change: 0.10 | |
| Week Change: -3.51% Year-to-date Change: -40.2% | |
| SHEN Links: Profile News Message Board | |
| Charts:- Daily , Weekly | |
| Add SHEN to Watchlist: View: Get Complete SHEN Trend Analysis ➞ | |
 | PKE Park Aerospace Corp. |
| Sector: Technology | |
| SubSector: Semiconductor Equipment & Materials | |
| MarketCap: 229.018 Millions | |
| Recent Price: 14.38 Smart Investing & Trading Score: 10 | |
| Day Percent Change: 0.77% Day Change: 0.11 | |
| Week Change: -2.57% Year-to-date Change: -2.2% | |
| PKE Links: Profile News Message Board | |
| Charts:- Daily , Weekly | |
| Add PKE to Watchlist: View: Get Complete PKE Trend Analysis ➞ | |
 | JAMF Jamf Holding Corp. |
| Sector: Technology | |
| SubSector: Software Application | |
| MarketCap: 36987 Millions | |
| Recent Price: 19.62 Smart Investing & Trading Score: 76 | |
| Day Percent Change: 0.77% Day Change: 0.15 | |
| Week Change: 0.36% Year-to-date Change: 8.6% | |
| JAMF Links: Profile News Message Board | |
| Charts:- Daily , Weekly | |
| Add JAMF to Watchlist: View: Get Complete JAMF Trend Analysis ➞ | |
 | FARO FARO Technologies, Inc. |
| Sector: Technology | |
| SubSector: Scientific & Technical Instruments | |
| MarketCap: 721.953 Millions | |
| Recent Price: 18.89 Smart Investing & Trading Score: 47 | |
| Day Percent Change: 0.75% Day Change: 0.14 | |
| Week Change: -0.16% Year-to-date Change: -16.2% | |
| FARO Links: Profile News Message Board | |
| Charts:- Daily , Weekly | |
| Add FARO to Watchlist: View: Get Complete FARO Trend Analysis ➞ | |
 | ACIW ACI Worldwide, Inc. |
| Sector: Technology | |
| SubSector: Technical & System Software | |
| MarketCap: 2645.7 Millions | |
| Recent Price: 34.35 Smart Investing & Trading Score: 95 | |
| Day Percent Change: 0.73% Day Change: 0.25 | |
| Week Change: 3.15% Year-to-date Change: 12.3% | |
| ACIW Links: Profile News Message Board | |
| Charts:- Daily , Weekly | |
| Add ACIW to Watchlist: View: Get Complete ACIW Trend Analysis ➞ | |
 | PGNY Progyny, Inc. |
| Sector: Technology | |
| SubSector: Healthcare Information Services | |
| MarketCap: 1839.05 Millions | |
| Recent Price: 32.29 Smart Investing & Trading Score: 28 | |
| Day Percent Change: 0.72% Day Change: 0.23 | |
| Week Change: 0.78% Year-to-date Change: -13.2% | |
| PGNY Links: Profile News Message Board | |
| Charts:- Daily , Weekly | |
| Add PGNY to Watchlist: View: Get Complete PGNY Trend Analysis ➞ | |
 | ESE ESCO Technologies Inc. |
| Sector: Technology | |
| SubSector: Scientific & Technical Instruments | |
| MarketCap: 1968.03 Millions | |
| Recent Price: 102.17 Smart Investing & Trading Score: 28 | |
| Day Percent Change: 0.71% Day Change: 0.72 | |
| Week Change: -3.01% Year-to-date Change: -12.7% | |
| ESE Links: Profile News Message Board | |
| Charts:- Daily , Weekly | |
| Add ESE to Watchlist: View: Get Complete ESE Trend Analysis ➞ | |
 | QTWO Q2 Holdings, Inc. |
| Sector: Technology | |
| SubSector: Business Software & Services | |
| MarketCap: 2815.88 Millions | |
| Recent Price: 51.73 Smart Investing & Trading Score: 46 | |
| Day Percent Change: 0.66% Day Change: 0.34 | |
| Week Change: -2.91% Year-to-date Change: 19.2% | |
| QTWO Links: Profile News Message Board | |
| Charts:- Daily , Weekly | |
| Add QTWO to Watchlist: View: Get Complete QTWO Trend Analysis ➞ | |
 | CRCT Cricut, Inc. |
| Sector: Technology | |
| SubSector: Computer Hardware | |
| MarketCap: 2920 Millions | |
| Recent Price: 5.36 Smart Investing & Trading Score: 83 | |
| Day Percent Change: 0.66% Day Change: 0.04 | |
| Week Change: -0.56% Year-to-date Change: -19.7% | |
| CRCT Links: Profile News Message Board | |
| Charts:- Daily , Weekly | |
| Add CRCT to Watchlist: View: Get Complete CRCT Trend Analysis ➞ | |
 | RBBN Ribbon Communications Inc. |
| Sector: Technology | |
| SubSector: Telecom Services - Domestic | |
| MarketCap: 284.577 Millions | |
| Recent Price: 3.19 Smart Investing & Trading Score: 78 | |
| Day Percent Change: 0.63% Day Change: 0.02 | |
| Week Change: 1.92% Year-to-date Change: 10.0% | |
| RBBN Links: Profile News Message Board | |
| Charts:- Daily , Weekly | |
| Add RBBN to Watchlist: View: Get Complete RBBN Trend Analysis ➞ | |
 | TGAN Transphorm, Inc. |
| Sector: Technology | |
| SubSector: Semiconductor Equipment & Materials | |
| MarketCap: 194 Millions | |
| Recent Price: 4.83 Smart Investing & Trading Score: 43 | |
| Day Percent Change: 0.63% Day Change: 0.03 | |
| Week Change: -0.62% Year-to-date Change: 31.8% | |
| TGAN Links: Profile News Message Board | |
| Charts:- Daily , Weekly | |
| Add TGAN to Watchlist: View: Get Complete TGAN Trend Analysis ➞ | |
 | KVHI KVH Industries, Inc. |
| Sector: Technology | |
| SubSector: Communication Equipment | |
| MarketCap: 169.939 Millions | |
| Recent Price: 4.89 Smart Investing & Trading Score: 68 | |
| Day Percent Change: 0.62% Day Change: 0.03 | |
| Week Change: 2.3% Year-to-date Change: -7.0% | |
| KVHI Links: Profile News Message Board | |
| Charts:- Daily , Weekly | |
| Add KVHI to Watchlist: View: Get Complete KVHI Trend Analysis ➞ | |
 | ALRM Alarm.com Holdings, Inc. |
| Sector: Technology | |
| SubSector: Application Software | |
| MarketCap: 2035.62 Millions | |
| Recent Price: 66.90 Smart Investing & Trading Score: 39 | |
| Day Percent Change: 0.60% Day Change: 0.40 | |
| Week Change: 1.41% Year-to-date Change: 3.5% | |
| ALRM Links: Profile News Message Board | |
| Charts:- Daily , Weekly | |
| Add ALRM to Watchlist: View: Get Complete ALRM Trend Analysis ➞ | |
 | WIRE Encore Wire Corporation |
| Sector: Technology | |
| SubSector: Diversified Electronics | |
| MarketCap: 898.896 Millions | |
| Recent Price: 281.00 Smart Investing & Trading Score: 51 | |
| Day Percent Change: 0.59% Day Change: 1.64 | |
| Week Change: -1.37% Year-to-date Change: 31.6% | |
| WIRE Links: Profile News Message Board | |
| Charts:- Daily , Weekly | |
| Add WIRE to Watchlist: View: Get Complete WIRE Trend Analysis ➞ | |
 | MLNK MeridianLink, Inc. |
| Sector: Technology | |
| SubSector: Software - Application | |
| MarketCap: 1630 Millions | |
| Recent Price: 16.92 Smart Investing & Trading Score: 17 | |
| Day Percent Change: 0.59% Day Change: 0.10 | |
| Week Change: -3.31% Year-to-date Change: -31.7% | |
| MLNK Links: Profile News Message Board | |
| Charts:- Daily , Weekly | |
| Add MLNK to Watchlist: View: Get Complete MLNK Trend Analysis ➞ | |
 | PRGS Progress Software Corporation |
| Sector: Technology | |
| SubSector: Application Software | |
| MarketCap: 1407.22 Millions | |
| Recent Price: 50.11 Smart Investing & Trading Score: 25 | |
| Day Percent Change: 0.58% Day Change: 0.29 | |
| Week Change: -0.46% Year-to-date Change: -7.7% | |
| PRGS Links: Profile News Message Board | |
| Charts:- Daily , Weekly | |
| Add PRGS to Watchlist: View: Get Complete PRGS Trend Analysis ➞ | |
| For tabular summary view of above stock list: Summary View ➞ 0 - 25 , 25 - 50 , 50 - 75 , 75 - 100 , 100 - 125 , 125 - 150 , 150 - 175 , 175 - 200 , 200 - 225 , 225 - 250 , 250 - 275 | ||
| Click To Change The Sort Order: By Market Cap or Company Size Performance: Year-to-date, Week and Day | |
| Select Chart Type: | ||
| Too many stocks? View smallcap stocks filtered by marketcap & sector |
| Marketcap: All SmallCap Stocks (default-no microcap), Large, Mid-Range, Small & MicroCap |
| Sector: Tech, Finance, Energy, Staples, Retail, Industrial, Materials, Utilities & Medical |
|
Best Stocks Today 12Stocks.com |
© 2024 12Stocks.com Terms & Conditions Privacy Contact Us
All Information Provided Only For Education And Not To Be Used For Investing or Trading. See Terms & Conditions


One More Thing ... Get Best Stocks Delivered Daily!
Never Ever Miss A Move With Our Top Ten Stocks Lists
Find Best Stocks In Any Market - Bull or Bear Market
Take A Peek At Our Top Ten Stocks Lists: Daily, Weekly, Year-to-Date & Top Trends
Find Best Stocks In Any Market - Bull or Bear Market
Take A Peek At Our Top Ten Stocks Lists: Daily, Weekly, Year-to-Date & Top Trends
Smallcap Stocks With Best Up Trends [0-bearish to 100-bullish]: Surmodics [100], Rocky Brands[100], TransMedics Group[100], LendingClub [100], Summit [100], A10 s[100], Carpenter [100], UFP [100], PROCEPT BioRobotics[100], Xencor [100], Trinity Industries[100]
Best Smallcap Stocks Year-to-Date:
Janux [441.55%], Viking [310.69%], Longboard [259.25%], Alpine Immune[239.26%], Avidity Biosciences[185.4%], Bakkt [182.96%], Cullinan Oncology[175.33%], Arcutis Bio[173.68%], Vera [173.32%], Super Micro[159.73%], Y-mAbs [141.79%] Best Smallcap Stocks This Week:
Deciphera [73.11%], Eyenovia [44.86%], Cue Biopharma[39.56%], Seres [30.91%], Poseida [30.52%], P3 Health[29.62%], Phibro Animal[28.44%], TransMedics Group[27.72%], Surmodics [27.36%], LendingTree [26.36%], Rocky Brands[24.92%] Best Smallcap Stocks Daily:
Surmodics [29.74%], Rocky Brands[28.41%], TransMedics Group[24.93%], Ventyx Biosciences[24.63%], Eyenovia [21.17%], LendingClub [19.68%], Summit [19.59%], Powell Industries[18.89%], MiMedx Group[18.67%], CareDx [18.30%], A10 s[17.69%]