
 Login Sign Up


| |||||
 |  | ||||

| 12Stocks.com Market Intelligence |
Best SmallCap Stocks
|
| In a hurry? Small Cap Stock Lists: Performance Trends Table, Stock Charts
Sort Small Cap stocks: Daily, Weekly, Year-to-Date, Market Cap & Trends. Filter Small Cap stocks list by sector: Show all, Tech, Finance, Energy, Staples, Retail, Industrial, Materials, Utilities and HealthCare Filter Small Cap stocks list by size: All Large Medium Small and MicroCap |
| 12Stocks.com Small Cap Stocks Performances & Trends Daily | |||||||||
|
|  The overall Smart Investing & Trading Score is 82 (0-bearish to 100-bullish) which puts Small Cap index in short term bullish trend. The Smart Investing & Trading Score from previous trading session is 69 and hence an improvement of trend.
| ||||||||
Here are the Smart Investing & Trading Scores of the most requested small cap stocks at 12Stocks.com (click stock name for detailed review):
|


| 12Stocks.com: Investing in Smallcap Index with Stocks | |
|
The following table helps investors and traders sort through current performance and trends (as measured by Smart Investing & Trading Score) of various
stocks in the Smallcap Index. Quick View: Move mouse or cursor over stock symbol (ticker) to view short-term technical chart and over stock name to view long term chart. Click on  to add stock symbol to your watchlist and to add stock symbol to your watchlist and  to view watchlist. Click on any ticker or stock name for detailed market intelligence report for that stock. to view watchlist. Click on any ticker or stock name for detailed market intelligence report for that stock. |
12Stocks.com Performance of Stocks in Smallcap Index
| Ticker | Stock Name | Watchlist | Category | Recent Price | Smart Investing & Trading Score | Change % | YTD Change% |
| JOBY | Joby Aviation |   | Industrials | 5.53 | 64 | 2.79 | -16.72% |
| FSS | Federal Signal | | Industrials | 84.20 | 83 | 2.70 | 9.72% |
| WTS | Watts Water | | Industrials | 210.19 | 90 | 2.69 | 0.89% |
| SPXC | SPX | | Industrials | 134.27 | 100 | 2.54 | 32.93% |
| TMHC | Taylor Morrison | | Industrials | 58.62 | 90 | 2.48 | 9.88% |
| ATRO | Astronics | | Industrials | 18.82 | 69 | 2.45 | 8.04% |
| HI | Hillenbrand | | Industrials | 43.48 | 32 | 2.45 | -9.13% |
| BCC | Boise Cascade | | Industrials | 139.37 | 83 | 2.44 | 7.74% |
| TPC | Tutor Perini | | Industrials | 18.42 | 100 | 2.39 | 102.42% |
| AIN | Albany | | Industrials | 86.64 | 52 | 2.33 | -11.79% |
| BZH | Beazer Homes | | Industrials | 28.34 | 49 | 2.31 | -16.13% |
| TEX | Terex | | Industrials | 59.70 | 58 | 2.31 | 3.90% |
| CDRE | Cadre | | Industrials | 34.59 | 64 | 2.22 | 4.91% |
| IBP | Installed Building | | Industrials | 249.06 | 85 | 2.20 | 36.23% |
| SUM | Summit Materials | | Industrials | 40.31 | 47 | 2.15 | 4.81% |
| MLI | Mueller Industries | | Industrials | 58.00 | 85 | 2.09 | 23.01% |
| CSWI | CSW Industrials | | Industrials | 247.91 | 95 | 2.09 | 19.53% |
| EVLV | Evolv | | Industrials | 3.96 | 46 | 2.06 | -16.10% |
| EPAC | Enerpac Tool | | Industrials | 37.57 | 100 | 2.01 | 20.84% |
| B | Barnes Group | | Industrials | 37.26 | 100 | 1.97 | 14.19% |
| ACA | Arcosa | | Industrials | 87.01 | 100 | 1.97 | 5.29% |
| MWA | Mueller Water | | Industrials | 16.55 | 100 | 1.97 | 14.93% |
| GTLS | Chart Industries | | Industrials | 158.00 | 95 | 1.94 | 15.90% |
| CODI | Compass Diversified | | Industrials | 22.09 | 17 | 1.89 | -1.60% |
| ENS | EnerSys | | Industrials | 95.00 | 100 | 1.84 | -5.90% |
| For chart view version of above stock list: Chart View ➞ 0 - 25 , 25 - 50 , 50 - 75 , 75 - 100 , 100 - 125 , 125 - 150 , 150 - 175 | ||
 | Click To Change The Sort Order: By Market Cap or Company Size Performance: Year-to-date, Week and Day |  |
| Too many stocks? View smallcap stocks filtered by marketcap & sector |
| Marketcap: All SmallCap Stocks (default-no microcap), Large, Mid-Range, Small |
| Smallcap Sector: Tech, Finance, Energy, Staples, Retail, Industrial, Materials, & Medical |
|
Get the most comprehensive stock market coverage daily at 12Stocks.com ➞ Best Stocks Today ➞ Best Stocks Weekly ➞ Best Stocks Year-to-Date ➞ Best Stocks Trends ➞  Best Stocks Today 12Stocks.com Best Nasdaq Stocks ➞ Best S&P 500 Stocks ➞ Best Tech Stocks ➞ Best Biotech Stocks ➞ |
| Detailed Overview of SmallCap Stocks |
| SmallCap Technical Overview, Leaders & Laggards, Top SmallCap ETF Funds & Detailed SmallCap Stocks List, Charts, Trends & More |
| Smallcap: Technical Analysis, Trends & YTD Performance | |
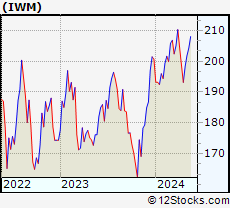
| SmallCap segment as represented by
IWM, an exchange-traded fund [ETF], holds basket of thousands of smallcap stocks from across all major sectors of the US stock market. The smallcap index (contains stocks like Riverbed & Sotheby's) is up by 1.89% and is currently underperforming the overall market by -6.13% year-to-date. Below is a quick view of technical charts and trends: | |
 IWM Weekly Chart |
|
| Long Term Trend: Very Good | |
| Medium Term Trend: Very Good | |
 IWM Daily Chart |
|
| Short Term Trend: Very Good | |
| Overall Trend Score: 82 | |
| YTD Performance: 1.89% | |
| **Trend Scores & Views Are Only For Educational Purposes And Not For Investing | |
| 12Stocks.com: Top Performing Small Cap Index Stocks | ||||||||||||||||||||||||||||||||||||||||||||||||
 The top performing Small Cap Index stocks year to date are
Now, more recently, over last week, the top performing Small Cap Index stocks on the move are


|
||||||||||||||||||||||||||||||||||||||||||||||||
| 12Stocks.com: Investing in Smallcap Index using Exchange Traded Funds | |
|
The following table shows list of key exchange traded funds (ETF) that
help investors track Smallcap index. The following list also includes leveraged ETF funds that track twice or thrice the daily returns of Smallcap indices. Short or inverse ETF funds move in the opposite direction to the index they track and are useful during market pullbacks or during bear markets. Quick View: Move mouse or cursor over ETF symbol (ticker) to view short-term technical chart and over ETF name to view long term chart. Click on ticker or stock name for detailed view. Click on to add stock symbol to your watchlist and to view watchlist. |
12Stocks.com List of ETFs that track Smallcap Index
| Ticker | ETF Name | Watchlist | Recent Price | Smart Investing & Trading Score | Change % | Week % | Year-to-date % |
| IWM | iShares Russell 2000 | | 204.51 | 82 | 1.29 | 1.29 | 1.89% |
| IJR | iShares Core S&P Small-Cap | | 108.26 | 47 | 1.05 | 1.05 | 0.01% |
| VTWO | Vanguard Russell 2000 ETF | | 82.59 | 82 | 1.20 | 1.2 | 1.84% |
| IWN | iShares Russell 2000 Value | | 155.65 | 65 | 0.93 | 0.93 | 0.21% |
| IWO | iShares Russell 2000 Growth | | 261.01 | 29 | 1.61 | 1.61 | 3.49% |
| IJS | iShares S&P Small-Cap 600 Value | | 99.75 | 69 | 1.04 | 1.04 | -3.22% |
| IJT | iShares S&P Small-Cap 600 Growth | | 129.04 | 95 | 1.00 | 1 | 3.12% |
| XSLV | PowerShares S&P SmallCap Low Volatil ETF | | 43.52 | 87 | 0.69 | 0.69 | -1.43% |
| SAA | ProShares Ultra SmallCap600 | | 24.10 | 82 | 2.16 | 2.16 | -3.41% |
| SDD | ProShares UltraShort SmallCap600 | | 18.42 | 10 | -2.26 | -2.26 | -0.04% |
| SBB | ProShares Short SmallCap600 | | 16.05 | 13 | -0.67 | -0.67 | 0.76% |
| SMLV | SPDR SSGA US Small Cap Low Volatil ETF | | 110.59 | 87 | 0.83 | 0.83 | -1.72% |
| 12Stocks.com: Charts, Trends, Fundamental Data and Performances of SmallCap Stocks | |
|
We now take in-depth look at all SmallCap stocks including charts, multi-period performances and overall trends (as measured by Smart Investing & Trading Score). One can sort SmallCap stocks (click link to choose) by Daily, Weekly and by Year-to-Date performances. Also, one can sort by size of the company or by market capitalization. |
| Select Your Default Chart Type: | |||||
| |||||
| Click on stock symbol or name for detailed view. Click on to add stock symbol to your watchlist and to view watchlist. Quick View: Move mouse or cursor over "Daily" to quickly view daily technical stock chart and over "Weekly" to view weekly technical stock chart. | |||||

 | JOBY Joby Aviation, Inc. |
| Sector: Industrials | |
| SubSector: Airports & Air Services | |
| MarketCap: 5810 Millions | |
| Recent Price: 5.53 Smart Investing & Trading Score: 64 | |
| Day Percent Change: 2.79% Day Change: 0.15 | |
| Week Change: 2.79% Year-to-date Change: -16.7% | |
| JOBY Links: Profile News Message Board | |
| Charts:- Daily , Weekly | |
| Add JOBY to Watchlist: View: Get Complete JOBY Trend Analysis ➞ | |
 | FSS Federal Signal Corporation |
| Sector: Industrials | |
| SubSector: Pollution & Treatment Controls | |
| MarketCap: 1694.05 Millions | |
| Recent Price: 84.20 Smart Investing & Trading Score: 83 | |
| Day Percent Change: 2.70% Day Change: 2.21 | |
| Week Change: 2.7% Year-to-date Change: 9.7% | |
| FSS Links: Profile News Message Board | |
| Charts:- Daily , Weekly | |
| Add FSS to Watchlist: View: Get Complete FSS Trend Analysis ➞ | |
 | WTS Watts Water Technologies, Inc. |
| Sector: Industrials | |
| SubSector: Industrial Equipment & Components | |
| MarketCap: 2903.29 Millions | |
| Recent Price: 210.19 Smart Investing & Trading Score: 90 | |
| Day Percent Change: 2.69% Day Change: 5.50 | |
| Week Change: 2.69% Year-to-date Change: 0.9% | |
| WTS Links: Profile News Message Board | |
| Charts:- Daily , Weekly | |
| Add WTS to Watchlist: View: Get Complete WTS Trend Analysis ➞ | |
 | SPXC SPX Corporation |
| Sector: Industrials | |
| SubSector: Diversified Machinery | |
| MarketCap: 1415.56 Millions | |
| Recent Price: 134.27 Smart Investing & Trading Score: 100 | |
| Day Percent Change: 2.54% Day Change: 3.33 | |
| Week Change: 2.54% Year-to-date Change: 32.9% | |
| SPXC Links: Profile News Message Board | |
| Charts:- Daily , Weekly | |
| Add SPXC to Watchlist: View: Get Complete SPXC Trend Analysis ➞ | |
 | TMHC Taylor Morrison Home Corporation |
| Sector: Industrials | |
| SubSector: Residential Construction | |
| MarketCap: 1336.76 Millions | |
| Recent Price: 58.62 Smart Investing & Trading Score: 90 | |
| Day Percent Change: 2.48% Day Change: 1.42 | |
| Week Change: 2.48% Year-to-date Change: 9.9% | |
| TMHC Links: Profile News Message Board | |
| Charts:- Daily , Weekly | |
| Add TMHC to Watchlist: View: Get Complete TMHC Trend Analysis ➞ | |
 | ATRO Astronics Corporation |
| Sector: Industrials | |
| SubSector: Aerospace/Defense Products & Services | |
| MarketCap: 287.201 Millions | |
| Recent Price: 18.82 Smart Investing & Trading Score: 69 | |
| Day Percent Change: 2.45% Day Change: 0.45 | |
| Week Change: 2.45% Year-to-date Change: 8.0% | |
| ATRO Links: Profile News Message Board | |
| Charts:- Daily , Weekly | |
| Add ATRO to Watchlist: View: Get Complete ATRO Trend Analysis ➞ | |
 | HI Hillenbrand, Inc. |
| Sector: Industrials | |
| SubSector: Diversified Machinery | |
| MarketCap: 1389.86 Millions | |
| Recent Price: 43.48 Smart Investing & Trading Score: 32 | |
| Day Percent Change: 2.45% Day Change: 1.04 | |
| Week Change: 2.45% Year-to-date Change: -9.1% | |
| HI Links: Profile News Message Board | |
| Charts:- Daily , Weekly | |
| Add HI to Watchlist: View: Get Complete HI Trend Analysis ➞ | |
 | BCC Boise Cascade Company |
| Sector: Industrials | |
| SubSector: Lumber, Wood Production | |
| MarketCap: 963.938 Millions | |
| Recent Price: 139.37 Smart Investing & Trading Score: 83 | |
| Day Percent Change: 2.44% Day Change: 3.32 | |
| Week Change: 2.44% Year-to-date Change: 7.7% | |
| BCC Links: Profile News Message Board | |
| Charts:- Daily , Weekly | |
| Add BCC to Watchlist: View: Get Complete BCC Trend Analysis ➞ | |
 | TPC Tutor Perini Corporation |
| Sector: Industrials | |
| SubSector: Heavy Construction | |
| MarketCap: 382.595 Millions | |
| Recent Price: 18.42 Smart Investing & Trading Score: 100 | |
| Day Percent Change: 2.39% Day Change: 0.43 | |
| Week Change: 2.39% Year-to-date Change: 102.4% | |
| TPC Links: Profile News Message Board | |
| Charts:- Daily , Weekly | |
| Add TPC to Watchlist: View: Get Complete TPC Trend Analysis ➞ | |
 | AIN Albany International Corp. |
| Sector: Industrials | |
| SubSector: Textile Industrial | |
| MarketCap: 1538.4 Millions | |
| Recent Price: 86.64 Smart Investing & Trading Score: 52 | |
| Day Percent Change: 2.33% Day Change: 1.97 | |
| Week Change: 2.33% Year-to-date Change: -11.8% | |
| AIN Links: Profile News Message Board | |
| Charts:- Daily , Weekly | |
| Add AIN to Watchlist: View: Get Complete AIN Trend Analysis ➞ | |
 | BZH Beazer Homes USA, Inc. |
| Sector: Industrials | |
| SubSector: Residential Construction | |
| MarketCap: 180.106 Millions | |
| Recent Price: 28.34 Smart Investing & Trading Score: 49 | |
| Day Percent Change: 2.31% Day Change: 0.64 | |
| Week Change: 2.31% Year-to-date Change: -16.1% | |
| BZH Links: Profile News Message Board | |
| Charts:- Daily , Weekly | |
| Add BZH to Watchlist: View: Get Complete BZH Trend Analysis ➞ | |
 | TEX Terex Corporation |
| Sector: Industrials | |
| SubSector: Farm & Construction Machinery | |
| MarketCap: 1083.07 Millions | |
| Recent Price: 59.70 Smart Investing & Trading Score: 58 | |
| Day Percent Change: 2.31% Day Change: 1.35 | |
| Week Change: 2.31% Year-to-date Change: 3.9% | |
| TEX Links: Profile News Message Board | |
| Charts:- Daily , Weekly | |
| Add TEX to Watchlist: View: Get Complete TEX Trend Analysis ➞ | |
 | CDRE Cadre Holdings, Inc. |
| Sector: Industrials | |
| SubSector: Aerospace & Defense | |
| MarketCap: 817 Millions | |
| Recent Price: 34.59 Smart Investing & Trading Score: 64 | |
| Day Percent Change: 2.22% Day Change: 0.75 | |
| Week Change: 2.22% Year-to-date Change: 4.9% | |
| CDRE Links: Profile News Message Board | |
| Charts:- Daily , Weekly | |
| Add CDRE to Watchlist: View: Get Complete CDRE Trend Analysis ➞ | |
 | IBP Installed Building Products, Inc. |
| Sector: Industrials | |
| SubSector: General Building Materials | |
| MarketCap: 1284.23 Millions | |
| Recent Price: 249.06 Smart Investing & Trading Score: 85 | |
| Day Percent Change: 2.20% Day Change: 5.36 | |
| Week Change: 2.2% Year-to-date Change: 36.2% | |
| IBP Links: Profile News Message Board | |
| Charts:- Daily , Weekly | |
| Add IBP to Watchlist: View: Get Complete IBP Trend Analysis ➞ | |
 | SUM Summit Materials, Inc. |
| Sector: Industrials | |
| SubSector: General Building Materials | |
| MarketCap: 1138.23 Millions | |
| Recent Price: 40.31 Smart Investing & Trading Score: 47 | |
| Day Percent Change: 2.15% Day Change: 0.85 | |
| Week Change: 2.15% Year-to-date Change: 4.8% | |
| SUM Links: Profile News Message Board | |
| Charts:- Daily , Weekly | |
| Add SUM to Watchlist: View: Get Complete SUM Trend Analysis ➞ | |
 | MLI Mueller Industries, Inc. |
| Sector: Industrials | |
| SubSector: Metal Fabrication | |
| MarketCap: 1259.5 Millions | |
| Recent Price: 58.00 Smart Investing & Trading Score: 85 | |
| Day Percent Change: 2.09% Day Change: 1.19 | |
| Week Change: 2.09% Year-to-date Change: 23.0% | |
| MLI Links: Profile News Message Board | |
| Charts:- Daily , Weekly | |
| Add MLI to Watchlist: View: Get Complete MLI Trend Analysis ➞ | |
 | CSWI CSW Industrials, Inc. |
| Sector: Industrials | |
| SubSector: Diversified Machinery | |
| MarketCap: 985.616 Millions | |
| Recent Price: 247.91 Smart Investing & Trading Score: 95 | |
| Day Percent Change: 2.09% Day Change: 5.07 | |
| Week Change: 2.09% Year-to-date Change: 19.5% | |
| CSWI Links: Profile News Message Board | |
| Charts:- Daily , Weekly | |
| Add CSWI to Watchlist: View: Get Complete CSWI Trend Analysis ➞ | |
 | EVLV Evolv Technologies Holdings, Inc. |
| Sector: Industrials | |
| SubSector: Security & Protection Services | |
| MarketCap: 853 Millions | |
| Recent Price: 3.96 Smart Investing & Trading Score: 46 | |
| Day Percent Change: 2.06% Day Change: 0.08 | |
| Week Change: 2.06% Year-to-date Change: -16.1% | |
| EVLV Links: Profile News Message Board | |
| Charts:- Daily , Weekly | |
| Add EVLV to Watchlist: View: Get Complete EVLV Trend Analysis ➞ | |
 | EPAC Enerpac Tool Group Corp. |
| Sector: Industrials | |
| SubSector: Diversified Machinery | |
| MarketCap: 1044.16 Millions | |
| Recent Price: 37.57 Smart Investing & Trading Score: 100 | |
| Day Percent Change: 2.01% Day Change: 0.74 | |
| Week Change: 2.01% Year-to-date Change: 20.8% | |
| EPAC Links: Profile News Message Board | |
| Charts:- Daily , Weekly | |
| Add EPAC to Watchlist: View: Get Complete EPAC Trend Analysis ➞ | |
 | B Barnes Group Inc. |
| Sector: Industrials | |
| SubSector: Industrial Equipment & Components | |
| MarketCap: 2189.79 Millions | |
| Recent Price: 37.26 Smart Investing & Trading Score: 100 | |
| Day Percent Change: 1.97% Day Change: 0.72 | |
| Week Change: 1.97% Year-to-date Change: 14.2% | |
| B Links: Profile News Message Board | |
| Charts:- Daily , Weekly | |
| Add B to Watchlist: View: Get Complete B Trend Analysis ➞ | |
 | ACA Arcosa, Inc. |
| Sector: Industrials | |
| SubSector: Farm & Construction Machinery | |
| MarketCap: 1692.57 Millions | |
| Recent Price: 87.01 Smart Investing & Trading Score: 100 | |
| Day Percent Change: 1.97% Day Change: 1.68 | |
| Week Change: 1.97% Year-to-date Change: 5.3% | |
| ACA Links: Profile News Message Board | |
| Charts:- Daily , Weekly | |
| Add ACA to Watchlist: View: Get Complete ACA Trend Analysis ➞ | |
 | MWA Mueller Water Products, Inc. |
| Sector: Industrials | |
| SubSector: Industrial Equipment & Components | |
| MarketCap: 1321.09 Millions | |
| Recent Price: 16.55 Smart Investing & Trading Score: 100 | |
| Day Percent Change: 1.97% Day Change: 0.32 | |
| Week Change: 1.97% Year-to-date Change: 14.9% | |
| MWA Links: Profile News Message Board | |
| Charts:- Daily , Weekly | |
| Add MWA to Watchlist: View: Get Complete MWA Trend Analysis ➞ | |
 | GTLS Chart Industries, Inc. |
| Sector: Industrials | |
| SubSector: Metal Fabrication | |
| MarketCap: 751.15 Millions | |
| Recent Price: 158.00 Smart Investing & Trading Score: 95 | |
| Day Percent Change: 1.94% Day Change: 3.00 | |
| Week Change: 1.94% Year-to-date Change: 15.9% | |
| GTLS Links: Profile News Message Board | |
| Charts:- Daily , Weekly | |
| Add GTLS to Watchlist: View: Get Complete GTLS Trend Analysis ➞ | |
 | CODI Compass Diversified Holdings LLC |
| Sector: Industrials | |
| SubSector: Conglomerates | |
| MarketCap: 803.348 Millions | |
| Recent Price: 22.09 Smart Investing & Trading Score: 17 | |
| Day Percent Change: 1.89% Day Change: 0.41 | |
| Week Change: 1.89% Year-to-date Change: -1.6% | |
| CODI Links: Profile News Message Board | |
| Charts:- Daily , Weekly | |
| Add CODI to Watchlist: View: Get Complete CODI Trend Analysis ➞ | |
 | ENS EnerSys |
| Sector: Industrials | |
| SubSector: Industrial Electrical Equipment | |
| MarketCap: 2068.79 Millions | |
| Recent Price: 95.00 Smart Investing & Trading Score: 100 | |
| Day Percent Change: 1.84% Day Change: 1.72 | |
| Week Change: 1.84% Year-to-date Change: -5.9% | |
| ENS Links: Profile News Message Board | |
| Charts:- Daily , Weekly | |
| Add ENS to Watchlist: View: Get Complete ENS Trend Analysis ➞ | |
| For tabular summary view of above stock list: Summary View ➞ 0 - 25 , 25 - 50 , 50 - 75 , 75 - 100 , 100 - 125 , 125 - 150 , 150 - 175 | ||
| Click To Change The Sort Order: By Market Cap or Company Size Performance: Year-to-date, Week and Day | |
| Select Chart Type: | ||
| Too many stocks? View smallcap stocks filtered by marketcap & sector |
| Marketcap: All SmallCap Stocks (default-no microcap), Large, Mid-Range, Small & MicroCap |
| Sector: Tech, Finance, Energy, Staples, Retail, Industrial, Materials, Utilities & Medical |
|
Best Stocks Today 12Stocks.com |
© 2024 12Stocks.com Terms & Conditions Privacy Contact Us
All Information Provided Only For Education And Not To Be Used For Investing or Trading. See Terms & Conditions


One More Thing ... Get Best Stocks Delivered Daily!
Never Ever Miss A Move With Our Top Ten Stocks Lists
Find Best Stocks In Any Market - Bull or Bear Market
Take A Peek At Our Top Ten Stocks Lists: Daily, Weekly, Year-to-Date & Top Trends
Find Best Stocks In Any Market - Bull or Bear Market
Take A Peek At Our Top Ten Stocks Lists: Daily, Weekly, Year-to-Date & Top Trends
Smallcap Stocks With Best Up Trends [0-bearish to 100-bullish]: Perficient [100], Outset Medical[100], Dakota Gold[100], PMV [100], Twist Bioscience[100], SilverBow Resources[100], Regional Management[100], TPI Composites[100], AeroVironment [100], Solid Power[100], Wolverine World[100]
Best Smallcap Stocks Year-to-Date:
CareMax [511.34%], Janux [479.25%], Viking [320.15%], Alpine Immune[239.29%], Longboard [237.32%], Bakkt [197.53%], Vera [194.15%], Super Micro[192.28%], Avidity Biosciences[189.6%], Cullinan Oncology[178.76%], Y-mAbs [153.23%] Best Smallcap Stocks This Week:
Perficient [52.24%], P3 Health[25.16%], Outset Medical[23%], Lineage Cell[22.64%], SoundHound AI[19.54%], DASAN Zhone[19.25%], Workhorse Group[19.13%], BioCryst [18.65%], Marathon Patent[18.09%], Aceto [17.24%], Assertio [16.99%] Best Smallcap Stocks Daily:
Perficient [52.24%], P3 Health[25.16%], Outset Medical[23.00%], Lineage Cell[22.64%], SoundHound AI[19.54%], DASAN Zhone[19.25%], Workhorse Group[19.13%], BioCryst [18.65%], Marathon Patent[18.09%], Aceto [17.24%], Assertio [16.99%]