
 Login Sign Up


| |||||
 |  | ||||

| 12Stocks.com Market Intelligence |
Best SmallCap Stocks
|
| In a hurry? Small Cap Stock Lists: Performance Trends Table, Stock Charts
Sort Small Cap stocks: Daily, Weekly, Year-to-Date, Market Cap & Trends. Filter Small Cap stocks list by sector: Show all, Tech, Finance, Energy, Staples, Retail, Industrial, Materials, Utilities and HealthCare Filter Small Cap stocks list by size: All Large Medium Small and MicroCap |
| 12Stocks.com Small Cap Stocks Performances & Trends Daily | |||||||||
|
|  The overall Smart Investing & Trading Score is 88 (0-bearish to 100-bullish) which puts Small Cap index in short term bullish trend. The Smart Investing & Trading Score from previous trading session is 56 and hence an improvement of trend.
| ||||||||
Here are the Smart Investing & Trading Scores of the most requested small cap stocks at 12Stocks.com (click stock name for detailed review):
|


| 12Stocks.com: Investing in Smallcap Index with Stocks | |
|
The following table helps investors and traders sort through current performance and trends (as measured by Smart Investing & Trading Score) of various
stocks in the Smallcap Index. Quick View: Move mouse or cursor over stock symbol (ticker) to view short-term technical chart and over stock name to view long term chart. Click on  to add stock symbol to your watchlist and to add stock symbol to your watchlist and  to view watchlist. Click on any ticker or stock name for detailed market intelligence report for that stock. to view watchlist. Click on any ticker or stock name for detailed market intelligence report for that stock. |
12Stocks.com Performance of Stocks in Smallcap Index
| Ticker | Stock Name | Watchlist | Category | Recent Price | Smart Investing & Trading Score | Change % | YTD Change% |
| SCPH | sc |   | Health Care | 4.59 | 52 | 2.23% | -26.79% |
| XAIR | Beyond Air | | Health Care | 1.15 | 27 | -1.29% | -41.33% |
| PLSE | Pulse Biosciences | | Health Care | 7.24 | 64 | 0.70% | -40.85% |
| OVID | Ovid | | Health Care | 3.31 | 24 | 6.61% | 2.64% |
| FENC | Fennec | | Health Care | 9.15 | 32 | -0.65% | -18.45% |
| JYNT | Joint | | Health Care | 12.31 | 83 | 0.65% | 28.10% |
| EYPT | EyePoint | | Health Care | 17.74 | 42 | 5.91% | -23.24% |
| ABUS | Arbutus Biopharma | | Health Care | 2.78 | 75 | 1.83% | 11.20% |
| HROW | Harrow Health | | Health Care | 10.60 | 68 | 0.66% | -5.36% |
| CRMD | CorMedix | | Health Care | 5.28 | 36 | -0.56% | 40.43% |
| IDYA | IDEAYA Biosciences | | Health Care | 40.70 | 49 | 1.90% | 14.39% |
| SAVA | Cassava Sciences | | Health Care | 22.27 | 52 | -0.31% | -1.07% |
| TELA | TELA Bio | | Health Care | 4.52 | 35 | 1.57% | -31.72% |
| LQDA | Liquidia | | Health Care | 12.48 | 17 | -0.40% | 3.74% |
| SVRA | Savara | | Health Care | 4.60 | 32 | 4.31% | -2.13% |
| XERS | Xeris | | Health Care | 1.75 | 27 | 0.29% | -25.48% |
| CELC | Celcuity | | Health Care | 16.00 | 53 | 0.53% | 9.17% |
| ASRT | Assertio | | Health Care | 0.84 | 34 | 1.79% | -21.94% |
| HBIO | Harvard Bioscience | | Health Care | 3.68 | 35 | 1.66% | -31.21% |
| ALDX | Aldeyra | | Health Care | 4.06 | 75 | 3.31% | 15.67% |
| CLPT | ClearPoint Neuro | | Health Care | 5.35 | 25 | 1.71% | -21.50% |
| EYEN | Eyenovia | | Health Care | 0.71 | 64 | 13.66% | -65.84% |
| TRVI | Trevi | | Health Care | 2.94 | 75 | 5.76% | 119.40% |
| For chart view version of above stock list: Chart View ➞ 0 - 25 , 25 - 50 , 50 - 75 , 75 - 100 , 100 - 125 , 125 - 150 , 150 - 175 , 175 - 200 , 200 - 225 , 225 - 250 , 250 - 275 , 275 - 300 , 300 - 325 , 325 - 350 | ||
 | Click To Change The Sort Order: By Market Cap or Company Size Performance: Year-to-date, Week and Day |  |
| Too many stocks? View smallcap stocks filtered by marketcap & sector |
| Marketcap: All SmallCap Stocks (default-no microcap), Large, Mid-Range, Small |
| Smallcap Sector: Tech, Finance, Energy, Staples, Retail, Industrial, Materials, & Medical |
|
Get the most comprehensive stock market coverage daily at 12Stocks.com ➞ Best Stocks Today ➞ Best Stocks Weekly ➞ Best Stocks Year-to-Date ➞ Best Stocks Trends ➞  Best Stocks Today 12Stocks.com Best Nasdaq Stocks ➞ Best S&P 500 Stocks ➞ Best Tech Stocks ➞ Best Biotech Stocks ➞ |
| Detailed Overview of SmallCap Stocks |
| SmallCap Technical Overview, Leaders & Laggards, Top SmallCap ETF Funds & Detailed SmallCap Stocks List, Charts, Trends & More |
| Smallcap: Technical Analysis, Trends & YTD Performance | |
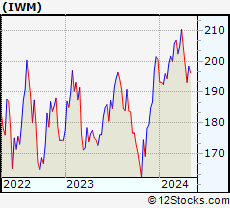
| SmallCap segment as represented by
IWM, an exchange-traded fund [ETF], holds basket of thousands of smallcap stocks from across all major sectors of the US stock market. The smallcap index (contains stocks like Riverbed & Sotheby's) is down by -0.37% and is currently underperforming the overall market by -6.93% year-to-date. Below is a quick view of technical charts and trends: | |
 IWM Weekly Chart |
|
| Long Term Trend: Very Good | |
| Medium Term Trend: Good | |
 IWM Daily Chart |
|
| Short Term Trend: Very Good | |
| Overall Trend Score: 88 | |
| YTD Performance: -0.37% | |
| **Trend Scores & Views Are Only For Educational Purposes And Not For Investing | |
| 12Stocks.com: Top Performing Small Cap Index Stocks | ||||||||||||||||||||||||||||||||||||||||||||||||
 The top performing Small Cap Index stocks year to date are
Now, more recently, over last week, the top performing Small Cap Index stocks on the move are


|
||||||||||||||||||||||||||||||||||||||||||||||||
| 12Stocks.com: Investing in Smallcap Index using Exchange Traded Funds | |
|
The following table shows list of key exchange traded funds (ETF) that
help investors track Smallcap index. The following list also includes leveraged ETF funds that track twice or thrice the daily returns of Smallcap indices. Short or inverse ETF funds move in the opposite direction to the index they track and are useful during market pullbacks or during bear markets. Quick View: Move mouse or cursor over ETF symbol (ticker) to view short-term technical chart and over ETF name to view long term chart. Click on ticker or stock name for detailed view. Click on to add stock symbol to your watchlist and to view watchlist. |
12Stocks.com List of ETFs that track Smallcap Index
| Ticker | ETF Name | Watchlist | Recent Price | Smart Investing & Trading Score | Change % | Week % | Year-to-date % |
| IWM | iShares Russell 2000 | | 199.96 | 88 | 0.79 | 0.79 | -0.37% |
| IJR | iShares Core S&P Small-Cap | | 106.41 | 93 | 0.72 | 0.72 | -1.7% |
| VTWO | Vanguard Russell 2000 ETF | | 80.78 | 88 | 0.70 | 0.7 | -0.39% |
| IWN | iShares Russell 2000 Value | | 152.05 | 93 | 0.60 | 0.6 | -2.11% |
| IWO | iShares Russell 2000 Growth | | 255.74 | 78 | 1.05 | 1.05 | 1.4% |
| IJS | iShares S&P Small-Cap 600 Value | | 97.95 | 70 | 0.78 | 0.78 | -4.97% |
| IJT | iShares S&P Small-Cap 600 Growth | | 126.96 | 88 | 0.69 | 0.69 | 1.45% |
| XSLV | PowerShares S&P SmallCap Low Volatil ETF | | 42.87 | 80 | 0.35 | 0.35 | -2.9% |
| SMLV | SPDR SSGA US Small Cap Low Volatil ETF | | 107.77 | 68 | 0.23 | 0.23 | -4.22% |
| SAA | ProShares Ultra SmallCap600 | | 23.27 | 88 | 1.00 | 1 | -6.73% |
| SBB | ProShares Short SmallCap600 | | 16.28 | 8 | -0.64 | -0.64 | 2.2% |
| SDD | ProShares UltraShort SmallCap600 | | 19.09 | 15 | -1.34 | -1.34 | 3.6% |
| 12Stocks.com: Charts, Trends, Fundamental Data and Performances of SmallCap Stocks | |
|
We now take in-depth look at all SmallCap stocks including charts, multi-period performances and overall trends (as measured by Smart Investing & Trading Score). One can sort SmallCap stocks (click link to choose) by Daily, Weekly and by Year-to-Date performances. Also, one can sort by size of the company or by market capitalization. |
| Select Your Default Chart Type: | |||||
| |||||
| Click on stock symbol or name for detailed view. Click on to add stock symbol to your watchlist and to view watchlist. Quick View: Move mouse or cursor over "Daily" to quickly view daily technical stock chart and over "Weekly" to view weekly technical stock chart. | |||||

 | SCPH scPharmaceuticals Inc. |
| Sector: Health Care | |
| SubSector: Biotechnology | |
| MarketCap: 136.185 Millions | |
| Recent Price: 4.59 Smart Investing & Trading Score: 52 | |
| Day Percent Change: 2.23% Day Change: 0.10 | |
| Week Change: 2.23% Year-to-date Change: -26.8% | |
| SCPH Links: Profile News Message Board | |
| Charts:- Daily , Weekly | |
| Add SCPH to Watchlist: View: Get Complete SCPH Trend Analysis ➞ | |
 | XAIR Beyond Air, Inc. |
| Sector: Health Care | |
| SubSector: Medical Appliances & Equipment | |
| MarketCap: 132.48 Millions | |
| Recent Price: 1.15 Smart Investing & Trading Score: 27 | |
| Day Percent Change: -1.29% Day Change: -0.02 | |
| Week Change: -1.29% Year-to-date Change: -41.3% | |
| XAIR Links: Profile News Message Board | |
| Charts:- Daily , Weekly | |
| Add XAIR to Watchlist: View: Get Complete XAIR Trend Analysis ➞ | |
 | PLSE Pulse Biosciences, Inc. |
| Sector: Health Care | |
| SubSector: Medical Instruments & Supplies | |
| MarketCap: 131.96 Millions | |
| Recent Price: 7.24 Smart Investing & Trading Score: 64 | |
| Day Percent Change: 0.70% Day Change: 0.05 | |
| Week Change: 0.7% Year-to-date Change: -40.9% | |
| PLSE Links: Profile News Message Board | |
| Charts:- Daily , Weekly | |
| Add PLSE to Watchlist: View: Get Complete PLSE Trend Analysis ➞ | |
 | OVID Ovid Therapeutics Inc. |
| Sector: Health Care | |
| SubSector: Biotechnology | |
| MarketCap: 130.385 Millions | |
| Recent Price: 3.31 Smart Investing & Trading Score: 24 | |
| Day Percent Change: 6.61% Day Change: 0.21 | |
| Week Change: 6.61% Year-to-date Change: 2.6% | |
| OVID Links: Profile News Message Board | |
| Charts:- Daily , Weekly | |
| Add OVID to Watchlist: View: Get Complete OVID Trend Analysis ➞ | |
 | FENC Fennec Pharmaceuticals Inc. |
| Sector: Health Care | |
| SubSector: Biotechnology | |
| MarketCap: 126.785 Millions | |
| Recent Price: 9.15 Smart Investing & Trading Score: 32 | |
| Day Percent Change: -0.65% Day Change: -0.06 | |
| Week Change: -0.65% Year-to-date Change: -18.5% | |
| FENC Links: Profile News Message Board | |
| Charts:- Daily , Weekly | |
| Add FENC to Watchlist: View: Get Complete FENC Trend Analysis ➞ | |
 | JYNT The Joint Corp. |
| Sector: Health Care | |
| SubSector: Hospitals | |
| MarketCap: 125.146 Millions | |
| Recent Price: 12.31 Smart Investing & Trading Score: 83 | |
| Day Percent Change: 0.65% Day Change: 0.08 | |
| Week Change: 0.65% Year-to-date Change: 28.1% | |
| JYNT Links: Profile News Message Board | |
| Charts:- Daily , Weekly | |
| Add JYNT to Watchlist: View: Get Complete JYNT Trend Analysis ➞ | |
 | EYPT EyePoint Pharmaceuticals, Inc. |
| Sector: Health Care | |
| SubSector: Biotechnology | |
| MarketCap: 125.085 Millions | |
| Recent Price: 17.74 Smart Investing & Trading Score: 42 | |
| Day Percent Change: 5.91% Day Change: 0.99 | |
| Week Change: 5.91% Year-to-date Change: -23.2% | |
| EYPT Links: Profile News Message Board | |
| Charts:- Daily , Weekly | |
| Add EYPT to Watchlist: View: Get Complete EYPT Trend Analysis ➞ | |
 | ABUS Arbutus Biopharma Corporation |
| Sector: Health Care | |
| SubSector: Biotechnology | |
| MarketCap: 110.885 Millions | |
| Recent Price: 2.78 Smart Investing & Trading Score: 75 | |
| Day Percent Change: 1.83% Day Change: 0.05 | |
| Week Change: 1.83% Year-to-date Change: 11.2% | |
| ABUS Links: Profile News Message Board | |
| Charts:- Daily , Weekly | |
| Add ABUS to Watchlist: View: Get Complete ABUS Trend Analysis ➞ | |
 | HROW Harrow Health, Inc. |
| Sector: Health Care | |
| SubSector: Drug Manufacturers - Other | |
| MarketCap: 104.033 Millions | |
| Recent Price: 10.60 Smart Investing & Trading Score: 68 | |
| Day Percent Change: 0.66% Day Change: 0.07 | |
| Week Change: 0.66% Year-to-date Change: -5.4% | |
| HROW Links: Profile News Message Board | |
| Charts:- Daily , Weekly | |
| Add HROW to Watchlist: View: Get Complete HROW Trend Analysis ➞ | |
 | CRMD CorMedix, Inc. |
| Sector: Health Care | |
| SubSector: Biotechnology | |
| MarketCap: 90.7785 Millions | |
| Recent Price: 5.28 Smart Investing & Trading Score: 36 | |
| Day Percent Change: -0.56% Day Change: -0.03 | |
| Week Change: -0.56% Year-to-date Change: 40.4% | |
| CRMD Links: Profile News Message Board | |
| Charts:- Daily , Weekly | |
| Add CRMD to Watchlist: View: Get Complete CRMD Trend Analysis ➞ | |
 | IDYA IDEAYA Biosciences, Inc. |
| Sector: Health Care | |
| SubSector: Biotechnology | |
| MarketCap: 89.1785 Millions | |
| Recent Price: 40.70 Smart Investing & Trading Score: 49 | |
| Day Percent Change: 1.90% Day Change: 0.76 | |
| Week Change: 1.9% Year-to-date Change: 14.4% | |
| IDYA Links: Profile News Message Board | |
| Charts:- Daily , Weekly | |
| Add IDYA to Watchlist: View: Get Complete IDYA Trend Analysis ➞ | |
 | SAVA Cassava Sciences, Inc. |
| Sector: Health Care | |
| SubSector: Biotechnology | |
| MarketCap: 86.6785 Millions | |
| Recent Price: 22.27 Smart Investing & Trading Score: 52 | |
| Day Percent Change: -0.31% Day Change: -0.07 | |
| Week Change: -0.31% Year-to-date Change: -1.1% | |
| SAVA Links: Profile News Message Board | |
| Charts:- Daily , Weekly | |
| Add SAVA to Watchlist: View: Get Complete SAVA Trend Analysis ➞ | |
 | TELA TELA Bio, Inc. |
| Sector: Health Care | |
| SubSector: Medical Appliances & Equipment | |
| MarketCap: 81.808 Millions | |
| Recent Price: 4.52 Smart Investing & Trading Score: 35 | |
| Day Percent Change: 1.57% Day Change: 0.07 | |
| Week Change: 1.57% Year-to-date Change: -31.7% | |
| TELA Links: Profile News Message Board | |
| Charts:- Daily , Weekly | |
| Add TELA to Watchlist: View: Get Complete TELA Trend Analysis ➞ | |
 | LQDA Liquidia Technologies, Inc. |
| Sector: Health Care | |
| SubSector: Biotechnology | |
| MarketCap: 80.4785 Millions | |
| Recent Price: 12.48 Smart Investing & Trading Score: 17 | |
| Day Percent Change: -0.40% Day Change: -0.05 | |
| Week Change: -0.4% Year-to-date Change: 3.7% | |
| LQDA Links: Profile News Message Board | |
| Charts:- Daily , Weekly | |
| Add LQDA to Watchlist: View: Get Complete LQDA Trend Analysis ➞ | |
 | SVRA Savara Inc. |
| Sector: Health Care | |
| SubSector: Biotechnology | |
| MarketCap: 80.3785 Millions | |
| Recent Price: 4.60 Smart Investing & Trading Score: 32 | |
| Day Percent Change: 4.31% Day Change: 0.19 | |
| Week Change: 4.31% Year-to-date Change: -2.1% | |
| SVRA Links: Profile News Message Board | |
| Charts:- Daily , Weekly | |
| Add SVRA to Watchlist: View: Get Complete SVRA Trend Analysis ➞ | |
 | XERS Xeris Pharmaceuticals, Inc. |
| Sector: Health Care | |
| SubSector: Biotechnology | |
| MarketCap: 74.5785 Millions | |
| Recent Price: 1.75 Smart Investing & Trading Score: 27 | |
| Day Percent Change: 0.29% Day Change: 0.00 | |
| Week Change: 0.29% Year-to-date Change: -25.5% | |
| XERS Links: Profile News Message Board | |
| Charts:- Daily , Weekly | |
| Add XERS to Watchlist: View: Get Complete XERS Trend Analysis ➞ | |
 | CELC Celcuity Inc. |
| Sector: Health Care | |
| SubSector: Medical Laboratories & Research | |
| MarketCap: 70.53 Millions | |
| Recent Price: 16.00 Smart Investing & Trading Score: 53 | |
| Day Percent Change: 0.53% Day Change: 0.08 | |
| Week Change: 0.53% Year-to-date Change: 9.2% | |
| CELC Links: Profile News Message Board | |
| Charts:- Daily , Weekly | |
| Add CELC to Watchlist: View: Get Complete CELC Trend Analysis ➞ | |
 | ASRT Assertio Therapeutics, Inc. |
| Sector: Health Care | |
| SubSector: Drugs - Generic | |
| MarketCap: 65.8185 Millions | |
| Recent Price: 0.84 Smart Investing & Trading Score: 34 | |
| Day Percent Change: 1.79% Day Change: 0.01 | |
| Week Change: 1.79% Year-to-date Change: -21.9% | |
| ASRT Links: Profile News Message Board | |
| Charts:- Daily , Weekly | |
| Add ASRT to Watchlist: View: Get Complete ASRT Trend Analysis ➞ | |
 | HBIO Harvard Bioscience, Inc. |
| Sector: Health Care | |
| SubSector: Medical Instruments & Supplies | |
| MarketCap: 63.086 Millions | |
| Recent Price: 3.68 Smart Investing & Trading Score: 35 | |
| Day Percent Change: 1.66% Day Change: 0.06 | |
| Week Change: 1.66% Year-to-date Change: -31.2% | |
| HBIO Links: Profile News Message Board | |
| Charts:- Daily , Weekly | |
| Add HBIO to Watchlist: View: Get Complete HBIO Trend Analysis ➞ | |
 | ALDX Aldeyra Therapeutics, Inc. |
| Sector: Health Care | |
| SubSector: Biotechnology | |
| MarketCap: 61.2785 Millions | |
| Recent Price: 4.06 Smart Investing & Trading Score: 75 | |
| Day Percent Change: 3.31% Day Change: 0.13 | |
| Week Change: 3.31% Year-to-date Change: 15.7% | |
| ALDX Links: Profile News Message Board | |
| Charts:- Daily , Weekly | |
| Add ALDX to Watchlist: View: Get Complete ALDX Trend Analysis ➞ | |
 | CLPT ClearPoint Neuro, Inc. |
| Sector: Health Care | |
| SubSector: Medical Appliances & Equipment | |
| MarketCap: 55.108 Millions | |
| Recent Price: 5.35 Smart Investing & Trading Score: 25 | |
| Day Percent Change: 1.71% Day Change: 0.09 | |
| Week Change: 1.71% Year-to-date Change: -21.5% | |
| CLPT Links: Profile News Message Board | |
| Charts:- Daily , Weekly | |
| Add CLPT to Watchlist: View: Get Complete CLPT Trend Analysis ➞ | |
 | EYEN Eyenovia, Inc. |
| Sector: Health Care | |
| SubSector: Biotechnology | |
| MarketCap: 52.2785 Millions | |
| Recent Price: 0.71 Smart Investing & Trading Score: 64 | |
| Day Percent Change: 13.66% Day Change: 0.09 | |
| Week Change: 13.66% Year-to-date Change: -65.8% | |
| EYEN Links: Profile News Message Board | |
| Charts:- Daily , Weekly | |
| Add EYEN to Watchlist: View: Get Complete EYEN Trend Analysis ➞ | |
 | TRVI Trevi Therapeutics, Inc. |
| Sector: Health Care | |
| SubSector: Biotechnology | |
| MarketCap: 50.6785 Millions | |
| Recent Price: 2.94 Smart Investing & Trading Score: 75 | |
| Day Percent Change: 5.76% Day Change: 0.16 | |
| Week Change: 5.76% Year-to-date Change: 119.4% | |
| TRVI Links: Profile News Message Board | |
| Charts:- Daily , Weekly | |
| Add TRVI to Watchlist: View: Get Complete TRVI Trend Analysis ➞ | |
| For tabular summary view of above stock list: Summary View ➞ 0 - 25 , 25 - 50 , 50 - 75 , 75 - 100 , 100 - 125 , 125 - 150 , 150 - 175 , 175 - 200 , 200 - 225 , 225 - 250 , 250 - 275 , 275 - 300 , 300 - 325 , 325 - 350 | ||
| Click To Change The Sort Order: By Market Cap or Company Size Performance: Year-to-date, Week and Day | |
| Select Chart Type: | ||
| Too many stocks? View smallcap stocks filtered by marketcap & sector |
| Marketcap: All SmallCap Stocks (default-no microcap), Large, Mid-Range, Small & MicroCap |
| Sector: Tech, Finance, Energy, Staples, Retail, Industrial, Materials, Utilities & Medical |
|
Best Stocks Today 12Stocks.com |
© 2024 12Stocks.com Terms & Conditions Privacy Contact Us
All Information Provided Only For Education And Not To Be Used For Investing or Trading. See Terms & Conditions


One More Thing ... Get Best Stocks Delivered Daily!
Never Ever Miss A Move With Our Top Ten Stocks Lists
Find Best Stocks In Any Market - Bull or Bear Market
Take A Peek At Our Top Ten Stocks Lists: Daily, Weekly, Year-to-Date & Top Trends
Find Best Stocks In Any Market - Bull or Bear Market
Take A Peek At Our Top Ten Stocks Lists: Daily, Weekly, Year-to-Date & Top Trends
Smallcap Stocks With Best Up Trends [0-bearish to 100-bullish]: Bakkt [100], Deciphera [100], Phibro Animal[100], Heartland Financial[100], PTC [100], Sight Sciences[100], Richardson Electronics[100], Fulton Financial[100], Cullinan Oncology[100], TPI Composites[100], Lands [100]
Best Smallcap Stocks Year-to-Date:
CareMax [572.16%], Janux [422.57%], Bakkt [346.64%], Viking [305.75%], Longboard [248.45%], Alpine Immune[239.81%], Super Micro[213.31%], Avidity Biosciences[173.17%], Arcutis Bio[170.43%], Vera [167.34%], Cullinan Oncology[166.41%] Best Smallcap Stocks This Week:
Deciphera [71.95%], Vaxxinity [35.33%], Phibro Animal[31.89%], Zevia PBC[20.94%], Velo3D [19.97%], Janux [18.32%], Acrivon [18.09%], MultiPlan [15.53%], Heartland Financial[15.24%], Codexis [14.29%], Eyenovia [13.66%] Best Smallcap Stocks Daily:
Bakkt [2391.87%], Deciphera [71.95%], Vaxxinity [35.33%], Phibro Animal[31.89%], Zevia PBC[20.94%], Velo3D [19.97%], Janux [18.32%], Acrivon [18.09%], MultiPlan [15.53%], Heartland Financial[15.24%], Codexis [14.29%]