
 Login Sign Up


| |||||
 |  | ||||

| 12Stocks.com Market Intelligence |
Best SmallCap Stocks
|
| In a hurry? Small Cap Stock Lists: Performance Trends Table, Stock Charts
Sort Small Cap stocks: Daily, Weekly, Year-to-Date, Market Cap & Trends. Filter Small Cap stocks list by sector: Show all, Tech, Finance, Energy, Staples, Retail, Industrial, Materials, Utilities and HealthCare Filter Small Cap stocks list by size: All Large Medium Small and MicroCap |
| 12Stocks.com Small Cap Stocks Performances & Trends Daily | |||||||||
|
|  The overall Smart Investing & Trading Score is 32 (0-bearish to 100-bullish) which puts Small Cap index in short term bearish to neutral trend. The Smart Investing & Trading Score from previous trading session is 0 and hence an improvement of trend.
| ||||||||
Here are the Smart Investing & Trading Scores of the most requested small cap stocks at 12Stocks.com (click stock name for detailed review):
|


| 12Stocks.com: Investing in Smallcap Index with Stocks | |
|
The following table helps investors and traders sort through current performance and trends (as measured by Smart Investing & Trading Score) of various
stocks in the Smallcap Index. Quick View: Move mouse or cursor over stock symbol (ticker) to view short-term technical chart and over stock name to view long term chart. Click on  to add stock symbol to your watchlist and to add stock symbol to your watchlist and  to view watchlist. Click on any ticker or stock name for detailed market intelligence report for that stock. to view watchlist. Click on any ticker or stock name for detailed market intelligence report for that stock. |
12Stocks.com Performance of Stocks in Smallcap Index
| Ticker | Stock Name | Watchlist | Category | Recent Price | Smart Investing & Trading Score | Change % | YTD Change% |
| HBNC | Horizon Bancorp |   | Financials | 11.86 | 37 | -0.92 | -17.12% |
| FLIC | First of Long Island | | Financials | 9.59 | 27 | -0.93 | -27.57% |
| XHR | Xenia Hotels | | Financials | 14.40 | 57 | -0.93 | 5.69% |
| CPF | Central Pacific | | Financials | 20.13 | 60 | -0.94 | 2.29% |
| MBWM | Mercantile Bank | | Financials | 36.97 | 32 | -0.96 | -8.44% |
| SHBI | Shore Bancshares | | Financials | 10.79 | 35 | -0.96 | -24.32% |
| PFSI | PennyMac Financial | | Financials | 91.87 | 90 | -0.98 | 3.96% |
| MSBI | Midland States | | Financials | 22.19 | 35 | -0.98 | -19.48% |
| GSHD | Goosehead Insurance | | Financials | 57.60 | 0 | -0.98 | -24.01% |
| PAGS | PagSeguro Digital | | Financials | 11.57 | 17 | -0.98 | -7.18% |
| FIHL | Fidelis Insurance | | Financials | 15.94 | 32 | -0.99 | 26.16% |
| GBCI | Glacier Bancorp | | Financials | 35.64 | 25 | -1.00 | -13.75% |
| RILY | B. Riley | | Financials | 22.77 | 68 | -1.00 | 8.48% |
| CNNE | Cannae | | Financials | 17.74 | 42 | -1.00 | -9.07% |
| DCOM | Dime Community | | Financials | 18.68 | 67 | -1.01 | -30.63% |
| ESGR | Enstar Group | | Financials | 298.90 | 25 | -1.01 | 1.55% |
| DHIL | Diamond Hill | | Financials | 148.50 | 35 | -1.01 | -10.32% |
| NBHC | National Bank | | Financials | 36.42 | 80 | -1.01 | -2.07% |
| LKFN | Lakeland Financial | | Financials | 61.03 | 62 | -1.02 | -6.34% |
| STEP | StepStone Group | | Financials | 44.73 | 100 | -1.02 | 40.48% |
| TOWN | TowneBank | | Financials | 26.34 | 25 | -1.03 | -11.48% |
| PAX | Patria s | | Financials | 12.54 | 17 | -1.03 | -20.08% |
| AX | Axos Financial | | Financials | 53.40 | 45 | -1.03 | -2.21% |
| AMBC | Ambac Financial | | Financials | 12.90 | 25 | -1.04 | -21.69% |
| WSBF | Waterstone Financial | | Financials | 12.20 | 80 | -1.05 | -14.08% |
| For chart view version of above stock list: Chart View ➞ 0 - 25 , 25 - 50 , 50 - 75 , 75 - 100 , 100 - 125 , 125 - 150 , 150 - 175 , 175 - 200 , 200 - 225 , 225 - 250 , 250 - 275 , 275 - 300 , 300 - 325 , 325 - 350 , 350 - 375 | ||
 | Click To Change The Sort Order: By Market Cap or Company Size Performance: Year-to-date, Week and Day |  |
| Too many stocks? View smallcap stocks filtered by marketcap & sector |
| Marketcap: All SmallCap Stocks (default-no microcap), Large, Mid-Range, Small |
| Smallcap Sector: Tech, Finance, Energy, Staples, Retail, Industrial, Materials, & Medical |
|
Get the most comprehensive stock market coverage daily at 12Stocks.com ➞ Best Stocks Today ➞ Best Stocks Weekly ➞ Best Stocks Year-to-Date ➞ Best Stocks Trends ➞  Best Stocks Today 12Stocks.com Best Nasdaq Stocks ➞ Best S&P 500 Stocks ➞ Best Tech Stocks ➞ Best Biotech Stocks ➞ |
| Detailed Overview of SmallCap Stocks |
| SmallCap Technical Overview, Leaders & Laggards, Top SmallCap ETF Funds & Detailed SmallCap Stocks List, Charts, Trends & More |
| Smallcap: Technical Analysis, Trends & YTD Performance | |
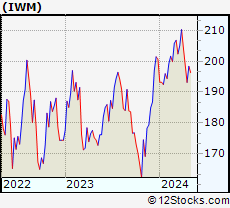
| SmallCap segment as represented by
IWM, an exchange-traded fund [ETF], holds basket of thousands of smallcap stocks from across all major sectors of the US stock market. The smallcap index (contains stocks like Riverbed & Sotheby's) is up by 0.59% and is currently underperforming the overall market by -11.99% year-to-date. Below is a quick view of technical charts and trends: | |
 IWM Weekly Chart |
|
| Long Term Trend: Not Good | |
| Medium Term Trend: Not Good | |
 IWM Daily Chart |
|
| Short Term Trend: Very Good | |
| Overall Trend Score: 32 | |
| YTD Performance: 0.59% | |
| **Trend Scores & Views Are Only For Educational Purposes And Not For Investing | |
| 12Stocks.com: Top Performing Small Cap Index Stocks | ||||||||||||||||||||||||||||||||||||||||||||||||
 The top performing Small Cap Index stocks year to date are
Now, more recently, over last week, the top performing Small Cap Index stocks on the move are


|
||||||||||||||||||||||||||||||||||||||||||||||||
| 12Stocks.com: Investing in Smallcap Index using Exchange Traded Funds | |
|
The following table shows list of key exchange traded funds (ETF) that
help investors track Smallcap index. The following list also includes leveraged ETF funds that track twice or thrice the daily returns of Smallcap indices. Short or inverse ETF funds move in the opposite direction to the index they track and are useful during market pullbacks or during bear markets. Quick View: Move mouse or cursor over ETF symbol (ticker) to view short-term technical chart and over ETF name to view long term chart. Click on ticker or stock name for detailed view. Click on to add stock symbol to your watchlist and to view watchlist. |
12Stocks.com List of ETFs that track Smallcap Index
| Ticker | ETF Name | Watchlist | Recent Price | Smart Investing & Trading Score | Change % | Week % | Year-to-date % |
| IWM | iShares Russell 2000 | | 201.90 | 32 | -0.90 | 0.35 | 0.59% |
| SMLV | SPDR SSGA US Small Cap Low Volatil ETF | | 108.00 | 25 | -0.39 | -0.04 | -4.02% |
| SDD | ProShares UltraShort SmallCap600 | | 18.72 | 63 | 0.96 | -1.69 | 1.58% |
| SBB | ProShares Short SmallCap600 | | 16.20 | 51 | 0.56 | -0.55 | 1.7% |
| SAA | ProShares Ultra SmallCap600 | | 23.69 | 32 | -0.01 | 1.64 | -5.06% |
| 12Stocks.com: Charts, Trends, Fundamental Data and Performances of SmallCap Stocks | |
|
We now take in-depth look at all SmallCap stocks including charts, multi-period performances and overall trends (as measured by Smart Investing & Trading Score). One can sort SmallCap stocks (click link to choose) by Daily, Weekly and by Year-to-Date performances. Also, one can sort by size of the company or by market capitalization. |
| Select Your Default Chart Type: | |||||
| |||||
| Click on stock symbol or name for detailed view. Click on to add stock symbol to your watchlist and to view watchlist. Quick View: Move mouse or cursor over "Daily" to quickly view daily technical stock chart and over "Weekly" to view weekly technical stock chart. | |||||

 | HBNC Horizon Bancorp, Inc. |
| Sector: Financials | |
| SubSector: Regional - Northeast Banks | |
| MarketCap: 405.999 Millions | |
| Recent Price: 11.86 Smart Investing & Trading Score: 37 | |
| Day Percent Change: -0.92% Day Change: -0.11 | |
| Week Change: 0.08% Year-to-date Change: -17.1% | |
| HBNC Links: Profile News Message Board | |
| Charts:- Daily , Weekly | |
| Add HBNC to Watchlist: View: Get Complete HBNC Trend Analysis ➞ | |
 | FLIC The First of Long Island Corporation |
| Sector: Financials | |
| SubSector: Regional - Northeast Banks | |
| MarketCap: 352.899 Millions | |
| Recent Price: 9.59 Smart Investing & Trading Score: 27 | |
| Day Percent Change: -0.93% Day Change: -0.09 | |
| Week Change: -1.94% Year-to-date Change: -27.6% | |
| FLIC Links: Profile News Message Board | |
| Charts:- Daily , Weekly | |
| Add FLIC to Watchlist: View: Get Complete FLIC Trend Analysis ➞ | |
 | XHR Xenia Hotels & Resorts, Inc. |
| Sector: Financials | |
| SubSector: REIT - Hotel/Motel | |
| MarketCap: 1058.24 Millions | |
| Recent Price: 14.40 Smart Investing & Trading Score: 57 | |
| Day Percent Change: -0.93% Day Change: -0.13 | |
| Week Change: 1.02% Year-to-date Change: 5.7% | |
| XHR Links: Profile News Message Board | |
| Charts:- Daily , Weekly | |
| Add XHR to Watchlist: View: Get Complete XHR Trend Analysis ➞ | |
 | CPF Central Pacific Financial Corp. |
| Sector: Financials | |
| SubSector: Regional - Pacific Banks | |
| MarketCap: 407.429 Millions | |
| Recent Price: 20.13 Smart Investing & Trading Score: 60 | |
| Day Percent Change: -0.94% Day Change: -0.19 | |
| Week Change: -0.98% Year-to-date Change: 2.3% | |
| CPF Links: Profile News Message Board | |
| Charts:- Daily , Weekly | |
| Add CPF to Watchlist: View: Get Complete CPF Trend Analysis ➞ | |
 | MBWM Mercantile Bank Corporation |
| Sector: Financials | |
| SubSector: Regional - Midwest Banks | |
| MarketCap: 372.77 Millions | |
| Recent Price: 36.97 Smart Investing & Trading Score: 32 | |
| Day Percent Change: -0.96% Day Change: -0.36 | |
| Week Change: 1.57% Year-to-date Change: -8.4% | |
| MBWM Links: Profile News Message Board | |
| Charts:- Daily , Weekly | |
| Add MBWM to Watchlist: View: Get Complete MBWM Trend Analysis ➞ | |
 | SHBI Shore Bancshares, Inc. |
| Sector: Financials | |
| SubSector: Regional - Mid-Atlantic Banks | |
| MarketCap: 131.359 Millions | |
| Recent Price: 10.79 Smart Investing & Trading Score: 35 | |
| Day Percent Change: -0.96% Day Change: -0.11 | |
| Week Change: -0.42% Year-to-date Change: -24.3% | |
| SHBI Links: Profile News Message Board | |
| Charts:- Daily , Weekly | |
| Add SHBI to Watchlist: View: Get Complete SHBI Trend Analysis ➞ | |
 | PFSI PennyMac Financial Services, Inc. |
| Sector: Financials | |
| SubSector: Mortgage Investment | |
| MarketCap: 1588.09 Millions | |
| Recent Price: 91.87 Smart Investing & Trading Score: 90 | |
| Day Percent Change: -0.98% Day Change: -0.91 | |
| Week Change: 2.83% Year-to-date Change: 4.0% | |
| PFSI Links: Profile News Message Board | |
| Charts:- Daily , Weekly | |
| Add PFSI to Watchlist: View: Get Complete PFSI Trend Analysis ➞ | |
 | MSBI Midland States Bancorp, Inc. |
| Sector: Financials | |
| SubSector: Regional - Midwest Banks | |
| MarketCap: 400.27 Millions | |
| Recent Price: 22.19 Smart Investing & Trading Score: 35 | |
| Day Percent Change: -0.98% Day Change: -0.22 | |
| Week Change: -0.72% Year-to-date Change: -19.5% | |
| MSBI Links: Profile News Message Board | |
| Charts:- Daily , Weekly | |
| Add MSBI to Watchlist: View: Get Complete MSBI Trend Analysis ➞ | |
 | GSHD Goosehead Insurance, Inc |
| Sector: Financials | |
| SubSector: Insurance Brokers | |
| MarketCap: 1863.57 Millions | |
| Recent Price: 57.60 Smart Investing & Trading Score: 0 | |
| Day Percent Change: -0.98% Day Change: -0.57 | |
| Week Change: -6.4% Year-to-date Change: -24.0% | |
| GSHD Links: Profile News Message Board | |
| Charts:- Daily , Weekly | |
| Add GSHD to Watchlist: View: Get Complete GSHD Trend Analysis ➞ | |
 | PAGS PagSeguro Digital Ltd. |
| Sector: Financials | |
| SubSector: Credit Services | |
| MarketCap: 6500.78 Millions | |
| Recent Price: 11.57 Smart Investing & Trading Score: 17 | |
| Day Percent Change: -0.98% Day Change: -0.12 | |
| Week Change: -4.1% Year-to-date Change: -7.2% | |
| PAGS Links: Profile News Message Board | |
| Charts:- Daily , Weekly | |
| Add PAGS to Watchlist: View: Get Complete PAGS Trend Analysis ➞ | |
 | FIHL Fidelis Insurance Holdings Limited |
| Sector: Financials | |
| SubSector: Insurance - Diversified | |
| MarketCap: 1590 Millions | |
| Recent Price: 15.94 Smart Investing & Trading Score: 32 | |
| Day Percent Change: -0.99% Day Change: -0.16 | |
| Week Change: 1.34% Year-to-date Change: 26.2% | |
| FIHL Links: Profile News Message Board | |
| Charts:- Daily , Weekly | |
| Add FIHL to Watchlist: View: Get Complete FIHL Trend Analysis ➞ | |
 | GBCI Glacier Bancorp, Inc. |
| Sector: Financials | |
| SubSector: Regional - Pacific Banks | |
| MarketCap: 3142.89 Millions | |
| Recent Price: 35.64 Smart Investing & Trading Score: 25 | |
| Day Percent Change: -1.00% Day Change: -0.36 | |
| Week Change: -1.03% Year-to-date Change: -13.8% | |
| GBCI Links: Profile News Message Board | |
| Charts:- Daily , Weekly | |
| Add GBCI to Watchlist: View: Get Complete GBCI Trend Analysis ➞ | |
 | RILY B. Riley Financial, Inc. |
| Sector: Financials | |
| SubSector: Asset Management | |
| MarketCap: 443.703 Millions | |
| Recent Price: 22.77 Smart Investing & Trading Score: 68 | |
| Day Percent Change: -1.00% Day Change: -0.23 | |
| Week Change: 1.11% Year-to-date Change: 8.5% | |
| RILY Links: Profile News Message Board | |
| Charts:- Daily , Weekly | |
| Add RILY to Watchlist: View: Get Complete RILY Trend Analysis ➞ | |
 | CNNE Cannae Holdings, Inc. |
| Sector: Financials | |
| SubSector: Asset Management | |
| MarketCap: 2625.53 Millions | |
| Recent Price: 17.74 Smart Investing & Trading Score: 42 | |
| Day Percent Change: -1.00% Day Change: -0.18 | |
| Week Change: 2.31% Year-to-date Change: -9.1% | |
| CNNE Links: Profile News Message Board | |
| Charts:- Daily , Weekly | |
| Add CNNE to Watchlist: View: Get Complete CNNE Trend Analysis ➞ | |
 | DCOM Dime Community Bancshares, Inc. |
| Sector: Financials | |
| SubSector: Savings & Loans | |
| MarketCap: 477.83 Millions | |
| Recent Price: 18.68 Smart Investing & Trading Score: 67 | |
| Day Percent Change: -1.01% Day Change: -0.19 | |
| Week Change: 2.41% Year-to-date Change: -30.6% | |
| DCOM Links: Profile News Message Board | |
| Charts:- Daily , Weekly | |
| Add DCOM to Watchlist: View: Get Complete DCOM Trend Analysis ➞ | |
 | ESGR Enstar Group Limited |
| Sector: Financials | |
| SubSector: Property & Casualty Insurance | |
| MarketCap: 2886.02 Millions | |
| Recent Price: 298.90 Smart Investing & Trading Score: 25 | |
| Day Percent Change: -1.01% Day Change: -3.04 | |
| Week Change: -0.27% Year-to-date Change: 1.6% | |
| ESGR Links: Profile News Message Board | |
| Charts:- Daily , Weekly | |
| Add ESGR to Watchlist: View: Get Complete ESGR Trend Analysis ➞ | |
 | DHIL Diamond Hill Investment Group, Inc. |
| Sector: Financials | |
| SubSector: Asset Management | |
| MarketCap: 316.203 Millions | |
| Recent Price: 148.50 Smart Investing & Trading Score: 35 | |
| Day Percent Change: -1.01% Day Change: -1.52 | |
| Week Change: -0.31% Year-to-date Change: -10.3% | |
| DHIL Links: Profile News Message Board | |
| Charts:- Daily , Weekly | |
| Add DHIL to Watchlist: View: Get Complete DHIL Trend Analysis ➞ | |
 | NBHC National Bank Holdings Corporation |
| Sector: Financials | |
| SubSector: Regional - Midwest Banks | |
| MarketCap: 766.87 Millions | |
| Recent Price: 36.42 Smart Investing & Trading Score: 80 | |
| Day Percent Change: -1.01% Day Change: -0.37 | |
| Week Change: -0.65% Year-to-date Change: -2.1% | |
| NBHC Links: Profile News Message Board | |
| Charts:- Daily , Weekly | |
| Add NBHC to Watchlist: View: Get Complete NBHC Trend Analysis ➞ | |
 | LKFN Lakeland Financial Corporation |
| Sector: Financials | |
| SubSector: Regional - Midwest Banks | |
| MarketCap: 903.27 Millions | |
| Recent Price: 61.03 Smart Investing & Trading Score: 62 | |
| Day Percent Change: -1.02% Day Change: -0.63 | |
| Week Change: -0.31% Year-to-date Change: -6.3% | |
| LKFN Links: Profile News Message Board | |
| Charts:- Daily , Weekly | |
| Add LKFN to Watchlist: View: Get Complete LKFN Trend Analysis ➞ | |
 | STEP StepStone Group Inc. |
| Sector: Financials | |
| SubSector: Asset Management | |
| MarketCap: 30757 Millions | |
| Recent Price: 44.73 Smart Investing & Trading Score: 100 | |
| Day Percent Change: -1.02% Day Change: -0.46 | |
| Week Change: 7.91% Year-to-date Change: 40.5% | |
| STEP Links: Profile News Message Board | |
| Charts:- Daily , Weekly | |
| Add STEP to Watchlist: View: Get Complete STEP Trend Analysis ➞ | |
 | TOWN TowneBank |
| Sector: Financials | |
| SubSector: Regional - Mid-Atlantic Banks | |
| MarketCap: 1344.09 Millions | |
| Recent Price: 26.34 Smart Investing & Trading Score: 25 | |
| Day Percent Change: -1.03% Day Change: -0.28 | |
| Week Change: -0.43% Year-to-date Change: -11.5% | |
| TOWN Links: Profile News Message Board | |
| Charts:- Daily , Weekly | |
| Add TOWN to Watchlist: View: Get Complete TOWN Trend Analysis ➞ | |
 | PAX Patria Investments Limited |
| Sector: Financials | |
| SubSector: Asset Management | |
| MarketCap: 2130 Millions | |
| Recent Price: 12.54 Smart Investing & Trading Score: 17 | |
| Day Percent Change: -1.03% Day Change: -0.13 | |
| Week Change: -2.03% Year-to-date Change: -20.1% | |
| PAX Links: Profile News Message Board | |
| Charts:- Daily , Weekly | |
| Add PAX to Watchlist: View: Get Complete PAX Trend Analysis ➞ | |
 | AX Axos Financial, Inc. |
| Sector: Financials | |
| SubSector: Savings & Loans | |
| MarketCap: 1037.3 Millions | |
| Recent Price: 53.40 Smart Investing & Trading Score: 45 | |
| Day Percent Change: -1.03% Day Change: -0.55 | |
| Week Change: 2.37% Year-to-date Change: -2.2% | |
| AX Links: Profile News Message Board | |
| Charts:- Daily , Weekly | |
| Add AX to Watchlist: View: Get Complete AX Trend Analysis ➞ | |
 | AMBC Ambac Financial Group, Inc. |
| Sector: Financials | |
| SubSector: Surety & Title Insurance | |
| MarketCap: 587.818 Millions | |
| Recent Price: 12.90 Smart Investing & Trading Score: 25 | |
| Day Percent Change: -1.04% Day Change: -0.13 | |
| Week Change: -0.5% Year-to-date Change: -21.7% | |
| AMBC Links: Profile News Message Board | |
| Charts:- Daily , Weekly | |
| Add AMBC to Watchlist: View: Get Complete AMBC Trend Analysis ➞ | |
 | WSBF Waterstone Financial, Inc. |
| Sector: Financials | |
| SubSector: Savings & Loans | |
| MarketCap: 371.93 Millions | |
| Recent Price: 12.20 Smart Investing & Trading Score: 80 | |
| Day Percent Change: -1.05% Day Change: -0.13 | |
| Week Change: 0.58% Year-to-date Change: -14.1% | |
| WSBF Links: Profile News Message Board | |
| Charts:- Daily , Weekly | |
| Add WSBF to Watchlist: View: Get Complete WSBF Trend Analysis ➞ | |
| For tabular summary view of above stock list: Summary View ➞ 0 - 25 , 25 - 50 , 50 - 75 , 75 - 100 , 100 - 125 , 125 - 150 , 150 - 175 , 175 - 200 , 200 - 225 , 225 - 250 , 250 - 275 , 275 - 300 , 300 - 325 , 325 - 350 , 350 - 375 | ||
| Click To Change The Sort Order: By Market Cap or Company Size Performance: Year-to-date, Week and Day | |
| Select Chart Type: | ||
| Too many stocks? View smallcap stocks filtered by marketcap & sector |
| Marketcap: All SmallCap Stocks (default-no microcap), Large, Mid-Range, Small & MicroCap |
| Sector: Tech, Finance, Energy, Staples, Retail, Industrial, Materials, Utilities & Medical |
|
Best Stocks Today 12Stocks.com |
© 2024 12Stocks.com Terms & Conditions Privacy Contact Us
All Information Provided Only For Education And Not To Be Used For Investing or Trading. See Terms & Conditions


One More Thing ... Get Best Stocks Delivered Daily!
Never Ever Miss A Move With Our Top Ten Stocks Lists
Find Best Stocks In Any Market - Bull or Bear Market
Take A Peek At Our Top Ten Stocks Lists: Daily, Weekly, Year-to-Date & Top Trends
Find Best Stocks In Any Market - Bull or Bear Market
Take A Peek At Our Top Ten Stocks Lists: Daily, Weekly, Year-to-Date & Top Trends
Smallcap Stocks With Best Up Trends [0-bearish to 100-bullish]: Axcelis [100], Riot Blockchain[100], Blink Charging[100], Avidity Biosciences[100], Redwire [100], Rackspace [100], Mirum [100], Nextracker [100], Independence Realty[100], Krystal Biotech[100], Vita Coco[100]
Best Smallcap Stocks Year-to-Date:
CareMax [526.8%], Li-Cycle [461%], Dominion Midstream[412.65%], Avidity Biosciences[336.67%], Janux [303.16%], Stoke [227.95%], Novavax [226.56%], Longboard [216.04%], Summit [213.6%], Sweetgreen [205.66%], Super Micro[181.78%] Best Smallcap Stocks This Week:
Dominion Midstream[685.71%], Avidity Biosciences[48.4%], Kaltura [44.96%], Biomea Fusion[38.65%], Scilex Holding[37.61%], Eos Energy[36.42%], Nerdy [28.91%], Enovix [26.29%], Cipher Mining[23.33%], Li-Cycle [23.32%], 89bio [21.17%] Best Smallcap Stocks Daily:
Biomea Fusion[24.11%], Cipher Mining[9.11%], Nerdy [8.91%], Vanda [8.78%], Replimune Group[7.14%], Korn Ferry[7.03%], Li-Cycle [6.40%], Cue Biopharma[6.00%], MBIA [5.35%], Torrid [5.30%], Axcelis [5.20%]