
 Login Sign Up


| |||||
 |  | ||||

| 12Stocks.com Market Intelligence |
Best Nasdaq Stocks
|
On this page, you will find the most comprehensive analysis of Nasdaq 100 stocks and ETFs - from latest trends to performances to charts ➞. First, here are the year-to-date (YTD) performances of the most requested Nasdaq stocks at 12Stocks.com (click stock for review):
| NVIDIA 87% | ||
| QUALCOMM 34% | ||
| Netflix 28% | ||
| Google 26% | ||
| Amazon.com 22% | ||
| Costco 21% | ||
| Microsoft 12% | ||
| Amgen 8% | ||
| Apple -1% | ||
| Baidu -7% | ||
| Comcast -10% | ||
| Biogen -11% | ||
| Gilead -16% | ||
| Starbucks -19% | ||
| Expedia -25% | ||
| Tesla -29% | ||
| Intel -37% | ||
| Nasdaq 100 Stocks Lists: Performances & Trends, Nasdaq 100 Stock Charts
Sort Nasdaq 100 stocks: Daily, Weekly, Year-to-Date, Market Cap & Trends. |
| 12Stocks.com Nasdaq Stocks Performances & Trends Daily Report | |||||||||
|
| 
The overall Smart Investing & Trading Score is 78 (0-bearish to 100-bullish) which puts Nasdaq index in short term neutral to bullish trend. The Smart Investing & Trading Score from previous trading session is 95 and hence a deterioration of trend. | ||||||||
| Here are the Smart Investing & Trading Scores of the most requested Nasdaq 100 stocks at 12Stocks.com (click stock name for detailed review): |


| 12Stocks.com: Top Performing Nasdaq 100 Index Stocks | ||||||||||||||||||||||||||||||||||||||||||||||||
 The top performing Nasdaq 100 Index stocks year to date are
Now, more recently, over last week, the top performing Nasdaq 100 Index stocks on the move are


|
||||||||||||||||||||||||||||||||||||||||||||||||
| 12Stocks.com: Investing in Nasdaq 100 Index with Stocks | |
|
The following table helps investors and traders sort through current performance and trends (as measured by Smart Investing & Trading Score) of various
stocks in the Nasdaq 100 Index. Quick View: Move mouse or cursor over stock symbol (ticker) to view short-term technical chart and over stock name to view long term chart. Click on  to add stock symbol to your watchlist and to add stock symbol to your watchlist and  to view watchlist. Click on any ticker or stock name for detailed market intelligence report for that stock. to view watchlist. Click on any ticker or stock name for detailed market intelligence report for that stock. |
12Stocks.com Performance of Stocks in Nasdaq 100 Index
| Ticker | Stock Name | Watchlist | Category | Recent Price | Smart Investing & Trading Score | Change % | YTD Change% |
| AEP | American Electric |   | Utilities | 92.67 | 83 | 0.14 | 14.10% |
| SPY | SPDR S&P | | Utilities | 529.45 | 88 | 0.14 | 11.39% |
| CTAS | Cintas | | Services & Goods | 692.14 | 61 | 0.11 | 14.85% |
| ADBE | Adobe | | Technology | 483.43 | 47 | 0.11 | -18.97% |
| MCHP | Microchip | | Technology | 94.33 | 76 | 0.10 | 4.60% |
| PCAR | PACCAR | | Consumer Staples | 106.00 | 7 | 0.07 | 8.55% |
| VRSK | Verisk Analytics | | Services & Goods | 251.62 | 90 | 0.06 | 5.34% |
| ANSS | ANSYS | | Technology | 327.71 | 25 | 0.05 | -9.69% |
| AAPL | Apple | | Technology | 189.87 | 83 | 0.05 | -1.38% |
| MNST | Monster Beverage | | Consumer Staples | 54.11 | 40 | 0.04 | -6.08% |
| TXN | Texas Instruments | | Technology | 195.02 | 90 | 0.03 | 14.41% |
| ADI | Analog Devices | | Technology | 214.08 | 83 | -0.02 | 7.82% |
| CDNS | Cadence Design | | Technology | 288.81 | 52 | -0.04 | 6.04% |
| EXC | Exelon | | Utilities | 38.58 | 76 | -0.10 | 7.47% |
| QQEW | First Trust | | Utilities | 122.69 | 70 | -0.13 | 4.46% |
| CPRT | Copart | | Services & Goods | 54.50 | 34 | -0.15 | 11.22% |
| AZN | AstraZeneca | | Health Care | 76.90 | 71 | -0.18 | 14.18% |
| MSFT | Microsoft | | Technology | 420.21 | 78 | -0.19 | 11.75% |
| KHC | Kraft Heinz | | Consumer Staples | 36.00 | 51 | -0.19 | -2.65% |
| GILD | Gilead | | Health Care | 67.72 | 45 | -0.21 | -16.41% |
| TQQQ | UltraPro | | Utilities | 62.94 | 78 | -0.22 | 24.14% |
| CDW | CDW | | Technology | 223.64 | 39 | -0.22 | -1.62% |
| KLAC | KLA | | Technology | 747.68 | 83 | -0.24 | 28.62% |
| CMCSA | Comcast | | Services & Goods | 39.27 | 32 | -0.25 | -10.44% |
| ZS | Zscaler | | Technology | 178.86 | 52 | -0.25 | -19.27% |
| META | Meta Platforms | | Technology | 471.91 | 33 | -0.28 | 33.30% |
| HON | Honeywell | | Industrials | 205.97 | 90 | -0.31 | -1.78% |
| CSCO | Cisco | | Technology | 48.17 | 38 | -0.35 | -4.65% |
| DXCM | DexCom | | Health Care | 131.36 | 100 | -0.42 | 5.86% |
| GFS | GLOBALFOUNDRIES | | Technology | 53.95 | 35 | -0.42 | -10.83% |
| For chart view version of above stock list: Chart View ➞ 0 - 30 , 30 - 60 , 60 - 90 , 90 - 120 | ||
 | Click To Change The Sort Order: By Market Cap or Company Size Performance: Year-to-date, Week and Day |  |
|
Get the most comprehensive stock market coverage daily at 12Stocks.com ➞ Best Stocks Today ➞ Best Stocks Weekly ➞ Best Stocks Year-to-Date ➞ Best Stocks Trends ➞  Best Stocks Today 12Stocks.com Best Dow Stocks ➞ Best S&P 500 Stocks ➞ Best Tech Stocks ➞ Best Biotech Stocks ➞ |
| Detailed Overview of Nasdaq 100 Stocks |
| Nasdaq 100 Technical Overview, Leaders & Laggards, Top Nasdaq 100 ETF Funds & Detailed Nasdaq 100 Stocks List, Charts, Trends & More |
| Nasdaq 100: Technical Analysis, Trends & YTD Performance | |
| Nasdaq 100 index as represented by
QQQ, an exchange-traded fund [ETF], holds basket of one hundred (mostly largecap) stocks from technology, biotech & retail sectors of the US stock market. The Nasdaq 100 index (contains stocks like Apple and Amgen) is up by 10.31% and is currently underperforming the overall market by -0.26% year-to-date. Below is a quick view of technical charts and trends: | |
 QQQ Weekly Chart |
|
| Long Term Trend: Very Good | |
| Medium Term Trend: Very Good | |
 QQQ Daily Chart |
|
| Short Term Trend: Good | |
| Overall Trend Score: 78 | |
| YTD Performance: 10.31% | |
| **Trend Scores & Views Are Only For Educational Purposes And Not For Investing | |
| 12Stocks.com: Investing in Nasdaq 100 Index using Exchange Traded Funds | |
|
The following table shows list of key exchange traded funds (ETF) that
help investors track Nasdaq 100 index. The following list also includes leveraged ETF funds that track twice or thrice the daily returns of Nasdaq 100 indices. Short or inverse ETF funds move in the opposite direction to the index they track and are useful during market pullbacks or during bear markets. Quick View: Move mouse or cursor over ETF symbol (ticker) to view short-term technical chart and over ETF name to view long term chart. Click on ticker or stock name for detailed view. Click on to add stock symbol to your watchlist and to view watchlist. |
12Stocks.com List of ETFs that track Nasdaq 100 Index
| Ticker | ETF Name | Watchlist | Recent Price | Smart Investing & Trading Score | Change % | Week % | Year-to-date % |
| SQQQ | ProShares UltraPro Short QQQ | | 9.97 | 17 | 0.30 | -6.03 | -25.87% |
| QQQ | PowerShares QQQ ETF | | 451.76 | 78 | -0.62 | 2.19 | 10.31% |
| TQQQ | ProShares UltraPro QQQ | | 62.94 | 78 | -0.22 | 6.37 | 24.14% |
| QYLD | Recon Capital NASDAQ 100 Cov Call ETF | | 17.63 | 50 | 0.11 | -0.06 | 1.67% |
| QID | ProShares UltraShort QQQ | | 43.61 | 22 | 0.16 | -4.03 | -17.79% |
| QLD | ProShares Ultra QQQ | | 89.44 | 78 | -0.10 | 4.28 | 17.68% |
| QQEW | First Trust NASDAQ-100 Equal Wtd ETF | | 122.69 | 70 | -0.13 | 1.85 | 4.46% |
| QQQE | Direxion NASDAQ-100 Equal Wtd ETF | | 88.30 | 57 | -0.15 | 1.85 | 4.32% |
| QTEC | First Trust NASDAQ-100-Tech Sector ETF | | 190.75 | 65 | -0.78 | 3.23 | 8.71% |
| QQQX | Nuveen Nasdaq 100 Dynamic Overwrite Fund | | 23.85 | 63 | -0.21 | 0.89 | 3.02% |
| QQXT | First Trust NASDAQ-100 ex-Tech Sect ETF | | 89.49 | 58 | -0.26 | 1.03 | 1.54% |
| 12Stocks.com: Charts, Trends, Fundamental Data and Performances of Nasdaq 100 Stocks | |
|
We now take in-depth look at all Nasdaq 100 stocks including charts, multi-period performances and overall trends (as measured by Smart Investing & Trading Score). One can sort Nasdaq 100 stocks (click link to choose) by Daily, Weekly and by Year-to-Date performances. Also, one can sort by size of the company or by market capitalization. |
| Select Your Default Chart Type: | |||||
| |||||
| Click on stock symbol or name for detailed view. Click on to add stock symbol to your watchlist and to view watchlist. Quick View: Move mouse or cursor over "Daily" to quickly view daily technical stock chart and over "Weekly" to view weekly technical stock chart. | |||||

 | AEP American Electric Power Company, Inc. |
| Sector: Utilities | |
| SubSector: Electric Utilities | |
| MarketCap: 38380 Millions | |
| Recent Price: 92.67 Smart Investing & Trading Score: 83 | |
| Day Percent Change: 0.14% Day Change: 0.13 | |
| Week Change: 1.16% Year-to-date Change: 14.1% | |
| AEP Links: Profile News Message Board | |
| Charts:- Daily , Weekly | |
| Add AEP to Watchlist: View: Get Complete AEP Trend Analysis ➞ | |
 | SPY SPDR S&P 500 ETF |
| Sector: Utilities | |
| SubSector: Exchange Traded Fund | |
| MarketCap: 0 Millions | |
| Recent Price: 529.45 Smart Investing & Trading Score: 88 | |
| Day Percent Change: 0.14% Day Change: 0.76 | |
| Week Change: 1.65% Year-to-date Change: 11.4% | |
| SPY Links: Profile News Message Board | |
| Charts:- Daily , Weekly | |
| Add SPY to Watchlist: View: Get Complete SPY Trend Analysis ➞ | |
 | CTAS Cintas Corporation |
| Sector: Services & Goods | |
| SubSector: Business Services | |
| MarketCap: 20154.6 Millions | |
| Recent Price: 692.14 Smart Investing & Trading Score: 61 | |
| Day Percent Change: 0.11% Day Change: 0.76 | |
| Week Change: -1.16% Year-to-date Change: 14.9% | |
| CTAS Links: Profile News Message Board | |
| Charts:- Daily , Weekly | |
| Add CTAS to Watchlist: View: Get Complete CTAS Trend Analysis ➞ | |
 | ADBE Adobe Inc. |
| Sector: Technology | |
| SubSector: Application Software | |
| MarketCap: 157868 Millions | |
| Recent Price: 483.43 Smart Investing & Trading Score: 47 | |
| Day Percent Change: 0.11% Day Change: 0.55 | |
| Week Change: 0.24% Year-to-date Change: -19.0% | |
| ADBE Links: Profile News Message Board | |
| Charts:- Daily , Weekly | |
| Add ADBE to Watchlist: View: Get Complete ADBE Trend Analysis ➞ | |
 | MCHP Microchip Technology Incorporated |
| Sector: Technology | |
| SubSector: Semiconductor - Broad Line | |
| MarketCap: 16826.3 Millions | |
| Recent Price: 94.33 Smart Investing & Trading Score: 76 | |
| Day Percent Change: 0.10% Day Change: 0.09 | |
| Week Change: 3.09% Year-to-date Change: 4.6% | |
| MCHP Links: Profile News Message Board | |
| Charts:- Daily , Weekly | |
| Add MCHP to Watchlist: View: Get Complete MCHP Trend Analysis ➞ | |
 | PCAR PACCAR Inc |
| Sector: Consumer Staples | |
| SubSector: Trucks & Other Vehicles | |
| MarketCap: 19117.7 Millions | |
| Recent Price: 106.00 Smart Investing & Trading Score: 7 | |
| Day Percent Change: 0.07% Day Change: 0.07 | |
| Week Change: -2.91% Year-to-date Change: 8.6% | |
| PCAR Links: Profile News Message Board | |
| Charts:- Daily , Weekly | |
| Add PCAR to Watchlist: View: Get Complete PCAR Trend Analysis ➞ | |
 | VRSK Verisk Analytics, Inc. |
| Sector: Services & Goods | |
| SubSector: Business Services | |
| MarketCap: 22033.2 Millions | |
| Recent Price: 251.62 Smart Investing & Trading Score: 90 | |
| Day Percent Change: 0.06% Day Change: 0.14 | |
| Week Change: 1.33% Year-to-date Change: 5.3% | |
| VRSK Links: Profile News Message Board | |
| Charts:- Daily , Weekly | |
| Add VRSK to Watchlist: View: Get Complete VRSK Trend Analysis ➞ | |
 | ANSS ANSYS, Inc. |
| Sector: Technology | |
| SubSector: Application Software | |
| MarketCap: 19497.4 Millions | |
| Recent Price: 327.71 Smart Investing & Trading Score: 25 | |
| Day Percent Change: 0.05% Day Change: 0.18 | |
| Week Change: -0.16% Year-to-date Change: -9.7% | |
| ANSS Links: Profile News Message Board | |
| Charts:- Daily , Weekly | |
| Add ANSS to Watchlist: View: Get Complete ANSS Trend Analysis ➞ | |
 | AAPL Apple Inc. |
| Sector: Technology | |
| SubSector: Electronic Equipment | |
| MarketCap: 1112940 Millions | |
| Recent Price: 189.87 Smart Investing & Trading Score: 83 | |
| Day Percent Change: 0.05% Day Change: 0.09 | |
| Week Change: 3.73% Year-to-date Change: -1.4% | |
| AAPL Links: Profile News Message Board | |
| Charts:- Daily , Weekly | |
| Add AAPL to Watchlist: View: Get Complete AAPL Trend Analysis ➞ | |
 | MNST Monster Beverage Corporation |
| Sector: Consumer Staples | |
| SubSector: Beverages - Soft Drinks | |
| MarketCap: 30126.8 Millions | |
| Recent Price: 54.11 Smart Investing & Trading Score: 40 | |
| Day Percent Change: 0.04% Day Change: 0.02 | |
| Week Change: -2.43% Year-to-date Change: -6.1% | |
| MNST Links: Profile News Message Board | |
| Charts:- Daily , Weekly | |
| Add MNST to Watchlist: View: Get Complete MNST Trend Analysis ➞ | |
 | TXN Texas Instruments Incorporated |
| Sector: Technology | |
| SubSector: Semiconductor - Broad Line | |
| MarketCap: 99509.1 Millions | |
| Recent Price: 195.02 Smart Investing & Trading Score: 90 | |
| Day Percent Change: 0.03% Day Change: 0.05 | |
| Week Change: 4.26% Year-to-date Change: 14.4% | |
| TXN Links: Profile News Message Board | |
| Charts:- Daily , Weekly | |
| Add TXN to Watchlist: View: Get Complete TXN Trend Analysis ➞ | |
 | ADI Analog Devices, Inc. |
| Sector: Technology | |
| SubSector: Semiconductor - Integrated Circuits | |
| MarketCap: 32859 Millions | |
| Recent Price: 214.08 Smart Investing & Trading Score: 83 | |
| Day Percent Change: -0.02% Day Change: -0.04 | |
| Week Change: 3.33% Year-to-date Change: 7.8% | |
| ADI Links: Profile News Message Board | |
| Charts:- Daily , Weekly | |
| Add ADI to Watchlist: View: Get Complete ADI Trend Analysis ➞ | |
 | CDNS Cadence Design Systems, Inc. |
| Sector: Technology | |
| SubSector: Application Software | |
| MarketCap: 16865.8 Millions | |
| Recent Price: 288.81 Smart Investing & Trading Score: 52 | |
| Day Percent Change: -0.04% Day Change: -0.12 | |
| Week Change: 0.46% Year-to-date Change: 6.0% | |
| CDNS Links: Profile News Message Board | |
| Charts:- Daily , Weekly | |
| Add CDNS to Watchlist: View: Get Complete CDNS Trend Analysis ➞ | |
 | EXC Exelon Corporation |
| Sector: Utilities | |
| SubSector: Diversified Utilities | |
| MarketCap: 34091.9 Millions | |
| Recent Price: 38.58 Smart Investing & Trading Score: 76 | |
| Day Percent Change: -0.10% Day Change: -0.04 | |
| Week Change: 2.42% Year-to-date Change: 7.5% | |
| EXC Links: Profile News Message Board | |
| Charts:- Daily , Weekly | |
| Add EXC to Watchlist: View: Get Complete EXC Trend Analysis ➞ | |
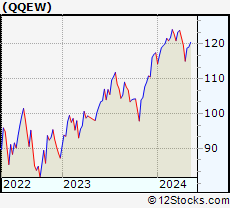 | QQEW First Trust NASDAQ-100 Equal Wtd ETF |
| Sector: Utilities | |
| SubSector: Exchange Traded Fund | |
| MarketCap: 0 Millions | |
| Recent Price: 122.69 Smart Investing & Trading Score: 70 | |
| Day Percent Change: -0.13% Day Change: -0.16 | |
| Week Change: 1.85% Year-to-date Change: 4.5% | |
| QQEW Links: Profile News Message Board | |
| Charts:- Daily , Weekly | |
| Add QQEW to Watchlist: View: Get Complete QQEW Trend Analysis ➞ | |
 | CPRT Copart, Inc. |
| Sector: Services & Goods | |
| SubSector: Auto Dealerships | |
| MarketCap: 15462.1 Millions | |
| Recent Price: 54.50 Smart Investing & Trading Score: 34 | |
| Day Percent Change: -0.15% Day Change: -0.08 | |
| Week Change: -0.44% Year-to-date Change: 11.2% | |
| CPRT Links: Profile News Message Board | |
| Charts:- Daily , Weekly | |
| Add CPRT to Watchlist: View: Get Complete CPRT Trend Analysis ➞ | |
 | AZN AstraZeneca PLC |
| Sector: Health Care | |
| SubSector: Drug Manufacturers - Major | |
| MarketCap: 113154 Millions | |
| Recent Price: 76.90 Smart Investing & Trading Score: 71 | |
| Day Percent Change: -0.18% Day Change: -0.14 | |
| Week Change: -0.36% Year-to-date Change: 14.2% | |
| AZN Links: Profile News Message Board | |
| Charts:- Daily , Weekly | |
| Add AZN to Watchlist: View: Get Complete AZN Trend Analysis ➞ | |
 | MSFT Microsoft Corporation |
| Sector: Technology | |
| SubSector: Business Software & Services | |
| MarketCap: 1154150 Millions | |
| Recent Price: 420.21 Smart Investing & Trading Score: 78 | |
| Day Percent Change: -0.19% Day Change: -0.78 | |
| Week Change: 1.32% Year-to-date Change: 11.8% | |
| MSFT Links: Profile News Message Board | |
| Charts:- Daily , Weekly | |
| Add MSFT to Watchlist: View: Get Complete MSFT Trend Analysis ➞ | |
 | KHC The Kraft Heinz Company |
| Sector: Consumer Staples | |
| SubSector: Food - Major Diversified | |
| MarketCap: 32096.3 Millions | |
| Recent Price: 36.00 Smart Investing & Trading Score: 51 | |
| Day Percent Change: -0.19% Day Change: -0.07 | |
| Week Change: -0.66% Year-to-date Change: -2.7% | |
| KHC Links: Profile News Message Board | |
| Charts:- Daily , Weekly | |
| Add KHC to Watchlist: View: Get Complete KHC Trend Analysis ➞ | |
 | GILD Gilead Sciences, Inc. |
| Sector: Health Care | |
| SubSector: Biotechnology | |
| MarketCap: 99485.6 Millions | |
| Recent Price: 67.72 Smart Investing & Trading Score: 45 | |
| Day Percent Change: -0.21% Day Change: -0.14 | |
| Week Change: 2.67% Year-to-date Change: -16.4% | |
| GILD Links: Profile News Message Board | |
| Charts:- Daily , Weekly | |
| Add GILD to Watchlist: View: Get Complete GILD Trend Analysis ➞ | |
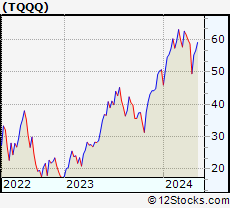 | TQQQ ProShares UltraPro QQQ |
| Sector: Utilities | |
| SubSector: Exchange Traded Fund | |
| MarketCap: 0 Millions | |
| Recent Price: 62.94 Smart Investing & Trading Score: 78 | |
| Day Percent Change: -0.22% Day Change: -0.14 | |
| Week Change: 6.37% Year-to-date Change: 24.1% | |
| TQQQ Links: Profile News Message Board | |
| Charts:- Daily , Weekly | |
| Add TQQQ to Watchlist: View: Get Complete TQQQ Trend Analysis ➞ | |
 | CDW CDW Corporation |
| Sector: Technology | |
| SubSector: Information Technology Services | |
| MarketCap: 12775 Millions | |
| Recent Price: 223.64 Smart Investing & Trading Score: 39 | |
| Day Percent Change: -0.22% Day Change: -0.50 | |
| Week Change: 0.53% Year-to-date Change: -1.6% | |
| CDW Links: Profile News Message Board | |
| Charts:- Daily , Weekly | |
| Add CDW to Watchlist: View: Get Complete CDW Trend Analysis ➞ | |
 | KLAC KLA Corporation |
| Sector: Technology | |
| SubSector: Semiconductor Equipment & Materials | |
| MarketCap: 20663.8 Millions | |
| Recent Price: 747.68 Smart Investing & Trading Score: 83 | |
| Day Percent Change: -0.24% Day Change: -1.80 | |
| Week Change: 4.09% Year-to-date Change: 28.6% | |
| KLAC Links: Profile News Message Board | |
| Charts:- Daily , Weekly | |
| Add KLAC to Watchlist: View: Get Complete KLAC Trend Analysis ➞ | |
 | CMCSA Comcast Corporation |
| Sector: Services & Goods | |
| SubSector: Entertainment - Diversified | |
| MarketCap: 164849 Millions | |
| Recent Price: 39.27 Smart Investing & Trading Score: 32 | |
| Day Percent Change: -0.25% Day Change: -0.10 | |
| Week Change: -0.1% Year-to-date Change: -10.4% | |
| CMCSA Links: Profile News Message Board | |
| Charts:- Daily , Weekly | |
| Add CMCSA to Watchlist: View: Get Complete CMCSA Trend Analysis ➞ | |
 | ZS Zscaler, Inc. |
| Sector: Technology | |
| SubSector: Security Software & Services | |
| MarketCap: 7532.17 Millions | |
| Recent Price: 178.86 Smart Investing & Trading Score: 52 | |
| Day Percent Change: -0.25% Day Change: -0.45 | |
| Week Change: 2.61% Year-to-date Change: -19.3% | |
| ZS Links: Profile News Message Board | |
| Charts:- Daily , Weekly | |
| Add ZS to Watchlist: View: Get Complete ZS Trend Analysis ➞ | |
 | META Meta Platforms, Inc. |
| Sector: Technology | |
| SubSector: Internet Content & Information | |
| MarketCap: 732990 Millions | |
| Recent Price: 471.91 Smart Investing & Trading Score: 33 | |
| Day Percent Change: -0.28% Day Change: -1.32 | |
| Week Change: -0.9% Year-to-date Change: 33.3% | |
| META Links: Profile News Message Board | |
| Charts:- Daily , Weekly | |
| Add META to Watchlist: View: Get Complete META Trend Analysis ➞ | |
 | HON Honeywell International Inc. |
| Sector: Industrials | |
| SubSector: Diversified Machinery | |
| MarketCap: 91189.1 Millions | |
| Recent Price: 205.97 Smart Investing & Trading Score: 90 | |
| Day Percent Change: -0.31% Day Change: -0.65 | |
| Week Change: 1.5% Year-to-date Change: -1.8% | |
| HON Links: Profile News Message Board | |
| Charts:- Daily , Weekly | |
| Add HON to Watchlist: View: Get Complete HON Trend Analysis ➞ | |
 | CSCO Cisco Systems, Inc. |
| Sector: Technology | |
| SubSector: Communication Equipment | |
| MarketCap: 168483 Millions | |
| Recent Price: 48.17 Smart Investing & Trading Score: 38 | |
| Day Percent Change: -0.35% Day Change: -0.17 | |
| Week Change: 0.23% Year-to-date Change: -4.7% | |
| CSCO Links: Profile News Message Board | |
| Charts:- Daily , Weekly | |
| Add CSCO to Watchlist: View: Get Complete CSCO Trend Analysis ➞ | |
 | DXCM DexCom, Inc. |
| Sector: Health Care | |
| SubSector: Medical Laboratories & Research | |
| MarketCap: 19559 Millions | |
| Recent Price: 131.36 Smart Investing & Trading Score: 100 | |
| Day Percent Change: -0.42% Day Change: -0.55 | |
| Week Change: 3.39% Year-to-date Change: 5.9% | |
| DXCM Links: Profile News Message Board | |
| Charts:- Daily , Weekly | |
| Add DXCM to Watchlist: View: Get Complete DXCM Trend Analysis ➞ | |
 | GFS GLOBALFOUNDRIES Inc. |
| Sector: Technology | |
| SubSector: Semiconductors | |
| MarketCap: 35570 Millions | |
| Recent Price: 53.95 Smart Investing & Trading Score: 35 | |
| Day Percent Change: -0.42% Day Change: -0.23 | |
| Week Change: 5.6% Year-to-date Change: -10.8% | |
| GFS Links: Profile News Message Board | |
| Charts:- Daily , Weekly | |
| Add GFS to Watchlist: View: Get Complete GFS Trend Analysis ➞ | |
| For tabular summary view of above stock list: Summary View ➞ 0 - 30 , 30 - 60 , 60 - 90 , 90 - 120 | ||
| Click To Change The Sort Order: By Market Cap or Company Size Performance: Year-to-date, Week and Day | |
| Select Chart Type: | ||
|
Best Stocks Today 12Stocks.com |
© 2024 12Stocks.com Terms & Conditions Privacy Contact Us
All Information Provided Only For Education And Not To Be Used For Investing or Trading. See Terms & Conditions


One More Thing ... Get Best Stocks Delivered Daily!
Never Ever Miss A Move With Our Top Ten Stocks Lists
Find Best Stocks In Any Market - Bull or Bear Market
Take A Peek At Our Top Ten Stocks Lists: Daily, Weekly, Year-to-Date & Top Trends
Find Best Stocks In Any Market - Bull or Bear Market
Take A Peek At Our Top Ten Stocks Lists: Daily, Weekly, Year-to-Date & Top Trends
Nasdaq 100 Stocks With Best Up Trends [0-bearish to 100-bullish]: Pinduoduo [100], Baker Hughes[100], Google [100], Google [100], Paychex [100], DexCom [100], CrowdStrike [95], Trade Desk[95], Vertex [95], Palo Alto[95], Moderna [95]
Best Nasdaq 100 Stocks Year-to-Date:
NVIDIA [86.74%], Constellation Energy[81.97%], Micron [46.81%], CrowdStrike [35.49%], QUALCOMM [34.04%], Moderna [33.63%], Meta Platforms[33.3%], Trade Desk[31.71%], Applied Materials[30.86%], KLA [28.62%], Netflix [27.57%] Best Nasdaq 100 Stocks This Week:
Moderna [11.23%], Trade Desk[8.62%], Advanced Micro[8.26%], CrowdStrike [7.73%], Palo Alto[6.85%], Intel [6.63%], IDEXX [6.6%], Pinduoduo [6.56%], QUALCOMM [6.47%], UltraPro[6.37%], Walgreens Boots[5.76%] Best Nasdaq 100 Stocks Daily:
Starbucks [3.41%], CrowdStrike [2.03%], Pinduoduo [1.96%], Netflix [1.73%], Trade Desk[1.71%], Diamondback Energy[1.58%], Tesla [1.50%], Regeneron [1.48%], Baker Hughes[1.33%], Take-Two Interactive[1.20%], Intuit [1.20%]