
 Login Sign Up


| |||||
 |  | ||||

| 12Stocks.com Market Intelligence |
Best MidCap Stocks
|
| In a hurry? Mid Cap Stocks Lists: Performance Trends Table, Stock Charts
Sort midcap stocks: Daily, Weekly, Year-to-Date, Market Cap & Trends. Filter midcap stocks list by sector: Show all, Tech, Finance, Energy, Staples, Retail, Industrial, Materials, Utilities and HealthCare Filter midcap stocks list by size:All MidCap Large Mid-Range Small |
| 12Stocks.com Mid Cap Stocks Performances & Trends Daily | |||||||||
|
|  The overall Smart Investing & Trading Score is 70 (0-bearish to 100-bullish) which puts Mid Cap index in short term neutral to bullish trend. The Smart Investing & Trading Score from previous trading session is 56 and hence an improvement of trend.
| ||||||||
Here are the Smart Investing & Trading Scores of the most requested mid cap stocks at 12Stocks.com (click stock name for detailed review):
|


| 12Stocks.com: Top Performing Mid Cap Index Stocks | ||||||||||||||||||||||||||||||||||||||||||||||||
 The top performing Mid Cap Index stocks year to date are
Now, more recently, over last week, the top performing Mid Cap Index stocks on the move are


|
||||||||||||||||||||||||||||||||||||||||||||||||
| 12Stocks.com: Investing in Midcap Index with Stocks | |
|
The following table helps investors and traders sort through current performance and trends (as measured by Smart Investing & Trading Score) of various
stocks in the Midcap Index. Quick View: Move mouse or cursor over stock symbol (ticker) to view short-term technical chart and over stock name to view long term chart. Click on  to add stock symbol to your watchlist and to add stock symbol to your watchlist and  to view watchlist. Click on any ticker or stock name for detailed market intelligence report for that stock. to view watchlist. Click on any ticker or stock name for detailed market intelligence report for that stock. |
12Stocks.com Performance of Stocks in Midcap Index
| Ticker | Stock Name | Watchlist | Category | Recent Price | Smart Investing & Trading Score | Change % | YTD Change% |
| AWI | Armstrong World |   | Industrials | 118.97 | 85 | 1.70% | 21.00% |
| EME | EMCOR | | Industrials | 364.44 | 90 | 2.94% | 69.17% |
| AGCO | AGCO | | Industrials | 119.55 | 47 | 2.52% | -1.53% |
| SEB | Seaboard | | Industrials | 3296.05 | 47 | 2.77% | -7.68% |
| RYN | Rayonier | | Industrials | 30.02 | 38 | -0.48% | -10.16% |
| DAR | Darling Ingredients | | Industrials | 44.17 | 88 | -1.11% | -11.37% |
| MIDD | Middleby | | Industrials | 142.24 | 23 | 0.70% | -3.35% |
| FLS | Flowserve | | Industrials | 47.05 | 83 | 0.62% | 14.14% |
| HXL | Hexcel | | Industrials | 65.22 | 64 | 1.64% | -11.57% |
| SITE | SiteOne Landscape | | Industrials | 161.99 | 51 | -0.34% | -0.32% |
| CR | Crane Co | | Industrials | 143.65 | 93 | -0.48% | 21.59% |
| HAYW | Hayward | | Industrials | 13.96 | 46 | 1.34% | 2.53% |
| MTZ | MasTec | | Industrials | 90.15 | 90 | 1.25% | 19.06% |
| BLD | TopBuild | | Industrials | 412.34 | 70 | 1.29% | 10.17% |
| CLH | Clean Harbors | | Industrials | 194.38 | 48 | 0.19% | 11.38% |
| SPR | Spirit Aero | | Industrials | 32.50 | 68 | 0.03% | 2.27% |
| TOL | Toll Brothers | | Industrials | 121.69 | 85 | 1.22% | 18.39% |
| TKR | Timken | | Industrials | 86.41 | 75 | 1.68% | 7.81% |
| VMI | Valmont Industries | | Industrials | 210.59 | 27 | 0.29% | -9.82% |
| EXP | Eagle Materials | | Industrials | 257.60 | 85 | 0.35% | 26.99% |
| GTES | Gates Industrial | | Industrials | 17.72 | 83 | 0.00% | 32.04% |
| BLDR | Builders FirstSource | | Industrials | 187.28 | 58 | -0.20% | 12.18% |
| PLUG | Plug Power | | Industrials | 2.42 | 42 | 0.41% | -46.22% |
| For chart view version of above stock list: Chart View ➞ 0 - 25 , 25 - 50 , 50 - 75 | ||
 | Click To Change The Sort Order: By Market Cap or Company Size Performance: Year-to-date, Week and Day |  |
|
Get the most comprehensive stock market coverage daily at 12Stocks.com ➞ Best Stocks Today ➞ Best Stocks Weekly ➞ Best Stocks Year-to-Date ➞ Best Stocks Trends ➞  Best Stocks Today 12Stocks.com Best Nasdaq Stocks ➞ Best S&P 500 Stocks ➞ Best Tech Stocks ➞ Best Biotech Stocks ➞ |
| Detailed Overview of Midcap Stocks |
| Midcap Technical Overview, Leaders & Laggards, Top Midcap ETF Funds & Detailed Midcap Stocks List, Charts, Trends & More |
| Midcap: Technical Analysis, Trends & YTD Performance | |
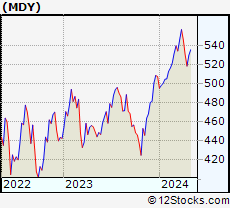
| MidCap segment as represented by
MDY, an exchange-traded fund [ETF], holds basket of about four hundred midcap stocks from across all major sectors of the US stock market. The midcap index (contains stocks like Green Mountain Coffee Roasters and Tractor Supply Company) is up by 4.92% and is currently underperforming the overall market by -1.37% year-to-date. Below is a quick view of technical charts and trends: | |
 MDY Weekly Chart |
|
| Long Term Trend: Very Good | |
| Medium Term Trend: Good | |
 MDY Daily Chart |
|
| Short Term Trend: Very Good | |
| Overall Trend Score: 70 | |
| YTD Performance: 4.92% | |
| **Trend Scores & Views Are Only For Educational Purposes And Not For Investing | |
| 12Stocks.com: Investing in Midcap Index using Exchange Traded Funds | |
|
The following table shows list of key exchange traded funds (ETF) that
help investors track Midcap index. The following list also includes leveraged ETF funds that track twice or thrice the daily returns of Midcap indices. Short or inverse ETF funds move in the opposite direction to the index they track and are useful during market pullbacks or during bear markets. Quick View: Move mouse or cursor over ETF symbol (ticker) to view short-term technical chart and over ETF name to view long term chart. Click on ticker or stock name for detailed view. Click on to add stock symbol to your watchlist and to view watchlist. |
12Stocks.com List of ETFs that track Midcap Index
| Ticker | ETF Name | Watchlist | Recent Price | Smart Investing & Trading Score | Change % | Week % | Year-to-date % |
| IWR | iShares Russell Mid-Cap | | 80.94 | 75 | 0.52 | 0.52 | 4.12% |
| IJH | iShares Core S&P Mid-Cap | | 58.08 | 75 | 0.44 | 0.44 | 4.77% |
| IWP | iShares Russell Mid-Cap Growth | | 109.38 | 78 | 0.37 | 0.37 | 4.71% |
| MDY | SPDR S&P MidCap 400 ETF | | 532.34 | 70 | 0.56 | 0.56 | 4.92% |
| IWS | iShares Russell Mid-Cap Value | | 120.78 | 75 | 0.66 | 0.66 | 3.86% |
| IJK | iShares S&P Mid-Cap 400 Growth | | 87.42 | 70 | 0.48 | 0.48 | 10.35% |
| IJJ | iShares S&P Mid-Cap 400 Value | | 113.04 | 88 | 0.72 | 0.72 | -0.88% |
| UMDD | ProShares UltraPro MidCap400 | | 24.45 | 78 | 2.05 | 2.05 | 9.55% |
| XMLV | PowerShares S&P MidCap Low Volatil ETF | | 54.95 | 83 | 0.54 | 0.54 | 3.32% |
| SMDD | ProShares UltraPro Short MidCap400 | | 11.57 | 10 | -2.20 | -2.2 | -14.07% |
| MYY | ProShares Short MidCap400 | | 20.64 | 25 | -0.72 | -0.72 | -3.8% |
| MZZ | ProShares UltraShort MidCap400 | | 11.58 | 27 | -0.86 | -0.86 | -7.88% |
| MVV | ProShares Ultra MidCap400 | | 62.18 | 83 | 1.22 | 1.22 | 7.41% |
| 12Stocks.com: Charts, Trends, Fundamental Data and Performances of MidCap Stocks | |
|
We now take in-depth look at all MidCap stocks including charts, multi-period performances and overall trends (as measured by Smart Investing & Trading Score). One can sort MidCap stocks (click link to choose) by Daily, Weekly and by Year-to-Date performances. Also, one can sort by size of the company or by market capitalization. |
| Select Your Default Chart Type: | |||||
| |||||
| Click on stock symbol or name for detailed view. Click on to add stock symbol to your watchlist and to view watchlist. Quick View: Move mouse or cursor over "Daily" to quickly view daily technical stock chart and over "Weekly" to view weekly technical stock chart. | |||||

 | AWI Armstrong World Industries, Inc. |
| Sector: Industrials | |
| SubSector: General Building Materials | |
| MarketCap: 3609.53 Millions | |
| Recent Price: 118.97 Smart Investing & Trading Score: 85 | |
| Day Percent Change: 1.70% Day Change: 1.99 | |
| Week Change: 1.7% Year-to-date Change: 21.0% | |
| AWI Links: Profile News Message Board | |
| Charts:- Daily , Weekly | |
| Add AWI to Watchlist: View: Get Complete AWI Trend Analysis ➞ | |
 | EME EMCOR Group, Inc. |
| Sector: Industrials | |
| SubSector: General Contractors | |
| MarketCap: 3417.83 Millions | |
| Recent Price: 364.44 Smart Investing & Trading Score: 90 | |
| Day Percent Change: 2.94% Day Change: 10.42 | |
| Week Change: 2.94% Year-to-date Change: 69.2% | |
| EME Links: Profile News Message Board | |
| Charts:- Daily , Weekly | |
| Add EME to Watchlist: View: Get Complete EME Trend Analysis ➞ | |
 | AGCO AGCO Corporation |
| Sector: Industrials | |
| SubSector: Farm & Construction Machinery | |
| MarketCap: 3399.57 Millions | |
| Recent Price: 119.55 Smart Investing & Trading Score: 47 | |
| Day Percent Change: 2.52% Day Change: 2.94 | |
| Week Change: 2.52% Year-to-date Change: -1.5% | |
| AGCO Links: Profile News Message Board | |
| Charts:- Daily , Weekly | |
| Add AGCO to Watchlist: View: Get Complete AGCO Trend Analysis ➞ | |
 | SEB Seaboard Corporation |
| Sector: Industrials | |
| SubSector: Conglomerates | |
| MarketCap: 3161.78 Millions | |
| Recent Price: 3296.05 Smart Investing & Trading Score: 47 | |
| Day Percent Change: 2.77% Day Change: 88.83 | |
| Week Change: 2.77% Year-to-date Change: -7.7% | |
| SEB Links: Profile News Message Board | |
| Charts:- Daily , Weekly | |
| Add SEB to Watchlist: View: Get Complete SEB Trend Analysis ➞ | |
 | RYN Rayonier Inc. |
| Sector: Industrials | |
| SubSector: Lumber, Wood Production | |
| MarketCap: 3143 Millions | |
| Recent Price: 30.02 Smart Investing & Trading Score: 38 | |
| Day Percent Change: -0.48% Day Change: -0.14 | |
| Week Change: -0.48% Year-to-date Change: -10.2% | |
| RYN Links: Profile News Message Board | |
| Charts:- Daily , Weekly | |
| Add RYN to Watchlist: View: Get Complete RYN Trend Analysis ➞ | |
 | DAR Darling Ingredients Inc. |
| Sector: Industrials | |
| SubSector: Waste Management | |
| MarketCap: 3075.28 Millions | |
| Recent Price: 44.17 Smart Investing & Trading Score: 88 | |
| Day Percent Change: -1.11% Day Change: -0.50 | |
| Week Change: -1.11% Year-to-date Change: -11.4% | |
| DAR Links: Profile News Message Board | |
| Charts:- Daily , Weekly | |
| Add DAR to Watchlist: View: Get Complete DAR Trend Analysis ➞ | |
 | MIDD The Middleby Corporation |
| Sector: Industrials | |
| SubSector: Diversified Machinery | |
| MarketCap: 3070.36 Millions | |
| Recent Price: 142.24 Smart Investing & Trading Score: 23 | |
| Day Percent Change: 0.70% Day Change: 0.99 | |
| Week Change: 0.7% Year-to-date Change: -3.4% | |
| MIDD Links: Profile News Message Board | |
| Charts:- Daily , Weekly | |
| Add MIDD to Watchlist: View: Get Complete MIDD Trend Analysis ➞ | |
 | FLS Flowserve Corporation |
| Sector: Industrials | |
| SubSector: Diversified Machinery | |
| MarketCap: 2974.66 Millions | |
| Recent Price: 47.05 Smart Investing & Trading Score: 83 | |
| Day Percent Change: 0.62% Day Change: 0.29 | |
| Week Change: 0.62% Year-to-date Change: 14.1% | |
| FLS Links: Profile News Message Board | |
| Charts:- Daily , Weekly | |
| Add FLS to Watchlist: View: Get Complete FLS Trend Analysis ➞ | |
 | HXL Hexcel Corporation |
| Sector: Industrials | |
| SubSector: Aerospace/Defense Products & Services | |
| MarketCap: 2905.51 Millions | |
| Recent Price: 65.22 Smart Investing & Trading Score: 64 | |
| Day Percent Change: 1.64% Day Change: 1.06 | |
| Week Change: 1.64% Year-to-date Change: -11.6% | |
| HXL Links: Profile News Message Board | |
| Charts:- Daily , Weekly | |
| Add HXL to Watchlist: View: Get Complete HXL Trend Analysis ➞ | |
 | SITE SiteOne Landscape Supply, Inc. |
| Sector: Industrials | |
| SubSector: Small Tools & Accessories | |
| MarketCap: 2733.56 Millions | |
| Recent Price: 161.99 Smart Investing & Trading Score: 51 | |
| Day Percent Change: -0.34% Day Change: -0.55 | |
| Week Change: -0.34% Year-to-date Change: -0.3% | |
| SITE Links: Profile News Message Board | |
| Charts:- Daily , Weekly | |
| Add SITE to Watchlist: View: Get Complete SITE Trend Analysis ➞ | |
 | CR Crane Co. |
| Sector: Industrials | |
| SubSector: Diversified Machinery | |
| MarketCap: 2715.16 Millions | |
| Recent Price: 143.65 Smart Investing & Trading Score: 93 | |
| Day Percent Change: -0.48% Day Change: -0.70 | |
| Week Change: -0.48% Year-to-date Change: 21.6% | |
| CR Links: Profile News Message Board | |
| Charts:- Daily , Weekly | |
| Add CR to Watchlist: View: Get Complete CR Trend Analysis ➞ | |
 | HAYW Hayward Holdings, Inc. |
| Sector: Industrials | |
| SubSector: Electrical Equipment & Parts | |
| MarketCap: 2670 Millions | |
| Recent Price: 13.96 Smart Investing & Trading Score: 46 | |
| Day Percent Change: 1.34% Day Change: 0.19 | |
| Week Change: 1.34% Year-to-date Change: 2.5% | |
| HAYW Links: Profile News Message Board | |
| Charts:- Daily , Weekly | |
| Add HAYW to Watchlist: View: Get Complete HAYW Trend Analysis ➞ | |
 | MTZ MasTec, Inc. |
| Sector: Industrials | |
| SubSector: Heavy Construction | |
| MarketCap: 2596.95 Millions | |
| Recent Price: 90.15 Smart Investing & Trading Score: 90 | |
| Day Percent Change: 1.25% Day Change: 1.11 | |
| Week Change: 1.25% Year-to-date Change: 19.1% | |
| MTZ Links: Profile News Message Board | |
| Charts:- Daily , Weekly | |
| Add MTZ to Watchlist: View: Get Complete MTZ Trend Analysis ➞ | |
 | BLD TopBuild Corp. |
| Sector: Industrials | |
| SubSector: General Building Materials | |
| MarketCap: 2534.53 Millions | |
| Recent Price: 412.34 Smart Investing & Trading Score: 70 | |
| Day Percent Change: 1.29% Day Change: 5.26 | |
| Week Change: 1.29% Year-to-date Change: 10.2% | |
| BLD Links: Profile News Message Board | |
| Charts:- Daily , Weekly | |
| Add BLD to Watchlist: View: Get Complete BLD Trend Analysis ➞ | |
 | CLH Clean Harbors, Inc. |
| Sector: Industrials | |
| SubSector: Waste Management | |
| MarketCap: 2391.28 Millions | |
| Recent Price: 194.38 Smart Investing & Trading Score: 48 | |
| Day Percent Change: 0.19% Day Change: 0.38 | |
| Week Change: 0.19% Year-to-date Change: 11.4% | |
| CLH Links: Profile News Message Board | |
| Charts:- Daily , Weekly | |
| Add CLH to Watchlist: View: Get Complete CLH Trend Analysis ➞ | |
 | SPR Spirit AeroSystems Holdings, Inc. |
| Sector: Industrials | |
| SubSector: Aerospace/Defense Products & Services | |
| MarketCap: 2283.01 Millions | |
| Recent Price: 32.50 Smart Investing & Trading Score: 68 | |
| Day Percent Change: 0.03% Day Change: 0.01 | |
| Week Change: 0.03% Year-to-date Change: 2.3% | |
| SPR Links: Profile News Message Board | |
| Charts:- Daily , Weekly | |
| Add SPR to Watchlist: View: Get Complete SPR Trend Analysis ➞ | |
 | TOL Toll Brothers, Inc. |
| Sector: Industrials | |
| SubSector: Residential Construction | |
| MarketCap: 2278.26 Millions | |
| Recent Price: 121.69 Smart Investing & Trading Score: 85 | |
| Day Percent Change: 1.22% Day Change: 1.47 | |
| Week Change: 1.22% Year-to-date Change: 18.4% | |
| TOL Links: Profile News Message Board | |
| Charts:- Daily , Weekly | |
| Add TOL to Watchlist: View: Get Complete TOL Trend Analysis ➞ | |
 | TKR The Timken Company |
| Sector: Industrials | |
| SubSector: Machine Tools & Accessories | |
| MarketCap: 2277.48 Millions | |
| Recent Price: 86.41 Smart Investing & Trading Score: 75 | |
| Day Percent Change: 1.68% Day Change: 1.43 | |
| Week Change: 1.68% Year-to-date Change: 7.8% | |
| TKR Links: Profile News Message Board | |
| Charts:- Daily , Weekly | |
| Add TKR to Watchlist: View: Get Complete TKR Trend Analysis ➞ | |
 | VMI Valmont Industries, Inc. |
| Sector: Industrials | |
| SubSector: Metal Fabrication | |
| MarketCap: 2251.6 Millions | |
| Recent Price: 210.59 Smart Investing & Trading Score: 27 | |
| Day Percent Change: 0.29% Day Change: 0.60 | |
| Week Change: 0.29% Year-to-date Change: -9.8% | |
| VMI Links: Profile News Message Board | |
| Charts:- Daily , Weekly | |
| Add VMI to Watchlist: View: Get Complete VMI Trend Analysis ➞ | |
 | EXP Eagle Materials Inc. |
| Sector: Industrials | |
| SubSector: Cement | |
| MarketCap: 2234.73 Millions | |
| Recent Price: 257.60 Smart Investing & Trading Score: 85 | |
| Day Percent Change: 0.35% Day Change: 0.90 | |
| Week Change: 0.35% Year-to-date Change: 27.0% | |
| EXP Links: Profile News Message Board | |
| Charts:- Daily , Weekly | |
| Add EXP to Watchlist: View: Get Complete EXP Trend Analysis ➞ | |
 | GTES Gates Industrial Corporation plc |
| Sector: Industrials | |
| SubSector: Diversified Machinery | |
| MarketCap: 2152.36 Millions | |
| Recent Price: 17.72 Smart Investing & Trading Score: 83 | |
| Day Percent Change: 0.00% Day Change: 0.00 | |
| Week Change: 0% Year-to-date Change: 32.0% | |
| GTES Links: Profile News Message Board | |
| Charts:- Daily , Weekly | |
| Add GTES to Watchlist: View: Get Complete GTES Trend Analysis ➞ | |
 | BLDR Builders FirstSource, Inc. |
| Sector: Industrials | |
| SubSector: General Building Materials | |
| MarketCap: 1714.63 Millions | |
| Recent Price: 187.28 Smart Investing & Trading Score: 58 | |
| Day Percent Change: -0.20% Day Change: -0.38 | |
| Week Change: -0.2% Year-to-date Change: 12.2% | |
| BLDR Links: Profile News Message Board | |
| Charts:- Daily , Weekly | |
| Add BLDR to Watchlist: View: Get Complete BLDR Trend Analysis ➞ | |
 | PLUG Plug Power Inc. |
| Sector: Industrials | |
| SubSector: Industrial Electrical Equipment | |
| MarketCap: 1233.09 Millions | |
| Recent Price: 2.42 Smart Investing & Trading Score: 42 | |
| Day Percent Change: 0.41% Day Change: 0.01 | |
| Week Change: 0.41% Year-to-date Change: -46.2% | |
| PLUG Links: Profile News Message Board | |
| Charts:- Daily , Weekly | |
| Add PLUG to Watchlist: View: Get Complete PLUG Trend Analysis ➞ | |
| For tabular summary view of above stock list: Summary View ➞ 0 - 25 , 25 - 50 , 50 - 75 | ||
| Click To Change The Sort Order: By Market Cap or Company Size Performance: Year-to-date, Week and Day | |
| Select Chart Type: | ||
|
Best Stocks Today 12Stocks.com |
© 2024 12Stocks.com Terms & Conditions Privacy Contact Us
All Information Provided Only For Education And Not To Be Used For Investing or Trading. See Terms & Conditions


One More Thing ... Get Best Stocks Delivered Daily!
Never Ever Miss A Move With Our Top Ten Stocks Lists
Find Best Stocks In Any Market - Bull or Bear Market
Take A Peek At Our Top Ten Stocks Lists: Daily, Weekly, Year-to-Date & Top Trends
Find Best Stocks In Any Market - Bull or Bear Market
Take A Peek At Our Top Ten Stocks Lists: Daily, Weekly, Year-to-Date & Top Trends
Midcap Stocks With Best Up Trends [0-bearish to 100-bullish]: Albemarle [100], Tandem Diabetes[100], Domino s[100], Quest Diagnostics[100], Skyworks Solutions[100], Carrier Global[100], Teradyne [100], LPL Financial[100], Aptar [100], United [100], Cirrus Logic[100]
Best Midcap Stocks Year-to-Date:
Vistra Energy[100.05%], AppLovin [81.61%], ShockWave Medical[73.32%], EMCOR [69.17%], CAVA [61.78%], Constellation Energy[61.4%], Spotify [53.34%], Wingstop [50.33%], Natera [49.98%], Antero Resources[49.78%], Pure Storage[47.04%] Best Midcap Stocks This Week:
Ginkgo Bioworks[16.85%], Hertz Global[8.26%], Albemarle [7.36%], Tandem Diabetes[7.07%], Vistra Energy[6%], Liberty SiriusXM[5.49%], Liberty SiriusXM[5.32%], Sunrun [5.25%], Domino s[5.08%], Sirius XM[4.8%], Medical Properties[4.66%] Best Midcap Stocks Daily:
Ginkgo Bioworks[16.85%], Hertz Global[8.26%], Albemarle [7.36%], Tandem Diabetes[7.07%], Vistra Energy[6.00%], Liberty SiriusXM[5.49%], Liberty SiriusXM[5.32%], Sunrun [5.25%], Domino s[5.08%], Sirius XM[4.80%], Medical Properties[4.66%]