
 Login Sign Up


| |||||
 |  | ||||

| 12Stocks.com Market Intelligence |
Best Healthcare Stocks
 | "Discover best trending healthcare stocks with 12Stocks.com." |
| - Subu Vdaygiri, Founder, 12Stocks.com |
| In a hurry? Healthcare Stocks Lists: Performance Trends Table, Stock Charts
Sort Healthcare stocks: Daily, Weekly, Year-to-Date, Market Cap & Trends. Filter Healthcare stocks list by size:All Healthcare Large Mid-Range Small |
| 12Stocks.com Healthcare Stocks Performances & Trends Daily | |||||||||
|
|  The overall Smart Investing & Trading Score is 38 (0-bearish to 100-bullish) which puts Healthcare sector in short term bearish to neutral trend. The Smart Investing & Trading Score from previous trading session is 52 and hence a deterioration of trend.
| ||||||||
Here are the Smart Investing & Trading Scores of the most requested Healthcare stocks at 12Stocks.com (click stock name for detailed review):
|


| 12Stocks.com: Investing in Healthcare sector with Stocks | |
|
The following table helps investors and traders sort through current performance and trends (as measured by Smart Investing & Trading Score) of various
stocks in the Healthcare sector. Quick View: Move mouse or cursor over stock symbol (ticker) to view short-term Technical chart and over stock name to view long term chart. Click on  to add stock symbol to your watchlist and to add stock symbol to your watchlist and  to view watchlist. Click on any ticker or stock name for detailed market intelligence report for that stock. to view watchlist. Click on any ticker or stock name for detailed market intelligence report for that stock. |
12Stocks.com Performance of Stocks in Healthcare Sector
| Ticker | Stock Name | Watchlist | Category | Recent Price | Smart Investing & Trading Score | Change % | Weekly Change% |
| ANVS | Annovis Bio |   | Biotechnology | 13.00 | 100 | 2.04% | 30.00% |
| BGNE | BeiGene | | Biotechnology | 148.56 | 49 | 3.08% | 14.70% |
| PRLD | Prelude | | Biotechnology | 4.05 | 63 | 3.58% | 13.45% |
| AZN | AstraZeneca | | Pharmaceutical | 75.03 | 100 | 5.38% | 9.45% |
| BSX | Boston Scientific | | Equipment | 73.26 | 100 | 0.48% | 8.81% |
| LNSR | LENSAR | | Medical Devices | 3.40 | 64 | 6.92% | 8.28% |
| SNY | Sanofi | | Pharmaceutical | 49.36 | 49 | 5.90% | 6.61% |
| PRAX | Praxis Precision | | Biotechnology | 49.59 | 71 | -2.90% | 6.13% |
| PYPD | PolyPid | | Biotechnology | 4.56 | 42 | 1.62% | 5.98% |
| GBIO | Generation Bio | | Biotechnology | 2.92 | 61 | -2.34% | 5.60% |
| DXCM | DexCom | | Laboratories | 138.01 | 80 | 0.10% | 5.58% |
| OM | Outset | | Medical Devices | 2.41 | 67 | -5.49% | 5.47% |
| DGX | Quest Diagnostics | | Laboratories | 135.42 | 93 | -1.55% | 5.43% |
| RPTX | Repare | | Biotechnology | 3.18 | 35 | -3.64% | 5.30% |
| PRFX | PainReform | | Drug Manufacturers Specialty & Generic | 0.86 | 32 | 1.90% | 5.02% |
| NVS | Novartis AG | | Pharmaceutical | 99.06 | 64 | 0.72% | 4.98% |
| TMO | Thermo Fisher | | Laboratories | 571.73 | 75 | -0.98% | 4.95% |
| PMVP | PMV | | Biotechnology | 1.70 | 59 | 0.59% | 4.94% |
| CALT | Calliditas | | Drug Manufacturers Specialty & Generic | 18.50 | 32 | 0.00% | 4.82% |
| MRNA | Moderna | | Biotechnology | 106.21 | 73 | -2.43% | 4.70% |
| ZTS | Zoetis | | Pharmaceutical | 153.36 | 42 | 1.64% | 4.68% |
| PASG | Passage Bio | | Biotechnology | 1.20 | 63 | -3.23% | 4.35% |
| BIIB | Biogen | | Biotechnology | 202.46 | 57 | 0.23% | 4.16% |
| ADTX | ADiTx | | Biotechnology | 2.51 | 17 | 10.57% | 4.15% |
| WAT | Waters | | Instruments | 308.35 | 25 | -0.61% | 4.14% |
| For chart view version of above stock list: Chart View ➞ 0 - 25 , 25 - 50 , 50 - 75 , 75 - 100 , 100 - 125 , 125 - 150 , 150 - 175 | ||
 | Click To Change The Sort Order: By Market Cap or Company Size Performance: Year-to-date, Week and Day |  |
|
Get the most comprehensive stock market coverage daily at 12Stocks.com ➞ Best Stocks Today ➞ Best Stocks Weekly ➞ Best Stocks Year-to-Date ➞ Best Stocks Trends ➞  Best Stocks Today 12Stocks.com Best Nasdaq Stocks ➞ Best S&P 500 Stocks ➞ Best Tech Stocks ➞ Best Biotech Stocks ➞ |
| Detailed Overview of Healthcare Stocks |
| Healthcare Technical Overview, Leaders & Laggards, Top Healthcare ETF Funds & Detailed Healthcare Stocks List, Charts, Trends & More |
| Healthcare Sector: Technical Analysis, Trends & YTD Performance | |
| Healthcare sector is composed of stocks
from pharmaceutical, biotech, diagnostics labs, insurance providers
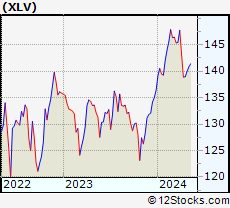
and healthcare services. Healthcare sector, as represented by XLV, an exchange-traded fund [ETF] that holds basket of Healthcare stocks (e.g, Merck, Amgen) is up by 2.6% and is currently underperforming the overall market by -2.56% year-to-date. Below is a quick view of Technical charts and trends: |
|
 XLV Weekly Chart |
|
| Long Term Trend: Not Good | |
| Medium Term Trend: Not Good | |
 XLV Daily Chart |
|
| Short Term Trend: Very Good | |
| Overall Trend Score: 38 | |
| YTD Performance: 2.6% | |
| **Trend Scores & Views Are Only For Educational Purposes And Not For Investing | |
| 12Stocks.com: Top Performing Healthcare Sector Stocks | ||||||||||||||||||||||||||||||||||||||||||||||||
 The top performing Healthcare sector stocks year to date are
Now, more recently, over last week, the top performing Healthcare sector stocks on the move are


|
||||||||||||||||||||||||||||||||||||||||||||||||
| 12Stocks.com: Investing in Healthcare Sector using Exchange Traded Funds | |
|
The following table shows list of key exchange traded funds (ETF) that
help investors track Healthcare Index. For detailed view, check out our ETF Funds section of our website. Quick View: Move mouse or cursor over ETF symbol (ticker) to view short-term Technical chart and over ETF name to view long term chart. Click on ticker or stock name for detailed view. Click on to add stock symbol to your watchlist and to view watchlist. |
12Stocks.com List of ETFs that track Healthcare Index
| Ticker | ETF Name | Watchlist | Recent Price | Smart Investing & Trading Score | Change % | Week % | Year-to-date % |
| XLV | Health Care | | 139.92 | 38 | -0.67 | 0.7 | 2.6% |
| XBI | Biotech | | 82.22 | 25 | -2.05 | -0.74 | -7.92% |
| IBB | Biotechnology | | 125.67 | 18 | -1.64 | 0.76 | -7.49% |
| BBH | Biotech | | 154.61 | 49 | -1.73 | 1.48 | -6.47% |
| VHT | Health Care | | 255.24 | 45 | -0.79 | 0.75 | 1.81% |
| IYH | Healthcare | | 58.68 | 45 | -0.69 | 0.89 | 2.5% |
| IHF | Healthcare Providers | | 52.11 | 55 | -0.29 | -0.19 | -0.76% |
| IHI | Medical Devices | | 55.27 | 43 | -0.66 | 1.67 | 2.41% |
| BIB | Biotechnology | | 48.83 | 32 | -2.69 | 1.31 | -14.41% |
| BIS | Short Biotech | | 20.59 | 61 | 2.49 | -1.46 | 13.95% |
| XHE | Health Care Equipment | | 81.77 | 28 | -1.73 | 0.62 | -2.96% |
| CURE | Healthcare Bull 3X | | 105.32 | 25 | -2.35 | 1.92 | 3.52% |
| LABU | Biotech Bull 3X | | 83.72 | 25 | -6.35 | -2.71 | -31.36% |
| LABD | Biotech Bear 3X | | 11.03 | 75 | 6.36 | 2.13 | 13.83% |
| PSCH | SmallCap Health Care | | 40.31 | 35 | -1.98 | 0.32 | -5.82% |
| XHS | Health Care Services | | 87.68 | 68 | -1.15 | 0.68 | -1.43% |
| PTH | DWA Healthcare Momentum | | 39.60 | 46 | -0.08 | 0.18 | 1.18% |
| BTEC | Principal Healthcare Innovators | | 34.21 | 32 | 0.02 | 1.04 | -5.83% |
| RXL | Health Care | | 94.52 | 17 | -1.55 | 1.39 | 3.41% |
| RXD | Short Health Care | | 11.46 | 71 | 0.98 | -1.59 | -3.94% |
| 12Stocks.com: Charts, Trends, Fundamental Data and Performances of Healthcare Stocks | |
|
We now take in-depth look at all Healthcare stocks including charts, multi-period performances and overall trends (as measured by Smart Investing & Trading Score). One can sort Healthcare stocks (click link to choose) by Daily, Weekly and by Year-to-Date performances. Also, one can sort by size of the company or by market capitalization. |
| Select Your Default Chart Type: | |||||
| |||||
| Click on stock symbol or name for detailed view. Click on to add stock symbol to your watchlist and to view watchlist. Quick View: Move mouse or cursor over "Daily" to quickly view daily Technical stock chart and over "Weekly" to view weekly Technical stock chart. | |||||

 | ANVS Annovis Bio, Inc. |
| Sector: Health Care | |
| SubSector: Biotechnology | |
| MarketCap: 41487 Millions | |
| Recent Price: 13.00 Smart Investing & Trading Score: 100 | |
| Day Percent Change: 2.04% Day Change: 0.26 | |
| Week Change: 30% Year-to-date Change: -30.5% | |
| ANVS Links: Profile News Message Board | |
| Charts:- Daily , Weekly | |
| Add ANVS to Watchlist: View: Get Complete ANVS Trend Analysis ➞ | |
 | BGNE BeiGene, Ltd. |
| Sector: Health Care | |
| SubSector: Biotechnology | |
| MarketCap: 10838.5 Millions | |
| Recent Price: 148.56 Smart Investing & Trading Score: 49 | |
| Day Percent Change: 3.08% Day Change: 4.44 | |
| Week Change: 14.7% Year-to-date Change: -17.6% | |
| BGNE Links: Profile News Message Board | |
| Charts:- Daily , Weekly | |
| Add BGNE to Watchlist: View: Get Complete BGNE Trend Analysis ➞ | |
 | PRLD Prelude Therapeutics Incorporated |
| Sector: Health Care | |
| SubSector: Biotechnology | |
| MarketCap: 26087 Millions | |
| Recent Price: 4.05 Smart Investing & Trading Score: 63 | |
| Day Percent Change: 3.58% Day Change: 0.14 | |
| Week Change: 13.45% Year-to-date Change: -6.9% | |
| PRLD Links: Profile News Message Board | |
| Charts:- Daily , Weekly | |
| Add PRLD to Watchlist: View: Get Complete PRLD Trend Analysis ➞ | |
 | AZN AstraZeneca PLC |
| Sector: Health Care | |
| SubSector: Drug Manufacturers - Major | |
| MarketCap: 113154 Millions | |
| Recent Price: 75.03 Smart Investing & Trading Score: 100 | |
| Day Percent Change: 5.38% Day Change: 3.83 | |
| Week Change: 9.45% Year-to-date Change: 11.4% | |
| AZN Links: Profile News Message Board | |
| Charts:- Daily , Weekly | |
| Add AZN to Watchlist: View: Get Complete AZN Trend Analysis ➞ | |
 | BSX Boston Scientific Corporation |
| Sector: Health Care | |
| SubSector: Medical Appliances & Equipment | |
| MarketCap: 41541.2 Millions | |
| Recent Price: 73.26 Smart Investing & Trading Score: 100 | |
| Day Percent Change: 0.48% Day Change: 0.35 | |
| Week Change: 8.81% Year-to-date Change: 26.7% | |
| BSX Links: Profile News Message Board | |
| Charts:- Daily , Weekly | |
| Add BSX to Watchlist: View: Get Complete BSX Trend Analysis ➞ | |
 | LNSR LENSAR, Inc. |
| Sector: Health Care | |
| SubSector: Medical Devices | |
| MarketCap: 91487 Millions | |
| Recent Price: 3.40 Smart Investing & Trading Score: 64 | |
| Day Percent Change: 6.92% Day Change: 0.22 | |
| Week Change: 8.28% Year-to-date Change: -3.1% | |
| LNSR Links: Profile News Message Board | |
| Charts:- Daily , Weekly | |
| Add LNSR to Watchlist: View: Get Complete LNSR Trend Analysis ➞ | |
 | SNY Sanofi |
| Sector: Health Care | |
| SubSector: Drug Manufacturers - Major | |
| MarketCap: 104761 Millions | |
| Recent Price: 49.36 Smart Investing & Trading Score: 49 | |
| Day Percent Change: 5.90% Day Change: 2.75 | |
| Week Change: 6.61% Year-to-date Change: -0.7% | |
| SNY Links: Profile News Message Board | |
| Charts:- Daily , Weekly | |
| Add SNY to Watchlist: View: Get Complete SNY Trend Analysis ➞ | |
 | PRAX Praxis Precision Medicines, Inc. |
| Sector: Health Care | |
| SubSector: Biotechnology | |
| MarketCap: 16587 Millions | |
| Recent Price: 49.59 Smart Investing & Trading Score: 71 | |
| Day Percent Change: -2.90% Day Change: -1.48 | |
| Week Change: 6.13% Year-to-date Change: 120.9% | |
| PRAX Links: Profile News Message Board | |
| Charts:- Daily , Weekly | |
| Add PRAX to Watchlist: View: Get Complete PRAX Trend Analysis ➞ | |
 | PYPD PolyPid Ltd. |
| Sector: Health Care | |
| SubSector: Biotechnology | |
| MarketCap: 20487 Millions | |
| Recent Price: 4.56 Smart Investing & Trading Score: 42 | |
| Day Percent Change: 1.62% Day Change: 0.07 | |
| Week Change: 5.98% Year-to-date Change: 24.2% | |
| PYPD Links: Profile News Message Board | |
| Charts:- Daily , Weekly | |
| Add PYPD to Watchlist: View: Get Complete PYPD Trend Analysis ➞ | |
 | GBIO Generation Bio Co. |
| Sector: Health Care | |
| SubSector: Biotechnology | |
| MarketCap: 17487 Millions | |
| Recent Price: 2.92 Smart Investing & Trading Score: 61 | |
| Day Percent Change: -2.34% Day Change: -0.07 | |
| Week Change: 5.6% Year-to-date Change: 77.3% | |
| GBIO Links: Profile News Message Board | |
| Charts:- Daily , Weekly | |
| Add GBIO to Watchlist: View: Get Complete GBIO Trend Analysis ➞ | |
 | DXCM DexCom, Inc. |
| Sector: Health Care | |
| SubSector: Medical Laboratories & Research | |
| MarketCap: 19559 Millions | |
| Recent Price: 138.01 Smart Investing & Trading Score: 80 | |
| Day Percent Change: 0.10% Day Change: 0.14 | |
| Week Change: 5.58% Year-to-date Change: 11.2% | |
| DXCM Links: Profile News Message Board | |
| Charts:- Daily , Weekly | |
| Add DXCM to Watchlist: View: Get Complete DXCM Trend Analysis ➞ | |
 | OM Outset Medical, Inc. |
| Sector: Health Care | |
| SubSector: Medical Devices | |
| MarketCap: 21787 Millions | |
| Recent Price: 2.41 Smart Investing & Trading Score: 67 | |
| Day Percent Change: -5.49% Day Change: -0.14 | |
| Week Change: 5.47% Year-to-date Change: -55.5% | |
| OM Links: Profile News Message Board | |
| Charts:- Daily , Weekly | |
| Add OM to Watchlist: View: Get Complete OM Trend Analysis ➞ | |
 | DGX Quest Diagnostics Incorporated |
| Sector: Health Care | |
| SubSector: Medical Laboratories & Research | |
| MarketCap: 11076.1 Millions | |
| Recent Price: 135.42 Smart Investing & Trading Score: 93 | |
| Day Percent Change: -1.55% Day Change: -2.13 | |
| Week Change: 5.43% Year-to-date Change: -1.8% | |
| DGX Links: Profile News Message Board | |
| Charts:- Daily , Weekly | |
| Add DGX to Watchlist: View: Get Complete DGX Trend Analysis ➞ | |
 | RPTX Repare Therapeutics Inc. |
| Sector: Health Care | |
| SubSector: Biotechnology | |
| MarketCap: 13687 Millions | |
| Recent Price: 3.18 Smart Investing & Trading Score: 35 | |
| Day Percent Change: -3.64% Day Change: -0.12 | |
| Week Change: 5.3% Year-to-date Change: -56.4% | |
| RPTX Links: Profile News Message Board | |
| Charts:- Daily , Weekly | |
| Add RPTX to Watchlist: View: Get Complete RPTX Trend Analysis ➞ | |
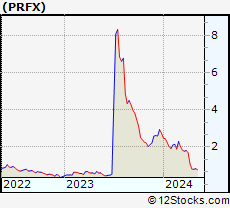 | PRFX PainReform Ltd. |
| Sector: Health Care | |
| SubSector: Drug Manufacturers Specialty & Generic | |
| MarketCap: 41487 Millions | |
| Recent Price: 0.86 Smart Investing & Trading Score: 32 | |
| Day Percent Change: 1.90% Day Change: 0.02 | |
| Week Change: 5.02% Year-to-date Change: -69.0% | |
| PRFX Links: Profile News Message Board | |
| Charts:- Daily , Weekly | |
| Add PRFX to Watchlist: View: Get Complete PRFX Trend Analysis ➞ | |
 | NVS Novartis AG |
| Sector: Health Care | |
| SubSector: Drug Manufacturers - Major | |
| MarketCap: 203929 Millions | |
| Recent Price: 99.06 Smart Investing & Trading Score: 64 | |
| Day Percent Change: 0.72% Day Change: 0.71 | |
| Week Change: 4.98% Year-to-date Change: -1.9% | |
| NVS Links: Profile News Message Board | |
| Charts:- Daily , Weekly | |
| Add NVS to Watchlist: View: Get Complete NVS Trend Analysis ➞ | |
 | TMO Thermo Fisher Scientific Inc. |
| Sector: Health Care | |
| SubSector: Medical Laboratories & Research | |
| MarketCap: 112999 Millions | |
| Recent Price: 571.73 Smart Investing & Trading Score: 75 | |
| Day Percent Change: -0.98% Day Change: -5.66 | |
| Week Change: 4.95% Year-to-date Change: 7.7% | |
| TMO Links: Profile News Message Board | |
| Charts:- Daily , Weekly | |
| Add TMO to Watchlist: View: Get Complete TMO Trend Analysis ➞ | |
 | PMVP PMV Pharmaceuticals, Inc. |
| Sector: Health Care | |
| SubSector: Biotechnology | |
| MarketCap: 20187 Millions | |
| Recent Price: 1.70 Smart Investing & Trading Score: 59 | |
| Day Percent Change: 0.59% Day Change: 0.01 | |
| Week Change: 4.94% Year-to-date Change: -45.2% | |
| PMVP Links: Profile News Message Board | |
| Charts:- Daily , Weekly | |
| Add PMVP to Watchlist: View: Get Complete PMVP Trend Analysis ➞ | |
 | CALT Calliditas Therapeutics AB (publ) |
| Sector: Health Care | |
| SubSector: Drug Manufacturers Specialty & Generic | |
| MarketCap: 83487 Millions | |
| Recent Price: 18.50 Smart Investing & Trading Score: 32 | |
| Day Percent Change: 0.00% Day Change: 0.00 | |
| Week Change: 4.82% Year-to-date Change: -27.9% | |
| CALT Links: Profile News Message Board | |
| Charts:- Daily , Weekly | |
| Add CALT to Watchlist: View: Get Complete CALT Trend Analysis ➞ | |
 | MRNA Moderna, Inc. |
| Sector: Health Care | |
| SubSector: Biotechnology | |
| MarketCap: 11006.4 Millions | |
| Recent Price: 106.21 Smart Investing & Trading Score: 73 | |
| Day Percent Change: -2.43% Day Change: -2.64 | |
| Week Change: 4.7% Year-to-date Change: 6.8% | |
| MRNA Links: Profile News Message Board | |
| Charts:- Daily , Weekly | |
| Add MRNA to Watchlist: View: Get Complete MRNA Trend Analysis ➞ | |
 | ZTS Zoetis Inc. |
| Sector: Health Care | |
| SubSector: Drugs - Generic | |
| MarketCap: 51921.5 Millions | |
| Recent Price: 153.36 Smart Investing & Trading Score: 42 | |
| Day Percent Change: 1.64% Day Change: 2.48 | |
| Week Change: 4.68% Year-to-date Change: -22.3% | |
| ZTS Links: Profile News Message Board | |
| Charts:- Daily , Weekly | |
| Add ZTS to Watchlist: View: Get Complete ZTS Trend Analysis ➞ | |
 | PASG Passage Bio, Inc. |
| Sector: Health Care | |
| SubSector: Biotechnology | |
| MarketCap: 12787 Millions | |
| Recent Price: 1.20 Smart Investing & Trading Score: 63 | |
| Day Percent Change: -3.23% Day Change: -0.04 | |
| Week Change: 4.35% Year-to-date Change: 18.8% | |
| PASG Links: Profile News Message Board | |
| Charts:- Daily , Weekly | |
| Add PASG to Watchlist: View: Get Complete PASG Trend Analysis ➞ | |
 | BIIB Biogen Inc. |
| Sector: Health Care | |
| SubSector: Biotechnology | |
| MarketCap: 53102.6 Millions | |
| Recent Price: 202.46 Smart Investing & Trading Score: 57 | |
| Day Percent Change: 0.23% Day Change: 0.47 | |
| Week Change: 4.16% Year-to-date Change: -21.8% | |
| BIIB Links: Profile News Message Board | |
| Charts:- Daily , Weekly | |
| Add BIIB to Watchlist: View: Get Complete BIIB Trend Analysis ➞ | |
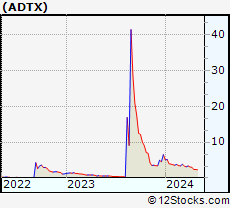 | ADTX ADiTx Therapeutics, Inc. |
| Sector: Health Care | |
| SubSector: Biotechnology | |
| MarketCap: 21487 Millions | |
| Recent Price: 2.51 Smart Investing & Trading Score: 17 | |
| Day Percent Change: 10.57% Day Change: 0.24 | |
| Week Change: 4.15% Year-to-date Change: -61.7% | |
| ADTX Links: Profile News Message Board | |
| Charts:- Daily , Weekly | |
| Add ADTX to Watchlist: View: Get Complete ADTX Trend Analysis ➞ | |
 | WAT Waters Corporation |
| Sector: Health Care | |
| SubSector: Medical Instruments & Supplies | |
| MarketCap: 11882 Millions | |
| Recent Price: 308.35 Smart Investing & Trading Score: 25 | |
| Day Percent Change: -0.61% Day Change: -1.90 | |
| Week Change: 4.14% Year-to-date Change: -6.3% | |
| WAT Links: Profile News Message Board | |
| Charts:- Daily , Weekly | |
| Add WAT to Watchlist: View: Get Complete WAT Trend Analysis ➞ | |
| For tabular summary view of above stock list: Summary View ➞ 0 - 25 , 25 - 50 , 50 - 75 , 75 - 100 , 100 - 125 , 125 - 150 , 150 - 175 | ||
| Click To Change The Sort Order: By Market Cap or Company Size Performance: Year-to-date, Week and Day | |
| Select Chart Type: | ||
|
Best Stocks Today 12Stocks.com |
© 2024 12Stocks.com Terms & Conditions Privacy Contact Us
All Information Provided Only For Education And Not To Be Used For Investing or Trading. See Terms & Conditions


One More Thing ... Get Best Stocks Delivered Daily!
Never Ever Miss A Move With Our Top Ten Stocks Lists
Find Best Stocks In Any Market - Bull or Bear Market
Take A Peek At Our Top Ten Stocks Lists: Daily, Weekly, Year-to-Date & Top Trends
Find Best Stocks In Any Market - Bull or Bear Market
Take A Peek At Our Top Ten Stocks Lists: Daily, Weekly, Year-to-Date & Top Trends
Healthcare Stocks With Best Up Trends [0-bearish to 100-bullish]: AstraZeneca [100], Merck [100], Annovis Bio[100], Haemonetics [100], Tandem Diabetes[100], Boston Scientific[100], Agios [100], Agenus [95], Mesoblast [95], Cullinan Oncology[93], Avadel [93]
Best Healthcare Stocks Year-to-Date:
Pieris [6273.63%], Precision BioSciences[2590.41%], Inovio [1885.29%], Assembly Biosciences[1529.07%], Aurora Cannabis[1311.17%], NuCana [1198.17%], Adverum Biotechnologies[1147.34%], Agenus [902.54%], Affimed N.V[680.8%], CareMax [490.72%], Mesoblast [459.09%] Best Healthcare Stocks This Week:
Pieris [7900%], Agenus [56.31%], VolitionRx [44.5%], ProKidney [32.84%], Seres [32.65%], Annovis Bio[30%], BeyondSpring [26.11%], Cullinan Oncology[22.92%], Pharvaris N.V[18.84%], OptiNose [18.42%], GeneDx [18.15%] Best Healthcare Stocks Daily:
OptiNose [14.56%], Galera [13.74%], Agenus [11.86%], VolitionRx [11.26%], ADiTx [10.57%], Apollomics [9.94%], Pharming [9.06%], Structure [8.13%], Pharvaris N.V[7.91%], ProKidney [7.75%], Community Health[7.26%]