
 Login Sign Up


| |||||
 |  | ||||

| 12Stocks.com Market Intelligence |
Best Financial Stocks
| In a hurry? Financial Stocks Lists: Performance Trends Table, Stock Charts
Sort Financial stocks: Daily, Weekly, Year-to-Date, Market Cap & Trends. Filter Financial stocks list by size:All Financial Large Mid-Range Small & MicroCap |
| 12Stocks.com Financial Stocks Performances & Trends Daily | |||||||||
|
|  The overall Smart Investing & Trading Score is 59 (0-bearish to 100-bullish) which puts Financial sector in short term neutral trend. The Smart Investing & Trading Score from previous trading session is 39 and hence an improvement of trend.
| ||||||||
Here are the Smart Investing & Trading Scores of the most requested Financial stocks at 12Stocks.com (click stock name for detailed review):
|


| 12Stocks.com: Investing in Financial sector with Stocks | |
|
The following table helps investors and traders sort through current performance and trends (as measured by Smart Investing & Trading Score) of various
stocks in the Financial sector. Quick View: Move mouse or cursor over stock symbol (ticker) to view short-term Technical chart and over stock name to view long term chart. Click on  to add stock symbol to your watchlist and to add stock symbol to your watchlist and  to view watchlist. Click on any ticker or stock name for detailed market intelligence report for that stock. to view watchlist. Click on any ticker or stock name for detailed market intelligence report for that stock. |
12Stocks.com Performance of Stocks in Financial Sector
| Ticker | Stock Name | Watchlist | Category | Recent Price | Smart Investing & Trading Score | Change % | Weekly Change% |
| ATLO | Ames National |   | Regional Banks | 19.60 | 46 | 1.82% | -0.71% |
| TY | Tri-Continental | | Closed-End Fund - Equity | 29.52 | 18 | -0.24% | -0.71% |
| RAFE | PIMCO RAFI | | Exchange Traded Fund | 33.36 | 0 | -0.12% | -0.71% |
| RFI | Cohen & Steers Total Return Realty Fund | | Closed-End Fund - Equity | 11.06 | 35 | -0.18% | -0.72% |
| ESNT | Essent | | Mortgage | 53.59 | 32 | 1.17% | -0.72% |
| WPC | W. P. | | REIT - | 54.63 | 35 | -0.38% | -0.73% |
| CBU | Community Bank | | Regional Banks | 44.31 | 60 | 2.52% | -0.74% |
| SFBS | ServisFirst Bancshares | | Foreign Banks | 60.30 | 50 | 2.27% | -0.74% |
| UNTY | Unity Bancorp | | Banks | 27.41 | 68 | 3.20% | -0.76% |
| FCT | First Trust | | Closed-End Fund - Debt | 10.25 | 26 | -0.77% | -0.77% |
| JEF | Jefferies | | Brokerage | 43.22 | 27 | 0.37% | -0.78% |
| PFLT | PennantPark Floating | | Asset Mgmt | 11.40 | 81 | 0.26% | -0.78% |
| DCOM | Dime Community | | S&L | 18.93 | 65 | 4.01% | -0.79% |
| RY | Royal Bank | | Banks | 97.38 | 54 | 0.57% | -0.79% |
| FISI | Institutions | | Regional Banks | 17.46 | 57 | 1.39% | -0.80% |
| HAFC | Hanmi | | Regional Banks | 15.69 | 85 | 2.55% | -0.82% |
| FEI | First Trust | | Closed-End Fund - Equity | 9.71 | 58 | 0.41% | -0.82% |
| UBFO | United Security | | Regional Banks | 7.23 | 0 | -0.55% | -0.82% |
| CET | Central Securities | | Asset Mgmt | 40.79 | 63 | 0.10% | -0.83% |
| JPM | JPMorgan Chase | | Banks | 191.86 | 66 | 0.06% | -0.84% |
| BXMT | Blackstone Mortgage | | Mortgage | 17.76 | 25 | 0.68% | -0.84% |
| BSIG | BrightSphere | | Asset Mgmt | 22.42 | 56 | 0.81% | -0.84% |
| QQQX | Nuveen Nasdaq | | Closed-End Fund - Equity | 22.81 | 17 | -0.24% | -0.85% |
| EFC | Ellington | | Mortgage | 11.61 | 75 | 1.49% | -0.85% |
| TECB | iShares U.S. | | Exchange Traded Fund | 45.46 | 10 | 1.07% | -0.85% |
| For chart view version of above stock list: Chart View ➞ 0 - 25 , 25 - 50 , 50 - 75 , 75 - 100 , 100 - 125 , 125 - 150 , 150 - 175 , 175 - 200 , 200 - 225 , 225 - 250 , 250 - 275 , 275 - 300 , 300 - 325 , 325 - 350 , 350 - 375 , 375 - 400 , 400 - 425 , 425 - 450 , 450 - 475 , 475 - 500 , 500 - 525 , 525 - 550 , 550 - 575 , 575 - 600 , 600 - 625 , 625 - 650 , 650 - 675 , 675 - 700 , 700 - 725 , 725 - 750 , 750 - 775 , 775 - 800 , 800 - 825 , 825 - 850 , 850 - 875 , 875 - 900 , 900 - 925 , 925 - 950 , 950 - 975 , 975 - 1000 , 1000 - 1025 , 1025 - 1050 , 1050 - 1075 , 1075 - 1100 , 1100 - 1125 , 1125 - 1150 , 1150 - 1175 , 1175 - 1200 , 1200 - 1225 , 1225 - 1250 | ||
 | Click To Change The Sort Order: By Market Cap or Company Size Performance: Year-to-date, Week and Day |  |
|
Get the most comprehensive stock market coverage daily at 12Stocks.com ➞ Best Stocks Today ➞ Best Stocks Weekly ➞ Best Stocks Year-to-Date ➞ Best Stocks Trends ➞  Best Stocks Today 12Stocks.com Best Nasdaq Stocks ➞ Best S&P 500 Stocks ➞ Best Tech Stocks ➞ Best Biotech Stocks ➞ |
| Detailed Overview of Financial Stocks |
| Financial Technical Overview, Leaders & Laggards, Top Financial ETF Funds & Detailed Financial Stocks List, Charts, Trends & More |
| Financial Sector: Technical Analysis, Trends & YTD Performance | |
| Financial sector is composed of stocks
from banks, brokers, insurance, REITs
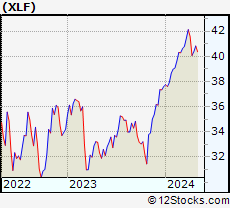
and services subsectors. Financial sector, as represented by XLF, an exchange-traded fund [ETF] that holds basket of Financial stocks (e.g, Bank of America, Goldman Sachs) is up by 7.34% and is currently outperforming the overall market by 2.8% year-to-date. Below is a quick view of Technical charts and trends: |
|
 XLF Weekly Chart |
|
| Long Term Trend: Good | |
| Medium Term Trend: Good | |
 XLF Daily Chart |
|
| Short Term Trend: Deteriorating | |
| Overall Trend Score: 59 | |
| YTD Performance: 7.34% | |
| **Trend Scores & Views Are Only For Educational Purposes And Not For Investing | |
| 12Stocks.com: Top Performing Financial Sector Stocks | ||||||||||||||||||||||||||||||||||||||||||||||||
 The top performing Financial sector stocks year to date are
Now, more recently, over last week, the top performing Financial sector stocks on the move are


|
||||||||||||||||||||||||||||||||||||||||||||||||
| 12Stocks.com: Investing in Financial Sector using Exchange Traded Funds | |
|
The following table shows list of key exchange traded funds (ETF) that
help investors track Financial Index. For detailed view, check out our ETF Funds section of our website. Quick View: Move mouse or cursor over ETF symbol (ticker) to view short-term Technical chart and over ETF name to view long term chart. Click on ticker or stock name for detailed view. Click on to add stock symbol to your watchlist and to view watchlist. |
12Stocks.com List of ETFs that track Financial Index
| Ticker | ETF Name | Watchlist | Recent Price | Smart Investing & Trading Score | Change % | Week % | Year-to-date % |
| XLF | Financial | | 40.36 | 59 | 0.00 | -1.13 | 7.34% |
| IAI | Broker-Dealers & Secs | | 112.37 | 78 | 0.90 | -0.57 | 3.54% |
| IYF | Financials | | 91.70 | 53 | 0.61 | -0.5 | 7.37% |
| IYG | Financial Services | | 63.57 | 28 | 0.13 | -1.61 | 6.42% |
| KRE | Regional Banking | | 48.27 | 73 | 2.66 | 0.17 | -7.93% |
| IXG | Global Financials | | 84.30 | 23 | 0.59 | 0.13 | 7.28% |
| VFH | Financials | | 97.76 | 28 | 0.10 | -1.18 | 5.96% |
| KBE | Bank | | 45.27 | 100 | 2.14 | -0.13 | -1.63% |
| FAS | Financial Bull 3X | | 97.30 | 64 | -0.12 | -3.31 | 17.73% |
| FAZ | Financial Bear 3X | | 11.26 | 39 | 0.09 | 3.68 | -17.63% |
| UYG | Financials | | 62.15 | 28 | -0.10 | -2.36 | 12.59% |
| IAT | Regional Banks | | 41.57 | 71 | 1.66 | -0.36 | -0.65% |
| KIE | Insurance | | 49.15 | 67 | 1.17 | 1.28 | 8.69% |
| PSCF | SmallCap Financials | | 46.80 | 27 | 2.21 | 0.95 | -4.84% |
| EUFN | Europe Financials | | 22.25 | 41 | -0.02 | -0.96 | 6.13% |
| PGF | Financial Preferred | | 14.60 | 8 | 0.76 | 0.21 | 0.14% |
| 12Stocks.com: Charts, Trends, Fundamental Data and Performances of Financial Stocks | |
|
We now take in-depth look at all Financial stocks including charts, multi-period performances and overall trends (as measured by Smart Investing & Trading Score). One can sort Financial stocks (click link to choose) by Daily, Weekly and by Year-to-Date performances. Also, one can sort by size of the company or by market capitalization. |
| Select Your Default Chart Type: | |||||
| |||||
| Click on stock symbol or name for detailed view. Click on to add stock symbol to your watchlist and to view watchlist. Quick View: Move mouse or cursor over "Daily" to quickly view daily Technical stock chart and over "Weekly" to view weekly Technical stock chart. | |||||

 | ATLO Ames National Corporation |
| Sector: Financials | |
| SubSector: Regional - Northeast Banks | |
| MarketCap: 195.999 Millions | |
| Recent Price: 19.60 Smart Investing & Trading Score: 46 | |
| Day Percent Change: 1.82% Day Change: 0.35 | |
| Week Change: -0.71% Year-to-date Change: -8.2% | |
| ATLO Links: Profile News Message Board | |
| Charts:- Daily , Weekly | |
| Add ATLO to Watchlist: View: Get Complete ATLO Trend Analysis ➞ | |
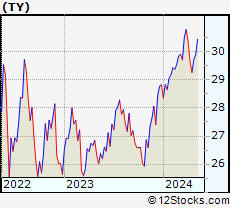 | TY Tri-Continental Corporation |
| Sector: Financials | |
| SubSector: Closed-End Fund - Equity | |
| MarketCap: 998.647 Millions | |
| Recent Price: 29.52 Smart Investing & Trading Score: 18 | |
| Day Percent Change: -0.24% Day Change: -0.07 | |
| Week Change: -0.71% Year-to-date Change: 2.4% | |
| TY Links: Profile News Message Board | |
| Charts:- Daily , Weekly | |
| Add TY to Watchlist: View: Get Complete TY Trend Analysis ➞ | |
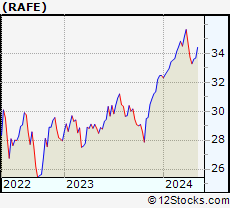 | RAFE PIMCO RAFI ESG U.S. ETF PIMCO RAFI ESG U.S. ETF |
| Sector: Financials | |
| SubSector: Exchange Traded Fund | |
| MarketCap: 60157 Millions | |
| Recent Price: 33.36 Smart Investing & Trading Score: 0 | |
| Day Percent Change: -0.12% Day Change: -0.04 | |
| Week Change: -0.71% Year-to-date Change: 2.7% | |
| RAFE Links: Profile News Message Board | |
| Charts:- Daily , Weekly | |
| Add RAFE to Watchlist: View: Get Complete RAFE Trend Analysis ➞ | |
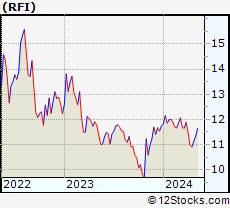 | RFI Cohen & Steers Total Return Realty Fund, Inc. |
| Sector: Financials | |
| SubSector: Closed-End Fund - Equity | |
| MarketCap: 221.147 Millions | |
| Recent Price: 11.06 Smart Investing & Trading Score: 35 | |
| Day Percent Change: -0.18% Day Change: -0.02 | |
| Week Change: -0.72% Year-to-date Change: -5.9% | |
| RFI Links: Profile News Message Board | |
| Charts:- Daily , Weekly | |
| Add RFI to Watchlist: View: Get Complete RFI Trend Analysis ➞ | |
 | ESNT Essent Group Ltd. |
| Sector: Financials | |
| SubSector: Mortgage Investment | |
| MarketCap: 2806.19 Millions | |
| Recent Price: 53.59 Smart Investing & Trading Score: 32 | |
| Day Percent Change: 1.17% Day Change: 0.62 | |
| Week Change: -0.72% Year-to-date Change: 1.6% | |
| ESNT Links: Profile News Message Board | |
| Charts:- Daily , Weekly | |
| Add ESNT to Watchlist: View: Get Complete ESNT Trend Analysis ➞ | |
 | WPC W. P. Carey Inc. |
| Sector: Financials | |
| SubSector: REIT - Diversified | |
| MarketCap: 9560.03 Millions | |
| Recent Price: 54.63 Smart Investing & Trading Score: 35 | |
| Day Percent Change: -0.38% Day Change: -0.21 | |
| Week Change: -0.73% Year-to-date Change: -15.7% | |
| WPC Links: Profile News Message Board | |
| Charts:- Daily , Weekly | |
| Add WPC to Watchlist: View: Get Complete WPC Trend Analysis ➞ | |
 | CBU Community Bank System, Inc. |
| Sector: Financials | |
| SubSector: Regional - Midwest Banks | |
| MarketCap: 2787.8 Millions | |
| Recent Price: 44.31 Smart Investing & Trading Score: 60 | |
| Day Percent Change: 2.52% Day Change: 1.09 | |
| Week Change: -0.74% Year-to-date Change: -15.0% | |
| CBU Links: Profile News Message Board | |
| Charts:- Daily , Weekly | |
| Add CBU to Watchlist: View: Get Complete CBU Trend Analysis ➞ | |
 | SFBS ServisFirst Bancshares, Inc. |
| Sector: Financials | |
| SubSector: Foreign Money Center Banks | |
| MarketCap: 1596.71 Millions | |
| Recent Price: 60.30 Smart Investing & Trading Score: 50 | |
| Day Percent Change: 2.27% Day Change: 1.34 | |
| Week Change: -0.74% Year-to-date Change: -9.5% | |
| SFBS Links: Profile News Message Board | |
| Charts:- Daily , Weekly | |
| Add SFBS to Watchlist: View: Get Complete SFBS Trend Analysis ➞ | |
 | UNTY Unity Bancorp, Inc. |
| Sector: Financials | |
| SubSector: Money Center Banks | |
| MarketCap: 149.099 Millions | |
| Recent Price: 27.41 Smart Investing & Trading Score: 68 | |
| Day Percent Change: 3.20% Day Change: 0.85 | |
| Week Change: -0.76% Year-to-date Change: -7.4% | |
| UNTY Links: Profile News Message Board | |
| Charts:- Daily , Weekly | |
| Add UNTY to Watchlist: View: Get Complete UNTY Trend Analysis ➞ | |
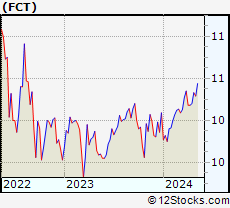 | FCT First Trust Senior Floating Rate Income Fund II |
| Sector: Financials | |
| SubSector: Closed-End Fund - Debt | |
| MarketCap: 212.407 Millions | |
| Recent Price: 10.25 Smart Investing & Trading Score: 26 | |
| Day Percent Change: -0.77% Day Change: -0.08 | |
| Week Change: -0.77% Year-to-date Change: 1.6% | |
| FCT Links: Profile News Message Board | |
| Charts:- Daily , Weekly | |
| Add FCT to Watchlist: View: Get Complete FCT Trend Analysis ➞ | |
 | JEF Jefferies Financial Group Inc. |
| Sector: Financials | |
| SubSector: Investment Brokerage - Regional | |
| MarketCap: 3987.15 Millions | |
| Recent Price: 43.22 Smart Investing & Trading Score: 27 | |
| Day Percent Change: 0.37% Day Change: 0.16 | |
| Week Change: -0.78% Year-to-date Change: 7.0% | |
| JEF Links: Profile News Message Board | |
| Charts:- Daily , Weekly | |
| Add JEF to Watchlist: View: Get Complete JEF Trend Analysis ➞ | |
 | PFLT PennantPark Floating Rate Capital Ltd. |
| Sector: Financials | |
| SubSector: Asset Management | |
| MarketCap: 170.903 Millions | |
| Recent Price: 11.40 Smart Investing & Trading Score: 81 | |
| Day Percent Change: 0.26% Day Change: 0.03 | |
| Week Change: -0.78% Year-to-date Change: -5.8% | |
| PFLT Links: Profile News Message Board | |
| Charts:- Daily , Weekly | |
| Add PFLT to Watchlist: View: Get Complete PFLT Trend Analysis ➞ | |
 | DCOM Dime Community Bancshares, Inc. |
| Sector: Financials | |
| SubSector: Savings & Loans | |
| MarketCap: 477.83 Millions | |
| Recent Price: 18.93 Smart Investing & Trading Score: 65 | |
| Day Percent Change: 4.01% Day Change: 0.73 | |
| Week Change: -0.79% Year-to-date Change: -29.7% | |
| DCOM Links: Profile News Message Board | |
| Charts:- Daily , Weekly | |
| Add DCOM to Watchlist: View: Get Complete DCOM Trend Analysis ➞ | |
 | RY Royal Bank of Canada |
| Sector: Financials | |
| SubSector: Money Center Banks | |
| MarketCap: 87565.4 Millions | |
| Recent Price: 97.38 Smart Investing & Trading Score: 54 | |
| Day Percent Change: 0.57% Day Change: 0.55 | |
| Week Change: -0.79% Year-to-date Change: -3.7% | |
| RY Links: Profile News Message Board | |
| Charts:- Daily , Weekly | |
| Add RY to Watchlist: View: Get Complete RY Trend Analysis ➞ | |
 | FISI Financial Institutions, Inc. |
| Sector: Financials | |
| SubSector: Regional - Mid-Atlantic Banks | |
| MarketCap: 253.459 Millions | |
| Recent Price: 17.46 Smart Investing & Trading Score: 57 | |
| Day Percent Change: 1.39% Day Change: 0.24 | |
| Week Change: -0.8% Year-to-date Change: -18.0% | |
| FISI Links: Profile News Message Board | |
| Charts:- Daily , Weekly | |
| Add FISI to Watchlist: View: Get Complete FISI Trend Analysis ➞ | |
 | HAFC Hanmi Financial Corporation |
| Sector: Financials | |
| SubSector: Regional - Pacific Banks | |
| MarketCap: 319.929 Millions | |
| Recent Price: 15.69 Smart Investing & Trading Score: 85 | |
| Day Percent Change: 2.55% Day Change: 0.39 | |
| Week Change: -0.82% Year-to-date Change: -19.1% | |
| HAFC Links: Profile News Message Board | |
| Charts:- Daily , Weekly | |
| Add HAFC to Watchlist: View: Get Complete HAFC Trend Analysis ➞ | |
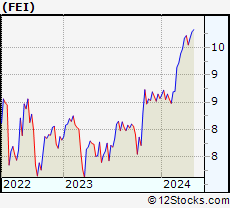 | FEI First Trust MLP and Energy Income Fund |
| Sector: Financials | |
| SubSector: Closed-End Fund - Equity | |
| MarketCap: 187.947 Millions | |
| Recent Price: 9.71 Smart Investing & Trading Score: 58 | |
| Day Percent Change: 0.41% Day Change: 0.04 | |
| Week Change: -0.82% Year-to-date Change: 13.3% | |
| FEI Links: Profile News Message Board | |
| Charts:- Daily , Weekly | |
| Add FEI to Watchlist: View: Get Complete FEI Trend Analysis ➞ | |
 | UBFO United Security Bancshares |
| Sector: Financials | |
| SubSector: Regional - Pacific Banks | |
| MarketCap: 135.029 Millions | |
| Recent Price: 7.23 Smart Investing & Trading Score: 0 | |
| Day Percent Change: -0.55% Day Change: -0.04 | |
| Week Change: -0.82% Year-to-date Change: -14.0% | |
| UBFO Links: Profile News Message Board | |
| Charts:- Daily , Weekly | |
| Add UBFO to Watchlist: View: Get Complete UBFO Trend Analysis ➞ | |
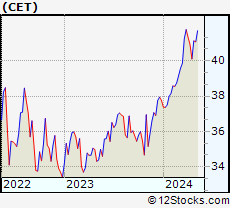 | CET Central Securities Corp. |
| Sector: Financials | |
| SubSector: Asset Management | |
| MarketCap: 574.703 Millions | |
| Recent Price: 40.79 Smart Investing & Trading Score: 63 | |
| Day Percent Change: 0.10% Day Change: 0.04 | |
| Week Change: -0.83% Year-to-date Change: 8.0% | |
| CET Links: Profile News Message Board | |
| Charts:- Daily , Weekly | |
| Add CET to Watchlist: View: Get Complete CET Trend Analysis ➞ | |
 | JPM JPMorgan Chase & Co. |
| Sector: Financials | |
| SubSector: Money Center Banks | |
| MarketCap: 279736 Millions | |
| Recent Price: 191.86 Smart Investing & Trading Score: 66 | |
| Day Percent Change: 0.06% Day Change: 0.12 | |
| Week Change: -0.84% Year-to-date Change: 12.8% | |
| JPM Links: Profile News Message Board | |
| Charts:- Daily , Weekly | |
| Add JPM to Watchlist: View: Get Complete JPM Trend Analysis ➞ | |
 | BXMT Blackstone Mortgage Trust, Inc. |
| Sector: Financials | |
| SubSector: Mortgage Investment | |
| MarketCap: 2820.69 Millions | |
| Recent Price: 17.76 Smart Investing & Trading Score: 25 | |
| Day Percent Change: 0.68% Day Change: 0.12 | |
| Week Change: -0.84% Year-to-date Change: -16.5% | |
| BXMT Links: Profile News Message Board | |
| Charts:- Daily , Weekly | |
| Add BXMT to Watchlist: View: Get Complete BXMT Trend Analysis ➞ | |
 | BSIG BrightSphere Investment Group Inc. |
| Sector: Financials | |
| SubSector: Asset Management | |
| MarketCap: 430.103 Millions | |
| Recent Price: 22.42 Smart Investing & Trading Score: 56 | |
| Day Percent Change: 0.81% Day Change: 0.18 | |
| Week Change: -0.84% Year-to-date Change: 17.0% | |
| BSIG Links: Profile News Message Board | |
| Charts:- Daily , Weekly | |
| Add BSIG to Watchlist: View: Get Complete BSIG Trend Analysis ➞ | |
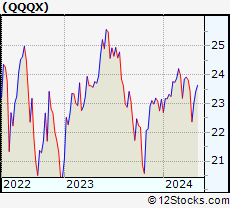 | QQQX Nuveen Nasdaq 100 Dynamic Overwrite Fund |
| Sector: Financials | |
| SubSector: Closed-End Fund - Equity | |
| MarketCap: 643.347 Millions | |
| Recent Price: 22.81 Smart Investing & Trading Score: 17 | |
| Day Percent Change: -0.24% Day Change: -0.05 | |
| Week Change: -0.85% Year-to-date Change: -1.5% | |
| QQQX Links: Profile News Message Board | |
| Charts:- Daily , Weekly | |
| Add QQQX to Watchlist: View: Get Complete QQQX Trend Analysis ➞ | |
 | EFC Ellington Financial Inc. |
| Sector: Financials | |
| SubSector: Mortgage Investment | |
| MarketCap: 380.239 Millions | |
| Recent Price: 11.61 Smart Investing & Trading Score: 75 | |
| Day Percent Change: 1.49% Day Change: 0.17 | |
| Week Change: -0.85% Year-to-date Change: -8.7% | |
| EFC Links: Profile News Message Board | |
| Charts:- Daily , Weekly | |
| Add EFC to Watchlist: View: Get Complete EFC Trend Analysis ➞ | |
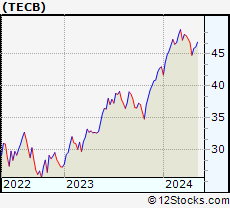 | TECB iShares U.S. Tech Breakthrough Multisector ETF |
| Sector: Financials | |
| SubSector: Exchange Traded Fund | |
| MarketCap: 60157 Millions | |
| Recent Price: 45.46 Smart Investing & Trading Score: 10 | |
| Day Percent Change: 1.07% Day Change: 0.48 | |
| Week Change: -0.85% Year-to-date Change: 5.8% | |
| TECB Links: Profile News Message Board | |
| Charts:- Daily , Weekly | |
| Add TECB to Watchlist: View: Get Complete TECB Trend Analysis ➞ | |
| For tabular summary view of above stock list: Summary View ➞ 0 - 25 , 25 - 50 , 50 - 75 , 75 - 100 , 100 - 125 , 125 - 150 , 150 - 175 , 175 - 200 , 200 - 225 , 225 - 250 , 250 - 275 , 275 - 300 , 300 - 325 , 325 - 350 , 350 - 375 , 375 - 400 , 400 - 425 , 425 - 450 , 450 - 475 , 475 - 500 , 500 - 525 , 525 - 550 , 550 - 575 , 575 - 600 , 600 - 625 , 625 - 650 , 650 - 675 , 675 - 700 , 700 - 725 , 725 - 750 , 750 - 775 , 775 - 800 , 800 - 825 , 825 - 850 , 850 - 875 , 875 - 900 , 900 - 925 , 925 - 950 , 950 - 975 , 975 - 1000 , 1000 - 1025 , 1025 - 1050 , 1050 - 1075 , 1075 - 1100 , 1100 - 1125 , 1125 - 1150 , 1150 - 1175 , 1175 - 1200 , 1200 - 1225 , 1225 - 1250 | ||
| Click To Change The Sort Order: By Market Cap or Company Size Performance: Year-to-date, Week and Day | |
| Select Chart Type: | ||
|
Best Stocks Today 12Stocks.com |
© 2024 12Stocks.com Terms & Conditions Privacy Contact Us
All Information Provided Only For Education And Not To Be Used For Investing or Trading. See Terms & Conditions


One More Thing ... Get Best Stocks Delivered Daily!
Never Ever Miss A Move With Our Top Ten Stocks Lists
Find Best Stocks In Any Market - Bull or Bear Market
Take A Peek At Our Top Ten Stocks Lists: Daily, Weekly, Year-to-Date & Top Trends
Find Best Stocks In Any Market - Bull or Bear Market
Take A Peek At Our Top Ten Stocks Lists: Daily, Weekly, Year-to-Date & Top Trends
Financial Stocks With Best Up Trends [0-bearish to 100-bullish]: LendingClub [100], TPG RE[100], Peoples Bancorp[100], Univest [100], USCB [100], Mercury General[100], BankUnited [100], Voya [100], Preferred Bank[100], Byline Bancorp[100], Bancshares[100]
Best Financial Stocks Year-to-Date:
Root [568.48%], Hippo [141.16%], Gladstone Capital[103.93%], Banco Macro[90.49%], Grupo Financiero[87.43%], Banco BBVA[77.94%], EverQuote [66.87%], Yiren Digital[66.67%], Grupo Supervielle[58.37%], Heritage Insurance[57.82%], LendingTree [57.65%] Best Financial Stocks This Week:
LendingTree [26.12%], Heartland [17.92%], New York[14.48%], Douglas Elliman[13.45%], Industrial Logistics[12.12%], LendingClub [11.11%], TPG RE[9.8%], AdvisorShares Pure[9%], USCB [8.95%], AltC Acquisition[8.82%], Root [8.68%] Best Financial Stocks Daily:
New York[28.30%], LendingClub [19.68%], Industrial Logistics[15.63%], TPG RE[13.10%], Redwood Trust[11.75%], Axos [9.66%], Capitol Federal[6.92%], GoHealth [6.85%], Citizens & Northern[6.63%], SelectQuote [6.62%], Peoples Bancorp[6.39%]