
 Login Sign Up


| |||||
 |  | ||||

| 12Stocks.com Market Intelligence |
Best Financial Stocks
| In a hurry? Financial Stocks Lists: Performance Trends Table, Stock Charts
Sort Financial stocks: Daily, Weekly, Year-to-Date, Market Cap & Trends. Filter Financial stocks list by size:All Financial Large Mid-Range Small & MicroCap |
| 12Stocks.com Financial Stocks Performances & Trends Daily | |||||||||
|
|  The overall Smart Investing & Trading Score is 56 (0-bearish to 100-bullish) which puts Financial sector in short term neutral trend. The Smart Investing & Trading Score from previous trading session is 68 and hence a deterioration of trend.
| ||||||||
Here are the Smart Investing & Trading Scores of the most requested Financial stocks at 12Stocks.com (click stock name for detailed review):
|


| 12Stocks.com: Investing in Financial sector with Stocks | |
|
The following table helps investors and traders sort through current performance and trends (as measured by Smart Investing & Trading Score) of various
stocks in the Financial sector. Quick View: Move mouse or cursor over stock symbol (ticker) to view short-term Technical chart and over stock name to view long term chart. Click on  to add stock symbol to your watchlist and to add stock symbol to your watchlist and  to view watchlist. Click on any ticker or stock name for detailed market intelligence report for that stock. to view watchlist. Click on any ticker or stock name for detailed market intelligence report for that stock. |
12Stocks.com Performance of Stocks in Financial Sector
| Ticker | Stock Name | Watchlist | Category | Recent Price | Smart Investing & Trading Score | Change % | Weekly Change% |
| DFP | Flaherty & Crumrine Dynamic Preferred and ome Fund |   | Closed-End Fund - Debt | 17.95 | 30 | -1.16% | 0.06% |
| RNP | Cohen & Steers REIT and Preferred ome Fund | | Closed-End Fund - Debt | 19.51 | 42 | -2.55% | 0.05% |
| BRK.A | BERKSHIRE HTH-A | | Insurance | 611560.00 | 56 | 0.05% | 0.05% |
| LANDO | Gladstone Land | | REIT Industrial | 19.30 | 28 | -0.36% | 0.05% |
| AACT | Ares Acquisition | | SPAC | 10.62 | 61 | -0.05% | 0.05% |
| BANF | BancFirst | | Regional - Southwest Banks | 89.32 | 93 | -2.46% | 0.04% |
| OXLCM | Oxford Lane | | Asset Mgmt | 24.97 | 28 | 0.00% | 0.04% |
| IBTE | iShares iBonds | | Exchange Traded Fund | 23.94 | 55 | 0.04% | 0.04% |
| BYNO | byNordic Acquisition | | SPAC | 11.13 | 51 | -0.09% | 0.04% |
| MAV | Pioneer Municipal | | Closed-End Fund - Debt | 7.82 | 10 | -0.24% | 0.01% |
| UNM | Unum | | Insurance | 51.36 | 43 | -1.17% | 0.00% |
| LYG | Lloyds Banking | | Foreign Banks | 2.52 | 53 | -0.79% | 0.00% |
| DHF | BNY | | Closed-End Fund - Debt | 2.30 | 35 | -0.86% | 0.00% |
| BTZ | BlackRock Credit | | Closed-End Fund - Debt | 10.10 | 10 | -0.39% | 0.00% |
| ETV | Eaton Vance | | Closed-End Fund - Equity | 12.54 | 41 | -0.63% | 0.00% |
| DEI | Douglas Emmett | | REIT - | 13.31 | 50 | -1.92% | 0.00% |
| BNY | BlackRock New | | Closed-End Fund - Debt | 10.31 | 30 | -0.29% | 0.00% |
| GGN | GAMCO Global | | Investments | 4.08 | 51 | 1.64% | 0.00% |
| NEN | New England | | Real Estatet | 69.15 | 34 | 0.00% | 0.00% |
| CHMG | Chemung | | Regional Banks | 43.50 | 55 | -0.68% | 0.00% |
| AHH | Armada Hoffler | | REIT - | 10.50 | 50 | -0.38% | 0.00% |
| FRPH | FRP | | Property Mgmt | 30.36 | 25 | -1.11% | 0.00% |
| PSF | Cohen & Steers Select Preferred and ome Fund | | Closed-End Fund - Debt | 18.77 | 37 | -1.16% | 0.00% |
| CLPR | Clipper Realty | | REIT - | 4.04 | 52 | -2.18% | 0.00% |
| AGNCM | AGNC | | Mortgage | 24.59 | 31 | 0.29% | 0.00% |
| For chart view version of above stock list: Chart View ➞ 0 - 25 , 25 - 50 , 50 - 75 , 75 - 100 , 100 - 125 , 125 - 150 , 150 - 175 , 175 - 200 , 200 - 225 , 225 - 250 , 250 - 275 , 275 - 300 , 300 - 325 , 325 - 350 , 350 - 375 , 375 - 400 , 400 - 425 , 425 - 450 , 450 - 475 , 475 - 500 , 500 - 525 , 525 - 550 , 550 - 575 , 575 - 600 , 600 - 625 , 625 - 650 , 650 - 675 , 675 - 700 , 700 - 725 , 725 - 750 , 750 - 775 , 775 - 800 , 800 - 825 , 825 - 850 , 850 - 875 , 875 - 900 , 900 - 925 , 925 - 950 , 950 - 975 , 975 - 1000 , 1000 - 1025 , 1025 - 1050 , 1050 - 1075 , 1075 - 1100 , 1100 - 1125 , 1125 - 1150 , 1150 - 1175 , 1175 - 1200 , 1200 - 1225 , 1225 - 1250 | ||
 | Click To Change The Sort Order: By Market Cap or Company Size Performance: Year-to-date, Week and Day |  |
|
Get the most comprehensive stock market coverage daily at 12Stocks.com ➞ Best Stocks Today ➞ Best Stocks Weekly ➞ Best Stocks Year-to-Date ➞ Best Stocks Trends ➞  Best Stocks Today 12Stocks.com Best Nasdaq Stocks ➞ Best S&P 500 Stocks ➞ Best Tech Stocks ➞ Best Biotech Stocks ➞ |
| Detailed Overview of Financial Stocks |
| Financial Technical Overview, Leaders & Laggards, Top Financial ETF Funds & Detailed Financial Stocks List, Charts, Trends & More |
| Financial Sector: Technical Analysis, Trends & YTD Performance | |
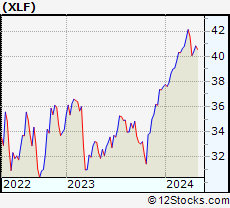
| Financial sector is composed of stocks
from banks, brokers, insurance, REITs
and services subsectors. Financial sector, as represented by XLF, an exchange-traded fund [ETF] that holds basket of Financial stocks (e.g, Bank of America, Goldman Sachs) is up by 8.72% and is currently outperforming the overall market by 3.56% year-to-date. Below is a quick view of Technical charts and trends: |
|
 XLF Weekly Chart |
|
| Long Term Trend: Very Good | |
| Medium Term Trend: Not Good | |
 XLF Daily Chart |
|
| Short Term Trend: Deteriorating | |
| Overall Trend Score: 56 | |
| YTD Performance: 8.72% | |
| **Trend Scores & Views Are Only For Educational Purposes And Not For Investing | |
| 12Stocks.com: Top Performing Financial Sector Stocks | ||||||||||||||||||||||||||||||||||||||||||||||||
 The top performing Financial sector stocks year to date are
Now, more recently, over last week, the top performing Financial sector stocks on the move are


|
||||||||||||||||||||||||||||||||||||||||||||||||
| 12Stocks.com: Investing in Financial Sector using Exchange Traded Funds | |
|
The following table shows list of key exchange traded funds (ETF) that
help investors track Financial Index. For detailed view, check out our ETF Funds section of our website. Quick View: Move mouse or cursor over ETF symbol (ticker) to view short-term Technical chart and over ETF name to view long term chart. Click on ticker or stock name for detailed view. Click on to add stock symbol to your watchlist and to view watchlist. |
12Stocks.com List of ETFs that track Financial Index
| Ticker | ETF Name | Watchlist | Recent Price | Smart Investing & Trading Score | Change % | Week % | Year-to-date % |
| XLF | Financial | | 40.88 | 56 | -0.58 | 1.24 | 8.72% |
| IAI | Broker-Dealers & Secs | | 112.15 | 48 | -0.66 | 1.01 | 3.34% |
| IYF | Financials | | 92.49 | 68 | -0.51 | 1.3 | 8.29% |
| IYG | Financial Services | | 64.56 | 76 | -0.54 | 1.8 | 8.07% |
| KRE | Regional Banking | | 48.47 | 67 | -1.10 | 2.43 | -7.55% |
| IXG | Global Financials | | 84.44 | 53 | -0.03 | 1.91 | 7.46% |
| VFH | Financials | | 99.12 | 68 | -0.60 | 1.4 | 7.44% |
| KBE | Bank | | 45.47 | 73 | -1.07 | 2.39 | -1.2% |
| FAS | Financial Bull 3X | | 101.43 | 61 | -1.72 | 3.57 | 22.72% |
| FAZ | Financial Bear 3X | | 10.79 | 40 | 1.70 | -3.66 | -21.07% |
| UYG | Financials | | 63.92 | 56 | -1.27 | 2.37 | 15.8% |
| IAT | Regional Banks | | 41.85 | 93 | -0.85 | 2.72 | 0.02% |
| KIE | Insurance | | 49.30 | 51 | -0.74 | 0.45 | 9.02% |
| PSCF | SmallCap Financials | | 46.29 | 65 | -1.59 | 1.8 | -5.88% |
| EUFN | Europe Financials | | 22.34 | 68 | -0.36 | 1.78 | 6.58% |
| PGF | Financial Preferred | | 14.57 | 37 | -1.09 | 0.28 | -0.07% |
| 12Stocks.com: Charts, Trends, Fundamental Data and Performances of Financial Stocks | |
|
We now take in-depth look at all Financial stocks including charts, multi-period performances and overall trends (as measured by Smart Investing & Trading Score). One can sort Financial stocks (click link to choose) by Daily, Weekly and by Year-to-Date performances. Also, one can sort by size of the company or by market capitalization. |
| Select Your Default Chart Type: | |||||
| |||||
| Click on stock symbol or name for detailed view. Click on to add stock symbol to your watchlist and to view watchlist. Quick View: Move mouse or cursor over "Daily" to quickly view daily Technical stock chart and over "Weekly" to view weekly Technical stock chart. | |||||

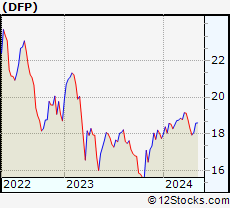 | DFP Flaherty & Crumrine Dynamic Preferred and Income Fund Inc. |
| Sector: Financials | |
| SubSector: Closed-End Fund - Debt | |
| MarketCap: 312.007 Millions | |
| Recent Price: 17.95 Smart Investing & Trading Score: 30 | |
| Day Percent Change: -1.16% Day Change: -0.21 | |
| Week Change: 0.06% Year-to-date Change: 1.1% | |
| DFP Links: Profile News Message Board | |
| Charts:- Daily , Weekly | |
| Add DFP to Watchlist: View: Get Complete DFP Trend Analysis ➞ | |
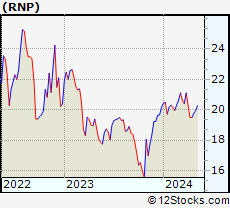 | RNP Cohen & Steers REIT and Preferred Income Fund, Inc. |
| Sector: Financials | |
| SubSector: Closed-End Fund - Debt | |
| MarketCap: 634.507 Millions | |
| Recent Price: 19.51 Smart Investing & Trading Score: 42 | |
| Day Percent Change: -2.55% Day Change: -0.51 | |
| Week Change: 0.05% Year-to-date Change: -3.2% | |
| RNP Links: Profile News Message Board | |
| Charts:- Daily , Weekly | |
| Add RNP to Watchlist: View: Get Complete RNP Trend Analysis ➞ | |
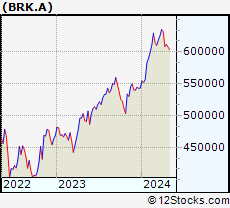 | BRK.A BERKSHIRE HTH-A |
| Sector: Financials | |
| SubSector: Insurance | |
| MarketCap: 135003 Millions | |
| Recent Price: 611560.00 Smart Investing & Trading Score: 56 | |
| Day Percent Change: 0.05% Day Change: 319.00 | |
| Week Change: 0.05% Year-to-date Change: 12.6% | |
| BRK.A Links: Profile News Message Board | |
| Charts:- Daily , Weekly | |
| Add BRK.A to Watchlist: View: Get Complete BRK.A Trend Analysis ➞ | |
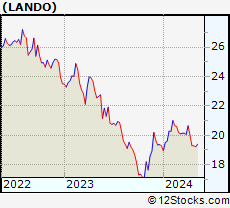 | LANDO Gladstone Land Corporation |
| Sector: Financials | |
| SubSector: REIT Industrial | |
| MarketCap: 37267 Millions | |
| Recent Price: 19.30 Smart Investing & Trading Score: 28 | |
| Day Percent Change: -0.36% Day Change: -0.07 | |
| Week Change: 0.05% Year-to-date Change: 0.0% | |
| LANDO Links: Profile News Message Board | |
| Charts:- Daily , Weekly | |
| Add LANDO to Watchlist: View: Get Complete LANDO Trend Analysis ➞ | |
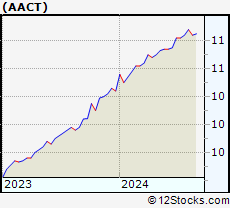 | AACT Ares Acquisition Corporation II |
| Sector: Financials | |
| SubSector: SPAC | |
| MarketCap: 639 Millions | |
| Recent Price: 10.62 Smart Investing & Trading Score: 61 | |
| Day Percent Change: -0.05% Day Change: 0.00 | |
| Week Change: 0.05% Year-to-date Change: 1.9% | |
| AACT Links: Profile News Message Board | |
| Charts:- Daily , Weekly | |
| Add AACT to Watchlist: View: Get Complete AACT Trend Analysis ➞ | |
 | BANF BancFirst Corporation |
| Sector: Financials | |
| SubSector: Regional - Southwest Banks | |
| MarketCap: 1068.65 Millions | |
| Recent Price: 89.32 Smart Investing & Trading Score: 93 | |
| Day Percent Change: -2.46% Day Change: -2.25 | |
| Week Change: 0.04% Year-to-date Change: -8.2% | |
| BANF Links: Profile News Message Board | |
| Charts:- Daily , Weekly | |
| Add BANF to Watchlist: View: Get Complete BANF Trend Analysis ➞ | |
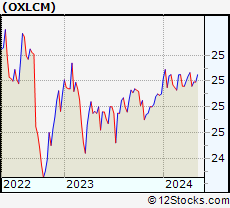 | OXLCM Oxford Lane Capital Corp. |
| Sector: Financials | |
| SubSector: Asset Management | |
| MarketCap: 672.603 Millions | |
| Recent Price: 24.97 Smart Investing & Trading Score: 28 | |
| Day Percent Change: 0.00% Day Change: 0.00 | |
| Week Change: 0.04% Year-to-date Change: 0.3% | |
| OXLCM Links: Profile News Message Board | |
| Charts:- Daily , Weekly | |
| Add OXLCM to Watchlist: View: Get Complete OXLCM Trend Analysis ➞ | |
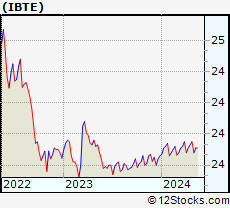 | IBTE iShares iBonds Dec 2024 Term Treasury ETF |
| Sector: Financials | |
| SubSector: Exchange Traded Fund | |
| MarketCap: 60157 Millions | |
| Recent Price: 23.94 Smart Investing & Trading Score: 55 | |
| Day Percent Change: 0.04% Day Change: 0.01 | |
| Week Change: 0.04% Year-to-date Change: 0.3% | |
| IBTE Links: Profile News Message Board | |
| Charts:- Daily , Weekly | |
| Add IBTE to Watchlist: View: Get Complete IBTE Trend Analysis ➞ | |
 | BYNO byNordic Acquisition Corporation |
| Sector: Financials | |
| SubSector: SPAC | |
| MarketCap: 254 Millions | |
| Recent Price: 11.13 Smart Investing & Trading Score: 51 | |
| Day Percent Change: -0.09% Day Change: -0.01 | |
| Week Change: 0.04% Year-to-date Change: 1.6% | |
| BYNO Links: Profile News Message Board | |
| Charts:- Daily , Weekly | |
| Add BYNO to Watchlist: View: Get Complete BYNO Trend Analysis ➞ | |
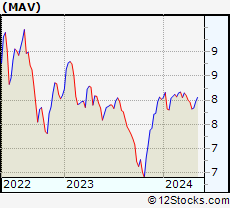 | MAV Pioneer Municipal High Income Advantage Trust |
| Sector: Financials | |
| SubSector: Closed-End Fund - Debt | |
| MarketCap: 219.807 Millions | |
| Recent Price: 7.82 Smart Investing & Trading Score: 10 | |
| Day Percent Change: -0.24% Day Change: -0.02 | |
| Week Change: 0.01% Year-to-date Change: -2.5% | |
| MAV Links: Profile News Message Board | |
| Charts:- Daily , Weekly | |
| Add MAV to Watchlist: View: Get Complete MAV Trend Analysis ➞ | |
 | UNM Unum Group |
| Sector: Financials | |
| SubSector: Accident & Health Insurance | |
| MarketCap: 2760.9 Millions | |
| Recent Price: 51.36 Smart Investing & Trading Score: 43 | |
| Day Percent Change: -1.17% Day Change: -0.61 | |
| Week Change: 0% Year-to-date Change: 13.6% | |
| UNM Links: Profile News Message Board | |
| Charts:- Daily , Weekly | |
| Add UNM to Watchlist: View: Get Complete UNM Trend Analysis ➞ | |
 | LYG Lloyds Banking Group plc |
| Sector: Financials | |
| SubSector: Foreign Money Center Banks | |
| MarketCap: 28885.4 Millions | |
| Recent Price: 2.52 Smart Investing & Trading Score: 53 | |
| Day Percent Change: -0.79% Day Change: -0.02 | |
| Week Change: 0% Year-to-date Change: 5.4% | |
| LYG Links: Profile News Message Board | |
| Charts:- Daily , Weekly | |
| Add LYG to Watchlist: View: Get Complete LYG Trend Analysis ➞ | |
 | DHF BNY Mellon High Yield Strategies Fund |
| Sector: Financials | |
| SubSector: Closed-End Fund - Debt | |
| MarketCap: 144.607 Millions | |
| Recent Price: 2.30 Smart Investing & Trading Score: 35 | |
| Day Percent Change: -0.86% Day Change: -0.02 | |
| Week Change: 0% Year-to-date Change: 0.4% | |
| DHF Links: Profile News Message Board | |
| Charts:- Daily , Weekly | |
| Add DHF to Watchlist: View: Get Complete DHF Trend Analysis ➞ | |
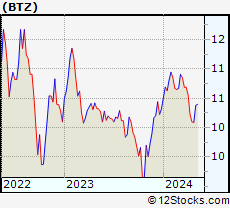 | BTZ BlackRock Credit Allocation Income Trust |
| Sector: Financials | |
| SubSector: Closed-End Fund - Debt | |
| MarketCap: 1023.07 Millions | |
| Recent Price: 10.10 Smart Investing & Trading Score: 10 | |
| Day Percent Change: -0.39% Day Change: -0.04 | |
| Week Change: 0% Year-to-date Change: -2.1% | |
| BTZ Links: Profile News Message Board | |
| Charts:- Daily , Weekly | |
| Add BTZ to Watchlist: View: Get Complete BTZ Trend Analysis ➞ | |
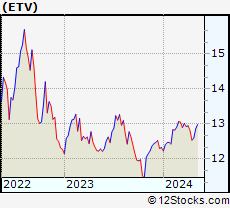 | ETV Eaton Vance Tax-Managed Buy-Write Opportunities Fund |
| Sector: Financials | |
| SubSector: Closed-End Fund - Equity | |
| MarketCap: 881.147 Millions | |
| Recent Price: 12.54 Smart Investing & Trading Score: 41 | |
| Day Percent Change: -0.63% Day Change: -0.08 | |
| Week Change: 0% Year-to-date Change: 1.7% | |
| ETV Links: Profile News Message Board | |
| Charts:- Daily , Weekly | |
| Add ETV to Watchlist: View: Get Complete ETV Trend Analysis ➞ | |
 | DEI Douglas Emmett, Inc. |
| Sector: Financials | |
| SubSector: REIT - Diversified | |
| MarketCap: 4917.83 Millions | |
| Recent Price: 13.31 Smart Investing & Trading Score: 50 | |
| Day Percent Change: -1.92% Day Change: -0.26 | |
| Week Change: 0% Year-to-date Change: -8.2% | |
| DEI Links: Profile News Message Board | |
| Charts:- Daily , Weekly | |
| Add DEI to Watchlist: View: Get Complete DEI Trend Analysis ➞ | |
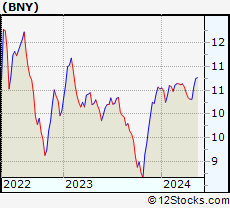 | BNY BlackRock New York Municipal Income Trust |
| Sector: Financials | |
| SubSector: Closed-End Fund - Debt | |
| MarketCap: 144.007 Millions | |
| Recent Price: 10.31 Smart Investing & Trading Score: 30 | |
| Day Percent Change: -0.29% Day Change: -0.03 | |
| Week Change: 0% Year-to-date Change: -2.1% | |
| BNY Links: Profile News Message Board | |
| Charts:- Daily , Weekly | |
| Add BNY to Watchlist: View: Get Complete BNY Trend Analysis ➞ | |
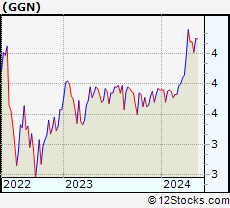 | GGN GAMCO Global Gold, Natural Resources & Income Trust |
| Sector: Financials | |
| SubSector: Diversified Investments | |
| MarketCap: 375.67 Millions | |
| Recent Price: 4.08 Smart Investing & Trading Score: 51 | |
| Day Percent Change: 1.64% Day Change: 0.07 | |
| Week Change: 0% Year-to-date Change: 8.5% | |
| GGN Links: Profile News Message Board | |
| Charts:- Daily , Weekly | |
| Add GGN to Watchlist: View: Get Complete GGN Trend Analysis ➞ | |
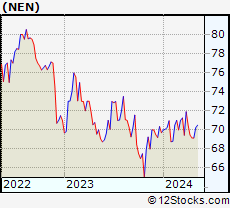 | NEN New England Realty Associates Limited Partnership |
| Sector: Financials | |
| SubSector: Real Estate Development | |
| MarketCap: 153.819 Millions | |
| Recent Price: 69.15 Smart Investing & Trading Score: 34 | |
| Day Percent Change: 0.00% Day Change: 0.00 | |
| Week Change: 0% Year-to-date Change: -0.8% | |
| NEN Links: Profile News Message Board | |
| Charts:- Daily , Weekly | |
| Add NEN to Watchlist: View: Get Complete NEN Trend Analysis ➞ | |
 | CHMG Chemung Financial Corporation |
| Sector: Financials | |
| SubSector: Regional - Pacific Banks | |
| MarketCap: 142.229 Millions | |
| Recent Price: 43.50 Smart Investing & Trading Score: 55 | |
| Day Percent Change: -0.68% Day Change: -0.30 | |
| Week Change: 0% Year-to-date Change: -12.7% | |
| CHMG Links: Profile News Message Board | |
| Charts:- Daily , Weekly | |
| Add CHMG to Watchlist: View: Get Complete CHMG Trend Analysis ➞ | |
 | AHH Armada Hoffler Properties, Inc. |
| Sector: Financials | |
| SubSector: REIT - Diversified | |
| MarketCap: 550.653 Millions | |
| Recent Price: 10.50 Smart Investing & Trading Score: 50 | |
| Day Percent Change: -0.38% Day Change: -0.04 | |
| Week Change: 0% Year-to-date Change: -15.1% | |
| AHH Links: Profile News Message Board | |
| Charts:- Daily , Weekly | |
| Add AHH to Watchlist: View: Get Complete AHH Trend Analysis ➞ | |
 | FRPH FRP Holdings, Inc. |
| Sector: Financials | |
| SubSector: Property Management | |
| MarketCap: 374.442 Millions | |
| Recent Price: 30.36 Smart Investing & Trading Score: 25 | |
| Day Percent Change: -1.11% Day Change: -0.34 | |
| Week Change: 0% Year-to-date Change: -51.7% | |
| FRPH Links: Profile News Message Board | |
| Charts:- Daily , Weekly | |
| Add FRPH to Watchlist: View: Get Complete FRPH Trend Analysis ➞ | |
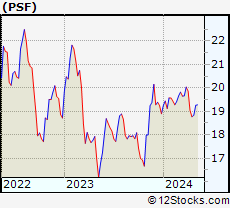 | PSF Cohen & Steers Select Preferred and Income Fund, Inc. |
| Sector: Financials | |
| SubSector: Closed-End Fund - Debt | |
| MarketCap: 207.907 Millions | |
| Recent Price: 18.77 Smart Investing & Trading Score: 37 | |
| Day Percent Change: -1.16% Day Change: -0.22 | |
| Week Change: 0% Year-to-date Change: -0.7% | |
| PSF Links: Profile News Message Board | |
| Charts:- Daily , Weekly | |
| Add PSF to Watchlist: View: Get Complete PSF Trend Analysis ➞ | |
 | CLPR Clipper Realty Inc. |
| Sector: Financials | |
| SubSector: REIT - Diversified | |
| MarketCap: 113.253 Millions | |
| Recent Price: 4.04 Smart Investing & Trading Score: 52 | |
| Day Percent Change: -2.18% Day Change: -0.09 | |
| Week Change: 0% Year-to-date Change: -25.2% | |
| CLPR Links: Profile News Message Board | |
| Charts:- Daily , Weekly | |
| Add CLPR to Watchlist: View: Get Complete CLPR Trend Analysis ➞ | |
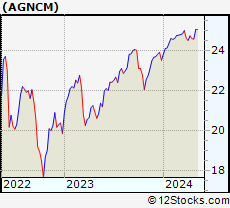 | AGNCM AGNC Investment Corp. |
| Sector: Financials | |
| SubSector: Mortgage Investment | |
| MarketCap: 7568.89 Millions | |
| Recent Price: 24.59 Smart Investing & Trading Score: 31 | |
| Day Percent Change: 0.29% Day Change: 0.07 | |
| Week Change: 0% Year-to-date Change: 4.6% | |
| AGNCM Links: Profile News Message Board | |
| Charts:- Daily , Weekly | |
| Add AGNCM to Watchlist: View: Get Complete AGNCM Trend Analysis ➞ | |
| For tabular summary view of above stock list: Summary View ➞ 0 - 25 , 25 - 50 , 50 - 75 , 75 - 100 , 100 - 125 , 125 - 150 , 150 - 175 , 175 - 200 , 200 - 225 , 225 - 250 , 250 - 275 , 275 - 300 , 300 - 325 , 325 - 350 , 350 - 375 , 375 - 400 , 400 - 425 , 425 - 450 , 450 - 475 , 475 - 500 , 500 - 525 , 525 - 550 , 550 - 575 , 575 - 600 , 600 - 625 , 625 - 650 , 650 - 675 , 675 - 700 , 700 - 725 , 725 - 750 , 750 - 775 , 775 - 800 , 800 - 825 , 825 - 850 , 850 - 875 , 875 - 900 , 900 - 925 , 925 - 950 , 950 - 975 , 975 - 1000 , 1000 - 1025 , 1025 - 1050 , 1050 - 1075 , 1075 - 1100 , 1100 - 1125 , 1125 - 1150 , 1150 - 1175 , 1175 - 1200 , 1200 - 1225 , 1225 - 1250 | ||
| Click To Change The Sort Order: By Market Cap or Company Size Performance: Year-to-date, Week and Day | |
| Select Chart Type: | ||
|
Best Stocks Today 12Stocks.com |
© 2024 12Stocks.com Terms & Conditions Privacy Contact Us
All Information Provided Only For Education And Not To Be Used For Investing or Trading. See Terms & Conditions


One More Thing ... Get Best Stocks Delivered Daily!
Never Ever Miss A Move With Our Top Ten Stocks Lists
Find Best Stocks In Any Market - Bull or Bear Market
Take A Peek At Our Top Ten Stocks Lists: Daily, Weekly, Year-to-Date & Top Trends
Find Best Stocks In Any Market - Bull or Bear Market
Take A Peek At Our Top Ten Stocks Lists: Daily, Weekly, Year-to-Date & Top Trends
Financial Stocks With Best Up Trends [0-bearish to 100-bullish]: B. Riley[100], Deutsche Bank[100], Central Pacific[100], Virtu [100], Trustmark [100], Equity Residential[100], Third Coast[100], UDR [100], AvalonBay Communities[100], Capital Southwest[100], LTC Properties[100]
Best Financial Stocks Year-to-Date:
Root [465%], Hippo [128.87%], Gladstone Capital[98.88%], Banco Macro[71.01%], Grupo Financiero[70.81%], B. Riley[65.27%], Banco BBVA[64.71%], Yiren Digital[61.54%], Heritage Insurance[59.97%], Fidelis Insurance[56.23%], First [52.08%] Best Financial Stocks This Week:
B. Riley[73.54%], Oportun [34.91%], Provident Bancorp[19.9%], Cipher Mining[15.36%], First Citizens[14.87%], Root [14.33%], TOP [14.04%], Globe Life[13.19%], Deutsche Bank[12.63%], Trustmark [11.56%], Peakstone Realty[11.41%] Best Financial Stocks Daily:
B. Riley[16.61%], First Citizens[9.80%], Deutsche Bank[8.74%], Provident Bancorp[8.10%], Barclays [7.92%], MicroSectors Gold[5.71%], Fangdd Network[5.41%], Atlanticus [4.90%], Central Pacific[4.06%], Bridge [3.63%], Meta [3.58%]