
 Login Sign Up


| |||||
 |  | ||||

| 12Stocks.com Market Intelligence |
Best Europe Stocks
|
On this page, you will find the most comprehensive analysis of European stocks and ETFs - from latest trends to performances to charts ➞. First, here are the year-to-date (YTD) performances of the most requested Europe stocks at 12Stocks.com (click stock for review):
| Deutsche Bank 32% | ||
| SAP SE 20% | ||
| ASML Holding 19% | ||
| BP 12% | ||
| AstraZeneca 11% | ||
| GlaxoSmithKline 10% | ||
| HSBC 3% | ||
| British American 0% | ||
| Novartis AG -2% | ||
| Fresenius Medical -3% | ||
| Diageo -5% | ||
| Transocean -10% | ||
| UBS -11% | ||
| Koninklijke Philips -11% | ||
| In a hurry? Europe Stocks Lists: Performance Trends Table, Stock Charts
Sort Europe stocks: Daily, Weekly, Year-to-Date, Market Cap & Trends. Filter Europe stocks list by sector: Show all, Tech, Finance, Energy, Staples, Retail, Industrial, Materials, Utilities and HealthCare Filter Europe stocks list by size:All Europe Large Medium Small and MicroCap |
| 12Stocks.com Europe Stocks Performances & Trends Daily | |||||||||
|
|  The overall Smart Investing & Trading Score is 63 (0-bearish to 100-bullish) which puts Europe index in short term neutral to bullish trend. The Smart Investing & Trading Score from previous trading session is 70 and hence a deterioration of trend.
| ||||||||
Here are the Smart Investing & Trading Scores of the most requested Europe stocks at 12Stocks.com (click stock name for detailed review):
|


| 12Stocks.com: Top Performing Europe Index Stocks | ||||||||||||||||||||||||||||||||||||||||||||||||
 The top performing Europe Index stocks year to date are
Now, more recently, over last week, the top performing Europe Index stocks on the move are


|
||||||||||||||||||||||||||||||||||||||||||||||||
| 12Stocks.com: Investing in Europe Index with Stocks | |
|
The following table helps investors and traders sort through current performance and trends (as measured by Smart Investing & Trading Score) of various
stocks in the Europe Index. Quick View: Move mouse or cursor over stock symbol (ticker) to view short-term technical chart and over stock name to view long term chart. Click on  to add stock symbol to your watchlist and to add stock symbol to your watchlist and  to view watchlist. Click on any ticker or stock name for detailed market intelligence report for that stock. to view watchlist. Click on any ticker or stock name for detailed market intelligence report for that stock. |
12Stocks.com Performance of Stocks in Europe Index
| Ticker | Stock Name | Watchlist | Category | Recent Price | Smart Investing & Trading Score | Change % | YTD Change% |
| SAP | SAP SE |   | Technology | 185.09 | 68 | -1.58% | 19.73% |
| ASML | ASML Holding | | Technology | 902.51 | 58 | 1.14% | 19.23% |
| VOD | Vodafone | | Technology | 8.61 | 65 | -0.58% | -1.03% |
| RELX | RELX | | Technology | 41.12 | 49 | -0.75% | 3.68% |
| ORAN | Orange S.A | | Technology | 11.23 | 7 | -0.80% | -1.75% |
| PHG | Koninklijke Philips | | Technology | 20.72 | 75 | -1.19% | -11.19% |
| ERIC | Telefonaktiebolaget LM | | Technology | 5.24 | 37 | -0.76% | -16.83% |
| NXPI | NXP Semiconductors | | Technology | 238.08 | 75 | 1.29% | 3.66% |
| TEL | TE Connectivity | | Technology | 140.48 | 0 | 0.34% | -0.01% |
| STM | STMicroelectronics N.V | | Technology | 42.60 | 57 | 1.09% | -15.02% |
| GRMN | Garmin | | Technology | 143.03 | 56 | 0.17% | 11.27% |
| LBTYA | Liberty Global | | Technology | 16.15 | 0 | -0.62% | -9.12% |
| LOGI | Logitech | | Technology | 78.72 | 18 | -0.87% | -17.19% |
| LBTYK | Liberty Global | | Technology | 16.67 | 0 | -0.54% | -10.57% |
| ST | Sensata | | Technology | 34.38 | 35 | -0.12% | -8.49% |
| SRAD | Sportradar | | Technology | 9.63 | 18 | -0.72% | -13.63% |
| NVT | nVent Electric | | Technology | 74.44 | 41 | 0.98% | 25.98% |
| VEON | VEON | | Technology | 23.47 | 41 | -1.18% | 19.14% |
| DAVA | Endava | | Technology | 29.10 | 15 | -3.00% | -62.62% |
| VTEX | VTEX | | Technology | 7.32 | 10 | 1.17% | 6.94% |
| PSFE | Paysafe | | Technology | 14.50 | 35 | -0.07% | 12.40% |
| TRVG | trivago N.V | | Technology | 2.55 | 41 | 0.00% | 4.51% |
| CRTO | Criteo S.A | | Technology | 36.55 | 90 | -1.11% | 44.35% |
| ARQQ | Arqit Quantum | | Technology | 0.48 | 61 | -1.24% | 4.92% |
| MYNA | Mynaric AG | | Technology | 5.28 | 49 | 0.38% | -14.70% |
| For chart view version of above stock list: Chart View ➞ 0 - 25 , 25 - 50 | ||
 | Click To Change The Sort Order: By Market Cap or Company Size Performance: Year-to-date, Week and Day |  |
|
Get the most comprehensive stock market coverage daily at 12Stocks.com ➞ Best Stocks Today ➞ Best Stocks Weekly ➞ Best Stocks Year-to-Date ➞ Best Stocks Trends ➞  Best Stocks Today 12Stocks.com Best Nasdaq Stocks ➞ Best S&P 500 Stocks ➞ Best Tech Stocks ➞ Best Biotech Stocks ➞ |
| Detailed Overview of Europe Stocks |
| Europe Technical Overview, Leaders & Laggards, Top Europe ETF Funds & Detailed Europe Stocks List, Charts, Trends & More |
| Europe: Technical Analysis, Trends & YTD Performance | |
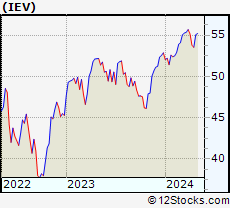
 IEV Weekly Chart |
|
| Long Term Trend: Very Good | |
| Medium Term Trend: Not Good | |
 IEV Daily Chart |
|
| Short Term Trend: Very Good | |
| Overall Trend Score: 63 | |
| YTD Performance: 3.23% | |
| **Trend Scores & Views Are Only For Educational Purposes And Not For Investing | |
| 12Stocks.com: Investing in Europe Index using Exchange Traded Funds | |
|
The following table shows list of key exchange traded funds (ETF) that
help investors play Europe stock market. For detailed view, check out our ETF Funds section of our website. Quick View: Move mouse or cursor over ETF symbol (ticker) to view short-term technical chart and over ETF name to view long term chart. Click on ticker or stock name for detailed view. Click on to add stock symbol to your watchlist and to view watchlist. |
12Stocks.com List of ETFs that track Europe Index
| Ticker | ETF Name | Watchlist | Recent Price | Smart Investing & Trading Score | Change % | Week % | Year-to-date % |
| IEV | Europe | | 54.57 | 63 | -0.20 | 1.94 | 3.23% |
| VGK | Europe | | 65.89 | 63 | -0.18 | 1.87 | 2.19% |
| EURL | Europe Bull 3X | | 24.15 | 66 | -1.25 | 5.46 | 1.86% |
| EPV | Short Europe | | 8.17 | 42 | 0.25 | -3.77 | -4.89% |
| IEUS | Europe Small-Cap | | 54.93 | 63 | -0.24 | 1.27 | -2.26% |
| HEDJ | Europe Hedged Equity | | 47.14 | 69 | -0.63 | 1.35 | 10.01% |
| EUSC | Europe Hedged SmallCap | | 38.15 | 76 | -0.47 | 0.85 | 5.96% |
| EUFN | Europe Financials | | 22.34 | 68 | -0.36 | 1.78 | 6.58% |
| EWU | United Kingdom | | 34.56 | 93 | 0.96 | 3.19 | 4.57% |
| EWQ | France | | 40.37 | 51 | -0.59 | 1.15 | 3.04% |
| EWG | Germany | | 30.69 | 58 | -0.32 | 2.27 | 3.37% |
| EWL | Switzerland | | 45.76 | 7 | -0.67 | 0.13 | -5.2% |
| EWN | Netherlands | | 48.03 | 56 | -0.39 | 2.61 | 7.62% |
| EWI | Italy | | 37.04 | 83 | -0.88 | 1.79 | 9.17% |
| FEP | Europe AlphaDEX | | 37.07 | 63 | -0.27 | 2.08 | 2.07% |
| FDD | European Sel Div | | 11.88 | 78 | 0.04 | 1.32 | -1.58% |
| FXE | Euro | | 99.14 | 42 | 0.27 | 0.74 | -2.84% |
| 12Stocks.com: Charts, Trends, Fundamental Data and Performances of Europe Stocks | |
|
We now take in-depth look at all Europe stocks including charts, multi-period performances and overall trends (as measured by Smart Investing & Trading Score). One can sort Europe stocks (click link to choose) by Daily, Weekly and by Year-to-Date performances. Also, one can sort by size of the company or by market capitalization. |
| Select Your Default Chart Type: | |||||
| |||||
| Click on stock symbol or name for detailed view. Click on to add stock symbol to your watchlist and to view watchlist. Quick View: Move mouse or cursor over "Daily" to quickly view daily technical stock chart and over "Weekly" to view weekly technical stock chart. | |||||

 | SAP SAP SE |
| Sector: Technology | |
| SubSector: Application Software | |
| MarketCap: 129635 Millions | |
| Recent Price: 185.09 Smart Investing & Trading Score: 68 | |
| Day Percent Change: -1.58% Day Change: -2.98 | |
| Week Change: 5.3% Year-to-date Change: 19.7% | |
| SAP Links: Profile News Message Board | |
| Charts:- Daily , Weekly | |
| Add SAP to Watchlist: View: Get Complete SAP Trend Analysis ➞ | |
 | ASML ASML Holding N.V. |
| Sector: Technology | |
| SubSector: Semiconductor Equipment & Materials | |
| MarketCap: 102565 Millions | |
| Recent Price: 902.51 Smart Investing & Trading Score: 58 | |
| Day Percent Change: 1.14% Day Change: 10.19 | |
| Week Change: 5% Year-to-date Change: 19.2% | |
| ASML Links: Profile News Message Board | |
| Charts:- Daily , Weekly | |
| Add ASML to Watchlist: View: Get Complete ASML Trend Analysis ➞ | |
 | VOD Vodafone Group Plc |
| Sector: Technology | |
| SubSector: Wireless Communications | |
| MarketCap: 38154.7 Millions | |
| Recent Price: 8.61 Smart Investing & Trading Score: 65 | |
| Day Percent Change: -0.58% Day Change: -0.05 | |
| Week Change: 3.24% Year-to-date Change: -1.0% | |
| VOD Links: Profile News Message Board | |
| Charts:- Daily , Weekly | |
| Add VOD to Watchlist: View: Get Complete VOD Trend Analysis ➞ | |
 | RELX RELX PLC |
| Sector: Technology | |
| SubSector: Information & Delivery Services | |
| MarketCap: 36730.7 Millions | |
| Recent Price: 41.12 Smart Investing & Trading Score: 49 | |
| Day Percent Change: -0.75% Day Change: -0.31 | |
| Week Change: 0.12% Year-to-date Change: 3.7% | |
| RELX Links: Profile News Message Board | |
| Charts:- Daily , Weekly | |
| Add RELX to Watchlist: View: Get Complete RELX Trend Analysis ➞ | |
 | ORAN Orange S.A. |
| Sector: Technology | |
| SubSector: Telecom Services - Foreign | |
| MarketCap: 34948.2 Millions | |
| Recent Price: 11.23 Smart Investing & Trading Score: 7 | |
| Day Percent Change: -0.80% Day Change: -0.09 | |
| Week Change: -2.43% Year-to-date Change: -1.8% | |
| ORAN Links: Profile News Message Board | |
| Charts:- Daily , Weekly | |
| Add ORAN to Watchlist: View: Get Complete ORAN Trend Analysis ➞ | |
 | PHG Koninklijke Philips N.V. |
| Sector: Technology | |
| SubSector: Electronic Equipment | |
| MarketCap: 32405.2 Millions | |
| Recent Price: 20.72 Smart Investing & Trading Score: 75 | |
| Day Percent Change: -1.19% Day Change: -0.25 | |
| Week Change: 3.7% Year-to-date Change: -11.2% | |
| PHG Links: Profile News Message Board | |
| Charts:- Daily , Weekly | |
| Add PHG to Watchlist: View: Get Complete PHG Trend Analysis ➞ | |
 | ERIC Telefonaktiebolaget LM Ericsson (publ) |
| Sector: Technology | |
| SubSector: Communication Equipment | |
| MarketCap: 27041.1 Millions | |
| Recent Price: 5.24 Smart Investing & Trading Score: 37 | |
| Day Percent Change: -0.76% Day Change: -0.04 | |
| Week Change: 2.75% Year-to-date Change: -16.8% | |
| ERIC Links: Profile News Message Board | |
| Charts:- Daily , Weekly | |
| Add ERIC to Watchlist: View: Get Complete ERIC Trend Analysis ➞ | |
 | NXPI NXP Semiconductors N.V. |
| Sector: Technology | |
| SubSector: Semiconductor - Broad Line | |
| MarketCap: 22497.9 Millions | |
| Recent Price: 238.08 Smart Investing & Trading Score: 75 | |
| Day Percent Change: 1.29% Day Change: 3.04 | |
| Week Change: 10.67% Year-to-date Change: 3.7% | |
| NXPI Links: Profile News Message Board | |
| Charts:- Daily , Weekly | |
| Add NXPI to Watchlist: View: Get Complete NXPI Trend Analysis ➞ | |
 | TEL TE Connectivity Ltd. |
| Sector: Technology | |
| SubSector: Diversified Electronics | |
| MarketCap: 20044.9 Millions | |
| Recent Price: 140.48 Smart Investing & Trading Score: 0 | |
| Day Percent Change: 0.34% Day Change: 0.48 | |
| Week Change: -0.05% Year-to-date Change: 0.0% | |
| TEL Links: Profile News Message Board | |
| Charts:- Daily , Weekly | |
| Add TEL to Watchlist: View: Get Complete TEL Trend Analysis ➞ | |
 | STM STMicroelectronics N.V. |
| Sector: Technology | |
| SubSector: Semiconductor - Broad Line | |
| MarketCap: 17878.6 Millions | |
| Recent Price: 42.60 Smart Investing & Trading Score: 57 | |
| Day Percent Change: 1.09% Day Change: 0.46 | |
| Week Change: 10.36% Year-to-date Change: -15.0% | |
| STM Links: Profile News Message Board | |
| Charts:- Daily , Weekly | |
| Add STM to Watchlist: View: Get Complete STM Trend Analysis ➞ | |
 | GRMN Garmin Ltd. |
| Sector: Technology | |
| SubSector: Scientific & Technical Instruments | |
| MarketCap: 13909.3 Millions | |
| Recent Price: 143.03 Smart Investing & Trading Score: 56 | |
| Day Percent Change: 0.17% Day Change: 0.24 | |
| Week Change: 2.52% Year-to-date Change: 11.3% | |
| GRMN Links: Profile News Message Board | |
| Charts:- Daily , Weekly | |
| Add GRMN to Watchlist: View: Get Complete GRMN Trend Analysis ➞ | |
 | LBTYA Liberty Global plc |
| Sector: Technology | |
| SubSector: CATV Systems | |
| MarketCap: 11723.7 Millions | |
| Recent Price: 16.15 Smart Investing & Trading Score: 0 | |
| Day Percent Change: -0.62% Day Change: -0.10 | |
| Week Change: -3.64% Year-to-date Change: -9.1% | |
| LBTYA Links: Profile News Message Board | |
| Charts:- Daily , Weekly | |
| Add LBTYA to Watchlist: View: Get Complete LBTYA Trend Analysis ➞ | |
 | LOGI Logitech International S.A. |
| Sector: Technology | |
| SubSector: Computer Peripherals | |
| MarketCap: 7998.19 Millions | |
| Recent Price: 78.72 Smart Investing & Trading Score: 18 | |
| Day Percent Change: -0.87% Day Change: -0.69 | |
| Week Change: 1.82% Year-to-date Change: -17.2% | |
| LOGI Links: Profile News Message Board | |
| Charts:- Daily , Weekly | |
| Add LOGI to Watchlist: View: Get Complete LOGI Trend Analysis ➞ | |
 | LBTYK Liberty Global plc |
| Sector: Technology | |
| SubSector: CATV Systems | |
| MarketCap: 7253.02 Millions | |
| Recent Price: 16.67 Smart Investing & Trading Score: 0 | |
| Day Percent Change: -0.54% Day Change: -0.09 | |
| Week Change: -4.14% Year-to-date Change: -10.6% | |
| LBTYK Links: Profile News Message Board | |
| Charts:- Daily , Weekly | |
| Add LBTYK to Watchlist: View: Get Complete LBTYK Trend Analysis ➞ | |
 | ST Sensata Technologies Holding plc |
| Sector: Technology | |
| SubSector: Scientific & Technical Instruments | |
| MarketCap: 4434.23 Millions | |
| Recent Price: 34.38 Smart Investing & Trading Score: 35 | |
| Day Percent Change: -0.12% Day Change: -0.04 | |
| Week Change: 2.02% Year-to-date Change: -8.5% | |
| ST Links: Profile News Message Board | |
| Charts:- Daily , Weekly | |
| Add ST to Watchlist: View: Get Complete ST Trend Analysis ➞ | |
 | SRAD Sportradar Group AG |
| Sector: Technology | |
| SubSector: Software - Application | |
| MarketCap: 3900 Millions | |
| Recent Price: 9.63 Smart Investing & Trading Score: 18 | |
| Day Percent Change: -0.72% Day Change: -0.07 | |
| Week Change: -0.31% Year-to-date Change: -13.6% | |
| SRAD Links: Profile News Message Board | |
| Charts:- Daily , Weekly | |
| Add SRAD to Watchlist: View: Get Complete SRAD Trend Analysis ➞ | |
 | NVT nVent Electric plc |
| Sector: Technology | |
| SubSector: Diversified Electronics | |
| MarketCap: 2752.86 Millions | |
| Recent Price: 74.44 Smart Investing & Trading Score: 41 | |
| Day Percent Change: 0.98% Day Change: 0.72 | |
| Week Change: 3.92% Year-to-date Change: 26.0% | |
| NVT Links: Profile News Message Board | |
| Charts:- Daily , Weekly | |
| Add NVT to Watchlist: View: Get Complete NVT Trend Analysis ➞ | |
 | VEON VEON Ltd. |
| Sector: Technology | |
| SubSector: Telecom Services - Foreign | |
| MarketCap: 2497.89 Millions | |
| Recent Price: 23.47 Smart Investing & Trading Score: 41 | |
| Day Percent Change: -1.18% Day Change: -0.28 | |
| Week Change: -1.84% Year-to-date Change: 19.1% | |
| VEON Links: Profile News Message Board | |
| Charts:- Daily , Weekly | |
| Add VEON to Watchlist: View: Get Complete VEON Trend Analysis ➞ | |
 | DAVA Endava plc |
| Sector: Technology | |
| SubSector: Business Software & Services | |
| MarketCap: 1744.68 Millions | |
| Recent Price: 29.10 Smart Investing & Trading Score: 15 | |
| Day Percent Change: -3.00% Day Change: -0.90 | |
| Week Change: -2.74% Year-to-date Change: -62.6% | |
| DAVA Links: Profile News Message Board | |
| Charts:- Daily , Weekly | |
| Add DAVA to Watchlist: View: Get Complete DAVA Trend Analysis ➞ | |
 | VTEX VTEX |
| Sector: Technology | |
| SubSector: Software - Application | |
| MarketCap: 919 Millions | |
| Recent Price: 7.32 Smart Investing & Trading Score: 10 | |
| Day Percent Change: 1.17% Day Change: 0.08 | |
| Week Change: -3.43% Year-to-date Change: 6.9% | |
| VTEX Links: Profile News Message Board | |
| Charts:- Daily , Weekly | |
| Add VTEX to Watchlist: View: Get Complete VTEX Trend Analysis ➞ | |
 | PSFE Paysafe Limited |
| Sector: Technology | |
| SubSector: Software - Infrastructure | |
| MarketCap: 605 Millions | |
| Recent Price: 14.50 Smart Investing & Trading Score: 35 | |
| Day Percent Change: -0.07% Day Change: -0.01 | |
| Week Change: 1.9% Year-to-date Change: 12.4% | |
| PSFE Links: Profile News Message Board | |
| Charts:- Daily , Weekly | |
| Add PSFE to Watchlist: View: Get Complete PSFE Trend Analysis ➞ | |
 | TRVG trivago N.V. |
| Sector: Technology | |
| SubSector: Internet Information Providers | |
| MarketCap: 587.88 Millions | |
| Recent Price: 2.55 Smart Investing & Trading Score: 41 | |
| Day Percent Change: 0.00% Day Change: 0.00 | |
| Week Change: -0.78% Year-to-date Change: 4.5% | |
| TRVG Links: Profile News Message Board | |
| Charts:- Daily , Weekly | |
| Add TRVG to Watchlist: View: Get Complete TRVG Trend Analysis ➞ | |
 | CRTO Criteo S.A. |
| Sector: Technology | |
| SubSector: Internet Information Providers | |
| MarketCap: 515.78 Millions | |
| Recent Price: 36.55 Smart Investing & Trading Score: 90 | |
| Day Percent Change: -1.11% Day Change: -0.41 | |
| Week Change: 3.19% Year-to-date Change: 44.4% | |
| CRTO Links: Profile News Message Board | |
| Charts:- Daily , Weekly | |
| Add CRTO to Watchlist: View: Get Complete CRTO Trend Analysis ➞ | |
 | ARQQ Arqit Quantum Inc. |
| Sector: Technology | |
| SubSector: Software - Infrastructure | |
| MarketCap: 165 Millions | |
| Recent Price: 0.48 Smart Investing & Trading Score: 61 | |
| Day Percent Change: -1.24% Day Change: -0.01 | |
| Week Change: 1.7% Year-to-date Change: 4.9% | |
| ARQQ Links: Profile News Message Board | |
| Charts:- Daily , Weekly | |
| Add ARQQ to Watchlist: View: Get Complete ARQQ Trend Analysis ➞ | |
 | MYNA Mynaric AG |
| Sector: Technology | |
| SubSector: Communication Equipment | |
| MarketCap: 152 Millions | |
| Recent Price: 5.28 Smart Investing & Trading Score: 49 | |
| Day Percent Change: 0.38% Day Change: 0.02 | |
| Week Change: -5.29% Year-to-date Change: -14.7% | |
| MYNA Links: Profile News Message Board | |
| Charts:- Daily , Weekly | |
| Add MYNA to Watchlist: View: Get Complete MYNA Trend Analysis ➞ | |
| For tabular summary view of above stock list: Summary View ➞ 0 - 25 , 25 - 50 | ||
| Click To Change The Sort Order: By Market Cap or Company Size Performance: Year-to-date, Week and Day | |
| Select Chart Type: | ||
|
Best Stocks Today 12Stocks.com |
© 2024 12Stocks.com Terms & Conditions Privacy Contact Us
All Information Provided Only For Education And Not To Be Used For Investing or Trading. See Terms & Conditions


One More Thing ... Get Best Stocks Delivered Daily!
Never Ever Miss A Move With Our Top Ten Stocks Lists
Find Best Stocks In Any Market - Bull or Bear Market
Take A Peek At Our Top Ten Stocks Lists: Daily, Weekly, Year-to-Date & Top Trends
Find Best Stocks In Any Market - Bull or Bear Market
Take A Peek At Our Top Ten Stocks Lists: Daily, Weekly, Year-to-Date & Top Trends
Europe Stocks With Best Up Trends [0-bearish to 100-bullish]: Deutsche Bank[100], AstraZeneca [100], BP [95], HSBC [93], MYT Netherlands[93], NewAmsterdam Pharma[93], Criteo S.A[90], Fresenius Medical[88], Garrett Motion[86], Allego N.V[85], InterContinental Hotels[83]
Best Europe Stocks Year-to-Date:
NuCana [1198.17%], Affimed N.V[680.8%], ADC [172.89%], Addex [155.34%], NewAmsterdam Pharma[90.75%], MorphoSys AG[83.08%], Merus N.V[63.38%], Renalytix AI[62.61%], Spotify [53.81%], Criteo S.A[44.35%], Summit [36.02%] Best Europe Stocks This Week:
Pharvaris N.V[18.84%], Merus N.V[12.86%], Deutsche Bank[12.63%], Jumia [11.93%], Barclays [10.8%], NXP Semiconductors[10.67%], STMicroelectronics N.V[10.36%], AstraZeneca [9.45%], Allego N.V[9.09%], Nanobiotix S.A[9.06%], Molecular Partners[8.73%] Best Europe Stocks Daily:
Pharming [9.06%], Deutsche Bank[8.74%], Barclays [7.92%], Pharvaris N.V[7.91%], Merus N.V[7.05%], Polestar Automotive[6.07%], Unilever [5.93%], Sanofi [5.90%], AstraZeneca [5.38%], Genius Sports[3.50%], Nanobiotix S.A[3.33%]