
 Login Sign Up


| |||||
 |  | ||||

| 12Stocks.com Market Intelligence |
Best Consumer Services Stocks
| In a hurry? Services & Goods Stocks: Performance Trends Table, Stock Charts
Sort Consumer Services: Daily, Weekly, Year-to-Date, Market Cap & Trends. Filter Services & Goods stocks list by size: All Large Mid-Range Small |
| 12Stocks.com Consumer Services Stocks Performances & Trends Daily | |||||||||
|
|  The overall Smart Investing & Trading Score is 68 (0-bearish to 100-bullish) which puts Consumer Services sector in short term neutral to bullish trend. The Smart Investing & Trading Score from previous trading session is 51 and hence an improvement of trend.
| ||||||||
Here are the Smart Investing & Trading Scores of the most requested Consumer Services stocks at 12Stocks.com (click stock name for detailed review):
|


| Consider signing up for our daily 12Stocks.com "Best Stocks Newsletter". You will never ever miss a big stock move again! |
| 12Stocks.com: Investing in Consumer Services sector with Stocks | |
|
The following table helps investors and traders sort through current performance and trends (as measured by Smart Investing & Trading Score) of various
stocks in the Consumer Services sector. Quick View: Move mouse or cursor over stock symbol (ticker) to view short-term Technical chart and over stock name to view long term chart. Click on  to add stock symbol to your watchlist and to add stock symbol to your watchlist and  to view watchlist. Click on any ticker or stock name for detailed market intelligence report for that stock. to view watchlist. Click on any ticker or stock name for detailed market intelligence report for that stock. |
12Stocks.com Performance of Stocks in Consumer Services Sector
| Ticker | Stock Name | Watchlist | Category | Recent Price | Smart Investing & Trading Score | Change % | Weekly Change% |
| HLLY | Holley |   | Auto Parts | 4.00 | 0 | -1.60% | -4.19% |
| CMCSA | Comcast | | Entertainment | 38.55 | 0 | 1.80% | -4.20% |
| ORLY | O Reilly | | Auto Parts | 1043.27 | 26 | -1.03% | -4.37% |
| AAP | Advance Auto | | Auto Parts | 75.14 | 60 | 0.58% | -4.51% |
| CAH | Cardinal Health | | Pharmacy | 103.21 | 18 | -0.58% | -4.60% |
| BROS | Dutch Bros | | Restaurants | 28.59 | 44 | -1.04% | -4.60% |
| RUSHB | Rush Enterprises | | Automobile | 44.38 | 7 | 5.33% | -4.61% |
| GDEN | Golden Entertainment | | Casinos | 32.40 | 45 | -2.47% | -4.62% |
| EYE | National Vision | | Retail | 17.87 | 20 | 0.00% | -4.95% |
| MSC | Studio City | | Casinos | 7.12 | 46 | 1.64% | -5.01% |
| EVRI | Everi | | Gaming | 8.38 | 10 | 0.36% | -5.10% |
| GTN | Gray Television | | Broadcasting | 5.61 | 45 | -2.77% | -5.24% |
| THCH | TH | | Restaurants | 1.16 | 35 | 3.57% | -5.69% |
| UONEK | Urban One | | Broadcasting | 1.60 | 17 | 1.59% | -5.88% |
| WEX | WEX | | Services | 216.58 | 61 | 0.72% | -6.03% |
| EM | Smart Share | | Services | 0.60 | 78 | 0.17% | -6.09% |
| WINA | Winmark | | Retail | 360.03 | 65 | -1.54% | -6.17% |
| GDEV | GDEV | | Electronic Gaming & Multimedia | 2.12 | 18 | -6.61% | -6.19% |
| BIG | Big Lots | | Retail | 3.47 | 37 | 0.00% | -6.22% |
| BEDU | Bright Scholar | | Education | 1.88 | 46 | -3.59% | -6.47% |
| LI | Li Auto | | Auto Manufacturers | 25.12 | 32 | 7.30% | -7.68% |
| ONEW | OneWater Marine | | Recreational | 21.97 | 35 | 3.41% | -7.83% |
| WOOF | Petco Health | | Specialty Retail | 1.52 | 15 | 0.66% | -8.43% |
| CATO | Cato | | Apparel | 4.60 | 15 | -3.56% | -8.73% |
| AOUT | American Outdoor | | Leisure | 7.78 | 15 | -5.18% | -8.90% |
| For chart view version of above stock list: Chart View ➞ 0 - 25 , 25 - 50 , 50 - 75 , 75 - 100 , 100 - 125 , 125 - 150 , 150 - 175 , 175 - 200 , 200 - 225 , 225 - 250 , 250 - 275 , 275 - 300 , 300 - 325 , 325 - 350 , 350 - 375 , 375 - 400 , 400 - 425 , 425 - 450 , 450 - 475 | ||
 | Click To Change The Sort Order: By Market Cap or Company Size Performance: Year-to-date, Week and Day |  |
|
Get the most comprehensive stock market coverage daily at 12Stocks.com ➞ Best Stocks Today ➞ Best Stocks Weekly ➞ Best Stocks Year-to-Date ➞ Best Stocks Trends ➞  Best Stocks Today 12Stocks.com Best Nasdaq Stocks ➞ Best S&P 500 Stocks ➞ Best Tech Stocks ➞ Best Biotech Stocks ➞ |
| Detailed Overview of Consumer Services Stocks |
| Consumer Services Technical Overview, Leaders & Laggards, Top Consumer Services ETF Funds & Detailed Consumer Services Stocks List, Charts, Trends & More |
| Consumer Services Sector: Technical Analysis, Trends & YTD Performance | |
| Consumer Services sector is composed of stocks
from retail, entertainment, media/publishing, consumer goods
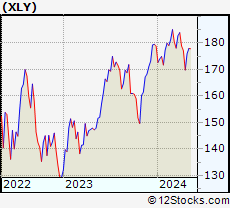
and services subsectors. Consumer Services sector, as represented by XLY, an exchange-traded fund [ETF] that holds basket of Consumer Services stocks (e.g, Walmart, Alibaba) is down by -1.62% and is currently underperforming the overall market by -7.76% year-to-date. Below is a quick view of Technical charts and trends: |
|
 XLY Weekly Chart |
|
| Long Term Trend: Good | |
| Medium Term Trend: Not Good | |
 XLY Daily Chart |
|
| Short Term Trend: Very Good | |
| Overall Trend Score: 68 | |
| YTD Performance: -1.62% | |
| **Trend Scores & Views Are Only For Educational Purposes And Not For Investing | |
| 12Stocks.com: Top Performing Consumer Services Sector Stocks | ||||||||||||||||||||||||||||||||||||||||||||||||
 The top performing Consumer Services sector stocks year to date are
Now, more recently, over last week, the top performing Consumer Services sector stocks on the move are


|
||||||||||||||||||||||||||||||||||||||||||||||||
| 12Stocks.com: Investing in Consumer Services Sector using Exchange Traded Funds | |
|
The following table shows list of key exchange traded funds (ETF) that
help investors track Consumer Services Index. For detailed view, check out our ETF Funds section of our website. Quick View: Move mouse or cursor over ETF symbol (ticker) to view short-term Technical chart and over ETF name to view long term chart. Click on ticker or stock name for detailed view. Click on to add stock symbol to your watchlist and to view watchlist. |
12Stocks.com List of ETFs that track Consumer Services Index
| Ticker | ETF Name | Watchlist | Recent Price | Smart Investing & Trading Score | Change % | Week % | Year-to-date % |
| XLY | Consumer Discret Sel | | 175.91 | 68 | 0.90 | 3.62 | -1.62% |
| RTH | Retail | | 201.08 | 56 | 1.22 | 1.23 | 6.83% |
| IYC | Consumer Services | | 78.36 | 43 | 0.63 | 2.74 | 3.42% |
| XRT | Retail | | 73.22 | 63 | 1.40 | 2.88 | 1.24% |
| IYK | Consumer Goods | | 66.82 | 68 | -0.24 | 1.53 | 4.56% |
| UCC | Consumer Services | | 33.88 | 80 | 1.89 | 7.3 | -5.65% |
| RETL | Retail Bull 3X | | 8.83 | 55 | 4.25 | 8.74 | -3.18% |
| RXI | Globl Consumer Discretionary | | 161.18 | 43 | 1.26 | 2.56 | 1.33% |
| SCC | Short Consumer Services | | 15.78 | 35 | -1.74 | -6.92 | 2.98% |
| UGE | Consumer Goods | | 17.17 | 90 | 0.29 | 3.26 | 9.08% |
| 12Stocks.com: Charts, Trends, Fundamental Data and Performances of Consumer Services Stocks | |
|
We now take in-depth look at all Consumer Services stocks including charts, multi-period performances and overall trends (as measured by Smart Investing & Trading Score). One can sort Consumer Services stocks (click link to choose) by Daily, Weekly and by Year-to-Date performances. Also, one can sort by size of the company or by market capitalization. |
| Select Your Default Chart Type: | |||||
| |||||
| Click on stock symbol or name for detailed view. Click on to add stock symbol to your watchlist and to view watchlist. Quick View: Move mouse or cursor over "Daily" to quickly view daily Technical stock chart and over "Weekly" to view weekly Technical stock chart. | |||||

 | HLLY Holley Inc. |
| Sector: Services & Goods | |
| SubSector: Auto Parts | |
| MarketCap: 469 Millions | |
| Recent Price: 4.00 Smart Investing & Trading Score: 0 | |
| Day Percent Change: -1.60% Day Change: -0.07 | |
| Week Change: -4.19% Year-to-date Change: -19.3% | |
| HLLY Links: Profile News Message Board | |
| Charts:- Daily , Weekly | |
| Add HLLY to Watchlist: View: Get Complete HLLY Trend Analysis ➞ | |
 | CMCSA Comcast Corporation |
| Sector: Services & Goods | |
| SubSector: Entertainment - Diversified | |
| MarketCap: 164849 Millions | |
| Recent Price: 38.55 Smart Investing & Trading Score: 0 | |
| Day Percent Change: 1.80% Day Change: 0.68 | |
| Week Change: -4.2% Year-to-date Change: -12.1% | |
| CMCSA Links: Profile News Message Board | |
| Charts:- Daily , Weekly | |
| Add CMCSA to Watchlist: View: Get Complete CMCSA Trend Analysis ➞ | |
 | ORLY O Reilly Automotive, Inc. |
| Sector: Services & Goods | |
| SubSector: Auto Parts Stores | |
| MarketCap: 22391.5 Millions | |
| Recent Price: 1043.27 Smart Investing & Trading Score: 26 | |
| Day Percent Change: -1.03% Day Change: -10.86 | |
| Week Change: -4.37% Year-to-date Change: 9.8% | |
| ORLY Links: Profile News Message Board | |
| Charts:- Daily , Weekly | |
| Add ORLY to Watchlist: View: Get Complete ORLY Trend Analysis ➞ | |
 | AAP Advance Auto Parts, Inc. |
| Sector: Services & Goods | |
| SubSector: Auto Parts Stores | |
| MarketCap: 5977.7 Millions | |
| Recent Price: 75.14 Smart Investing & Trading Score: 60 | |
| Day Percent Change: 0.58% Day Change: 0.43 | |
| Week Change: -4.51% Year-to-date Change: 23.1% | |
| AAP Links: Profile News Message Board | |
| Charts:- Daily , Weekly | |
| Add AAP to Watchlist: View: Get Complete AAP Trend Analysis ➞ | |
 | CAH Cardinal Health, Inc. |
| Sector: Services & Goods | |
| SubSector: Drugs Wholesale | |
| MarketCap: 14509.9 Millions | |
| Recent Price: 103.21 Smart Investing & Trading Score: 18 | |
| Day Percent Change: -0.58% Day Change: -0.60 | |
| Week Change: -4.6% Year-to-date Change: 2.4% | |
| CAH Links: Profile News Message Board | |
| Charts:- Daily , Weekly | |
| Add CAH to Watchlist: View: Get Complete CAH Trend Analysis ➞ | |
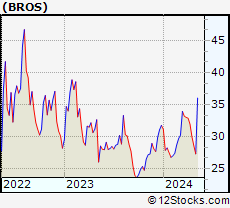 | BROS Dutch Bros Inc. |
| Sector: Services & Goods | |
| SubSector: Restaurants | |
| MarketCap: 4670 Millions | |
| Recent Price: 28.59 Smart Investing & Trading Score: 44 | |
| Day Percent Change: -1.04% Day Change: -0.30 | |
| Week Change: -4.6% Year-to-date Change: -10.0% | |
| BROS Links: Profile News Message Board | |
| Charts:- Daily , Weekly | |
| Add BROS to Watchlist: View: Get Complete BROS Trend Analysis ➞ | |
 | RUSHB Rush Enterprises, Inc. |
| Sector: Services & Goods | |
| SubSector: Auto Dealerships | |
| MarketCap: 203.221 Millions | |
| Recent Price: 44.38 Smart Investing & Trading Score: 7 | |
| Day Percent Change: 5.33% Day Change: 2.24 | |
| Week Change: -4.61% Year-to-date Change: -16.2% | |
| RUSHB Links: Profile News Message Board | |
| Charts:- Daily , Weekly | |
| Add RUSHB to Watchlist: View: Get Complete RUSHB Trend Analysis ➞ | |
 | GDEN Golden Entertainment, Inc. |
| Sector: Services & Goods | |
| SubSector: Resorts & Casinos | |
| MarketCap: 130.794 Millions | |
| Recent Price: 32.40 Smart Investing & Trading Score: 45 | |
| Day Percent Change: -2.47% Day Change: -0.82 | |
| Week Change: -4.62% Year-to-date Change: -18.9% | |
| GDEN Links: Profile News Message Board | |
| Charts:- Daily , Weekly | |
| Add GDEN to Watchlist: View: Get Complete GDEN Trend Analysis ➞ | |
 | EYE National Vision Holdings, Inc. |
| Sector: Services & Goods | |
| SubSector: Specialty Retail, Other | |
| MarketCap: 1290.84 Millions | |
| Recent Price: 17.87 Smart Investing & Trading Score: 20 | |
| Day Percent Change: 0.00% Day Change: 0.00 | |
| Week Change: -4.95% Year-to-date Change: -14.6% | |
| EYE Links: Profile News Message Board | |
| Charts:- Daily , Weekly | |
| Add EYE to Watchlist: View: Get Complete EYE Trend Analysis ➞ | |
 | MSC Studio City International Holdings Limited |
| Sector: Services & Goods | |
| SubSector: Resorts & Casinos | |
| MarketCap: 1420.54 Millions | |
| Recent Price: 7.12 Smart Investing & Trading Score: 46 | |
| Day Percent Change: 1.64% Day Change: 0.12 | |
| Week Change: -5.01% Year-to-date Change: 9.8% | |
| MSC Links: Profile News Message Board | |
| Charts:- Daily , Weekly | |
| Add MSC to Watchlist: View: Get Complete MSC Trend Analysis ➞ | |
 | EVRI Everi Holdings Inc. |
| Sector: Services & Goods | |
| SubSector: Gaming Activities | |
| MarketCap: 273.389 Millions | |
| Recent Price: 8.38 Smart Investing & Trading Score: 10 | |
| Day Percent Change: 0.36% Day Change: 0.03 | |
| Week Change: -5.1% Year-to-date Change: -25.6% | |
| EVRI Links: Profile News Message Board | |
| Charts:- Daily , Weekly | |
| Add EVRI to Watchlist: View: Get Complete EVRI Trend Analysis ➞ | |
 | GTN Gray Television, Inc. |
| Sector: Services & Goods | |
| SubSector: Broadcasting - TV | |
| MarketCap: 1144.63 Millions | |
| Recent Price: 5.61 Smart Investing & Trading Score: 45 | |
| Day Percent Change: -2.77% Day Change: -0.16 | |
| Week Change: -5.24% Year-to-date Change: -37.4% | |
| GTN Links: Profile News Message Board | |
| Charts:- Daily , Weekly | |
| Add GTN to Watchlist: View: Get Complete GTN Trend Analysis ➞ | |
 | THCH TH International Limited |
| Sector: Services & Goods | |
| SubSector: Restaurants | |
| MarketCap: 452 Millions | |
| Recent Price: 1.16 Smart Investing & Trading Score: 35 | |
| Day Percent Change: 3.57% Day Change: 0.04 | |
| Week Change: -5.69% Year-to-date Change: -33.3% | |
| THCH Links: Profile News Message Board | |
| Charts:- Daily , Weekly | |
| Add THCH to Watchlist: View: Get Complete THCH Trend Analysis ➞ | |
 | UONEK Urban One, Inc. |
| Sector: Services & Goods | |
| SubSector: Broadcasting - Radio | |
| MarketCap: 601.795 Millions | |
| Recent Price: 1.60 Smart Investing & Trading Score: 17 | |
| Day Percent Change: 1.59% Day Change: 0.03 | |
| Week Change: -5.88% Year-to-date Change: -53.5% | |
| UONEK Links: Profile News Message Board | |
| Charts:- Daily , Weekly | |
| Add UONEK to Watchlist: View: Get Complete UONEK Trend Analysis ➞ | |
 | WEX WEX Inc. |
| Sector: Services & Goods | |
| SubSector: Business Services | |
| MarketCap: 4312.22 Millions | |
| Recent Price: 216.58 Smart Investing & Trading Score: 61 | |
| Day Percent Change: 0.72% Day Change: 1.55 | |
| Week Change: -6.03% Year-to-date Change: 11.3% | |
| WEX Links: Profile News Message Board | |
| Charts:- Daily , Weekly | |
| Add WEX to Watchlist: View: Get Complete WEX Trend Analysis ➞ | |
 | EM Smart Share Global Limited |
| Sector: Services & Goods | |
| SubSector: Personal Services | |
| MarketCap: 238 Millions | |
| Recent Price: 0.60 Smart Investing & Trading Score: 78 | |
| Day Percent Change: 0.17% Day Change: 0.00 | |
| Week Change: -6.09% Year-to-date Change: 16.7% | |
| EM Links: Profile News Message Board | |
| Charts:- Daily , Weekly | |
| Add EM to Watchlist: View: Get Complete EM Trend Analysis ➞ | |
 | WINA Winmark Corporation |
| Sector: Services & Goods | |
| SubSector: Specialty Retail, Other | |
| MarketCap: 520.444 Millions | |
| Recent Price: 360.03 Smart Investing & Trading Score: 65 | |
| Day Percent Change: -1.54% Day Change: -5.64 | |
| Week Change: -6.17% Year-to-date Change: -13.8% | |
| WINA Links: Profile News Message Board | |
| Charts:- Daily , Weekly | |
| Add WINA to Watchlist: View: Get Complete WINA Trend Analysis ➞ | |
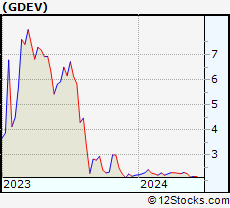 | GDEV GDEV Inc. |
| Sector: Services & Goods | |
| SubSector: Electronic Gaming & Multimedia | |
| MarketCap: 1300 Millions | |
| Recent Price: 2.12 Smart Investing & Trading Score: 18 | |
| Day Percent Change: -6.61% Day Change: -0.15 | |
| Week Change: -6.19% Year-to-date Change: -3.6% | |
| GDEV Links: Profile News Message Board | |
| Charts:- Daily , Weekly | |
| Add GDEV to Watchlist: View: Get Complete GDEV Trend Analysis ➞ | |
 | BIG Big Lots, Inc. |
| Sector: Services & Goods | |
| SubSector: Discount, Variety Stores | |
| MarketCap: 603.572 Millions | |
| Recent Price: 3.47 Smart Investing & Trading Score: 37 | |
| Day Percent Change: 0.00% Day Change: 0.00 | |
| Week Change: -6.22% Year-to-date Change: -55.5% | |
| BIG Links: Profile News Message Board | |
| Charts:- Daily , Weekly | |
| Add BIG to Watchlist: View: Get Complete BIG Trend Analysis ➞ | |
 | BEDU Bright Scholar Education Holdings Limited |
| Sector: Services & Goods | |
| SubSector: Education & Training Services | |
| MarketCap: 792.406 Millions | |
| Recent Price: 1.88 Smart Investing & Trading Score: 46 | |
| Day Percent Change: -3.59% Day Change: -0.07 | |
| Week Change: -6.47% Year-to-date Change: 50.4% | |
| BEDU Links: Profile News Message Board | |
| Charts:- Daily , Weekly | |
| Add BEDU to Watchlist: View: Get Complete BEDU Trend Analysis ➞ | |
 | LI Li Auto Inc. |
| Sector: Services & Goods | |
| SubSector: Auto Manufacturers | |
| MarketCap: 29167 Millions | |
| Recent Price: 25.12 Smart Investing & Trading Score: 32 | |
| Day Percent Change: 7.30% Day Change: 1.71 | |
| Week Change: -7.68% Year-to-date Change: -32.9% | |
| LI Links: Profile News Message Board | |
| Charts:- Daily , Weekly | |
| Add LI to Watchlist: View: Get Complete LI Trend Analysis ➞ | |
 | ONEW OneWater Marine Inc. |
| Sector: Services & Goods | |
| SubSector: Recreational Vehicles | |
| MarketCap: 42027 Millions | |
| Recent Price: 21.97 Smart Investing & Trading Score: 35 | |
| Day Percent Change: 3.41% Day Change: 0.73 | |
| Week Change: -7.83% Year-to-date Change: -35.0% | |
| ONEW Links: Profile News Message Board | |
| Charts:- Daily , Weekly | |
| Add ONEW to Watchlist: View: Get Complete ONEW Trend Analysis ➞ | |
 | WOOF Petco Health and Wellness Company, Inc. |
| Sector: Services & Goods | |
| SubSector: Specialty Retail | |
| MarketCap: 2030 Millions | |
| Recent Price: 1.52 Smart Investing & Trading Score: 15 | |
| Day Percent Change: 0.66% Day Change: 0.01 | |
| Week Change: -8.43% Year-to-date Change: -51.9% | |
| WOOF Links: Profile News Message Board | |
| Charts:- Daily , Weekly | |
| Add WOOF to Watchlist: View: Get Complete WOOF Trend Analysis ➞ | |
 | CATO The Cato Corporation |
| Sector: Services & Goods | |
| SubSector: Apparel Stores | |
| MarketCap: 305.208 Millions | |
| Recent Price: 4.60 Smart Investing & Trading Score: 15 | |
| Day Percent Change: -3.56% Day Change: -0.17 | |
| Week Change: -8.73% Year-to-date Change: -35.6% | |
| CATO Links: Profile News Message Board | |
| Charts:- Daily , Weekly | |
| Add CATO to Watchlist: View: Get Complete CATO Trend Analysis ➞ | |
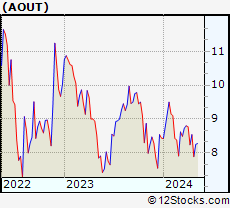 | AOUT American Outdoor Brands, Inc. |
| Sector: Services & Goods | |
| SubSector: Leisure | |
| MarketCap: 19027 Millions | |
| Recent Price: 7.78 Smart Investing & Trading Score: 15 | |
| Day Percent Change: -5.18% Day Change: -0.42 | |
| Week Change: -8.9% Year-to-date Change: -7.8% | |
| AOUT Links: Profile News Message Board | |
| Charts:- Daily , Weekly | |
| Add AOUT to Watchlist: View: Get Complete AOUT Trend Analysis ➞ | |
| For tabular summary view of above stock list: Summary View ➞ 0 - 25 , 25 - 50 , 50 - 75 , 75 - 100 , 100 - 125 , 125 - 150 , 150 - 175 , 175 - 200 , 200 - 225 , 225 - 250 , 250 - 275 , 275 - 300 , 300 - 325 , 325 - 350 , 350 - 375 , 375 - 400 , 400 - 425 , 425 - 450 , 450 - 475 | ||
| Click To Change The Sort Order: By Market Cap or Company Size Performance: Year-to-date, Week and Day | |
| Select Chart Type: | ||
|
Best Stocks Today 12Stocks.com |
© 2024 12Stocks.com Terms & Conditions Privacy Contact Us
All Information Provided Only For Education And Not To Be Used For Investing or Trading. See Terms & Conditions


One More Thing ... Get Best Stocks Delivered Daily!
Never Ever Miss A Move With Our Top Ten Stocks Lists
Find Best Stocks In Any Market - Bull or Bear Market
Take A Peek At Our Top Ten Stocks Lists: Daily, Weekly, Year-to-Date & Top Trends
Find Best Stocks In Any Market - Bull or Bear Market
Take A Peek At Our Top Ten Stocks Lists: Daily, Weekly, Year-to-Date & Top Trends
Consumer Services Stocks With Best Up Trends [0-bearish to 100-bullish]: CAVA [100], Yatsen Holding[100], MINISO [100], Reservoir Media[100], AutoNation [100], Pactiv Evergreen[100], Gaia [100], Tractor Supply[100], Chipotle Mexican[100], Dada Nexus[100], Cheesecake Factory[100]
Best Consumer Services Stocks Year-to-Date:
U Power[2779.46%], Vroom [1804.53%], Yatsen Holding[558.83%], Fluent [337.31%], Codere Online[130.82%], Sweetgreen [116.99%], Research[106.23%], RealReal [78.11%], Carvana Co[59.26%], CAVA [59.06%], PaySign [57.5%] Best Consumer Services Stocks This Week:
Chicken Soup[214.9%], Yatsen Holding[33.33%], Sonic Automotive[28.14%], ATRenew [25.32%], Strategic Education[23.32%], Hibbett Sports[21.05%], Exponent [20.17%], Baozun [19.4%], Altisource Portfolio[19.39%], Golden Heaven[19.11%], Qurate Retail[18.83%] Best Consumer Services Stocks Daily:
ATRenew [22.98%], Exponent [19.40%], XPeng [12.38%], CAVA [10.50%], Sonic Automotive[9.93%], Fluent [9.74%], Yatsen Holding[9.30%], Kratos Defense[9.09%], WW [9.03%], Carvana Co[8.79%], Qurate Retail[8.74%]