
 Login Sign Up


| |||||
 |  | ||||

| 12Stocks.com Market Intelligence |
Best Consumer Services Stocks
| In a hurry? Services & Goods Stocks: Performance Trends Table, Stock Charts
Sort Consumer Services: Daily, Weekly, Year-to-Date, Market Cap & Trends. Filter Services & Goods stocks list by size: All Large Mid-Range Small |
| 12Stocks.com Consumer Services Stocks Performances & Trends Daily | |||||||||
|
|  The overall Smart Investing & Trading Score is 58 (0-bearish to 100-bullish) which puts Consumer Services sector in short term neutral trend. The Smart Investing & Trading Score from previous trading session is 23 and an improvement of trend continues.
| ||||||||
Here are the Smart Investing & Trading Scores of the most requested Consumer Services stocks at 12Stocks.com (click stock name for detailed review):
|


| Consider signing up for our daily 12Stocks.com "Best Stocks Newsletter". You will never ever miss a big stock move again! |
| 12Stocks.com: Investing in Consumer Services sector with Stocks | |
|
The following table helps investors and traders sort through current performance and trends (as measured by Smart Investing & Trading Score) of various
stocks in the Consumer Services sector. Quick View: Move mouse or cursor over stock symbol (ticker) to view short-term Technical chart and over stock name to view long term chart. Click on  to add stock symbol to your watchlist and to add stock symbol to your watchlist and  to view watchlist. Click on any ticker or stock name for detailed market intelligence report for that stock. to view watchlist. Click on any ticker or stock name for detailed market intelligence report for that stock. |
12Stocks.com Performance of Stocks in Consumer Services Sector
| Ticker | Stock Name | Watchlist | Category | Recent Price | Smart Investing & Trading Score | Change % | Weekly Change% |
| YUM | Yum! Brands |   | Restaurants | 141.81 | 100 | 1.22% | 2.39% |
| HRB | H&R Block | | Services | 47.93 | 90 | 0.59% | 2.33% |
| CHH | Choice Hotels | | Lodging | 119.06 | 42 | 1.64% | 2.33% |
| NL | NL Industries | | Equipment | 7.99 | 53 | 3.50% | 2.30% |
| BFAM | Bright Horizons | | Services | 106.83 | 63 | -0.73% | 2.28% |
| WSM | Williams-Sonoma | | Retail | 285.51 | 68 | 0.15% | 2.26% |
| IHS | IHS Holding | | Telecom Services | 3.40 | 54 | -0.44% | 2.26% |
| NWSA | News | | Broadcasting | 24.56 | 45 | -0.20% | 2.25% |
| BATRK | Liberty Braves | | Broadcasting | 38.12 | 42 | -0.44% | 2.25% |
| KFY | Korn Ferry | | Staffing | 62.65 | 68 | -0.85% | 2.22% |
| IPG | Interpublic | | Advertising | 31.40 | 67 | 1.32% | 2.21% |
| WYNN | Wynn Resorts | | Casinos | 97.04 | 51 | -1.80% | 2.16% |
| UA | Under Armour | | Apparel | 6.61 | 50 | -0.15% | 2.16% |
| ACTG | Acacia Research | | Services | 4.99 | 68 | 0.30% | 2.15% |
| VVI | Viad Corp | | Services | 35.46 | 63 | -0.59% | 2.13% |
| ARMK | Aramark | | Restaurants | 32.55 | 83 | 1.40% | 2.13% |
| KELYA | Kelly Services | | Staffing | 24.21 | 70 | 1.38% | 2.11% |
| VMAR | Vision Marine | | Leisure | 0.57 | 47 | 0.00% | 2.11% |
| TSCO | Tractor Supply | | Retail | 258.10 | 90 | 0.84% | 2.10% |
| LAUR | Laureate Education | | Education | 14.34 | 48 | 0.60% | 2.10% |
| OLLI | Ollie s | | Retail | 74.75 | 90 | -0.62% | 2.10% |
| COST | Costco Wholesale | | Retail | 724.17 | 80 | 0.21% | 2.07% |
| TJX | TJX | | Department | 95.28 | 52 | 0.83% | 2.06% |
| BATRA | Liberty Braves | | Broadcasting | 41.11 | 42 | -0.19% | 2.04% |
| PSNYW | Polestar Automotive | | Auto Manufacturers | 0.15 | 25 | -3.23% | 2.04% |
| For chart view version of above stock list: Chart View ➞ 0 - 25 , 25 - 50 , 50 - 75 , 75 - 100 , 100 - 125 , 125 - 150 , 150 - 175 , 175 - 200 , 200 - 225 , 225 - 250 , 250 - 275 , 275 - 300 , 300 - 325 , 325 - 350 , 350 - 375 , 375 - 400 , 400 - 425 , 425 - 450 , 450 - 475 | ||
 | Click To Change The Sort Order: By Market Cap or Company Size Performance: Year-to-date, Week and Day |  |
|
Get the most comprehensive stock market coverage daily at 12Stocks.com ➞ Best Stocks Today ➞ Best Stocks Weekly ➞ Best Stocks Year-to-Date ➞ Best Stocks Trends ➞  Best Stocks Today 12Stocks.com Best Nasdaq Stocks ➞ Best S&P 500 Stocks ➞ Best Tech Stocks ➞ Best Biotech Stocks ➞ |
| Detailed Overview of Consumer Services Stocks |
| Consumer Services Technical Overview, Leaders & Laggards, Top Consumer Services ETF Funds & Detailed Consumer Services Stocks List, Charts, Trends & More |
| Consumer Services Sector: Technical Analysis, Trends & YTD Performance | |
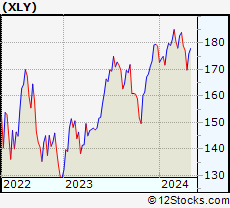
| Consumer Services sector is composed of stocks
from retail, entertainment, media/publishing, consumer goods
and services subsectors. Consumer Services sector, as represented by XLY, an exchange-traded fund [ETF] that holds basket of Consumer Services stocks (e.g, Walmart, Alibaba) is down by -2.58% and is currently underperforming the overall market by -8.24% year-to-date. Below is a quick view of Technical charts and trends: |
|
 XLY Weekly Chart |
|
| Long Term Trend: Good | |
| Medium Term Trend: Not Good | |
 XLY Daily Chart |
|
| Short Term Trend: Very Good | |
| Overall Trend Score: 58 | |
| YTD Performance: -2.58% | |
| **Trend Scores & Views Are Only For Educational Purposes And Not For Investing | |
| 12Stocks.com: Top Performing Consumer Services Sector Stocks | ||||||||||||||||||||||||||||||||||||||||||||||||
 The top performing Consumer Services sector stocks year to date are
Now, more recently, over last week, the top performing Consumer Services sector stocks on the move are


|
||||||||||||||||||||||||||||||||||||||||||||||||
| 12Stocks.com: Investing in Consumer Services Sector using Exchange Traded Funds | |
|
The following table shows list of key exchange traded funds (ETF) that
help investors track Consumer Services Index. For detailed view, check out our ETF Funds section of our website. Quick View: Move mouse or cursor over ETF symbol (ticker) to view short-term Technical chart and over ETF name to view long term chart. Click on ticker or stock name for detailed view. Click on to add stock symbol to your watchlist and to view watchlist. |
12Stocks.com List of ETFs that track Consumer Services Index
| Ticker | ETF Name | Watchlist | Recent Price | Smart Investing & Trading Score | Change % | Week % | Year-to-date % |
| XLY | Consumer Discret Sel | | 174.19 | 58 | 0.96 | 2.61 | -2.58% |
| RTH | Retail | | 200.56 | 58 | 0.03 | 0.97 | 6.55% |
| IYC | Consumer Services | | 77.83 | 43 | 0.31 | 2.05 | 2.72% |
| XRT | Retail | | 72.52 | 65 | -0.71 | 1.9 | 0.28% |
| IYK | Consumer Goods | | 67.20 | 75 | 0.99 | 2.11 | 5.16% |
| UCC | Consumer Services | | 33.37 | 73 | 2.12 | 5.68 | -7.07% |
| RETL | Retail Bull 3X | | 8.59 | 48 | -1.60 | 5.79 | -5.81% |
| RXI | Globl Consumer Discretionary | | 160.29 | 43 | 0.63 | 2 | 0.77% |
| SCC | Short Consumer Services | | 16.15 | 35 | -1.67 | -4.74 | 5.39% |
| UGE | Consumer Goods | | 17.02 | 83 | -0.09 | 2.33 | 8.09% |
| 12Stocks.com: Charts, Trends, Fundamental Data and Performances of Consumer Services Stocks | |
|
We now take in-depth look at all Consumer Services stocks including charts, multi-period performances and overall trends (as measured by Smart Investing & Trading Score). One can sort Consumer Services stocks (click link to choose) by Daily, Weekly and by Year-to-Date performances. Also, one can sort by size of the company or by market capitalization. |
| Select Your Default Chart Type: | |||||
| |||||
| Click on stock symbol or name for detailed view. Click on to add stock symbol to your watchlist and to view watchlist. Quick View: Move mouse or cursor over "Daily" to quickly view daily Technical stock chart and over "Weekly" to view weekly Technical stock chart. | |||||

 | YUM Yum! Brands, Inc. |
| Sector: Services & Goods | |
| SubSector: Restaurants | |
| MarketCap: 18033.3 Millions | |
| Recent Price: 141.81 Smart Investing & Trading Score: 100 | |
| Day Percent Change: 1.22% Day Change: 1.71 | |
| Week Change: 2.39% Year-to-date Change: 8.5% | |
| YUM Links: Profile News Message Board | |
| Charts:- Daily , Weekly | |
| Add YUM to Watchlist: View: Get Complete YUM Trend Analysis ➞ | |
 | HRB H&R Block, Inc. |
| Sector: Services & Goods | |
| SubSector: Personal Services | |
| MarketCap: 3052.45 Millions | |
| Recent Price: 47.93 Smart Investing & Trading Score: 90 | |
| Day Percent Change: 0.59% Day Change: 0.28 | |
| Week Change: 2.33% Year-to-date Change: -0.9% | |
| HRB Links: Profile News Message Board | |
| Charts:- Daily , Weekly | |
| Add HRB to Watchlist: View: Get Complete HRB Trend Analysis ➞ | |
 | CHH Choice Hotels International, Inc. |
| Sector: Services & Goods | |
| SubSector: Lodging | |
| MarketCap: 3427.56 Millions | |
| Recent Price: 119.06 Smart Investing & Trading Score: 42 | |
| Day Percent Change: 1.64% Day Change: 1.92 | |
| Week Change: 2.33% Year-to-date Change: 5.1% | |
| CHH Links: Profile News Message Board | |
| Charts:- Daily , Weekly | |
| Add CHH to Watchlist: View: Get Complete CHH Trend Analysis ➞ | |
 | NL NL Industries, Inc. |
| Sector: Services & Goods | |
| SubSector: Industrial Equipment Wholesale | |
| MarketCap: 126.258 Millions | |
| Recent Price: 7.99 Smart Investing & Trading Score: 53 | |
| Day Percent Change: 3.50% Day Change: 0.27 | |
| Week Change: 2.3% Year-to-date Change: 42.4% | |
| NL Links: Profile News Message Board | |
| Charts:- Daily , Weekly | |
| Add NL to Watchlist: View: Get Complete NL Trend Analysis ➞ | |
 | BFAM Bright Horizons Family Solutions Inc. |
| Sector: Services & Goods | |
| SubSector: Personal Services | |
| MarketCap: 5487.65 Millions | |
| Recent Price: 106.83 Smart Investing & Trading Score: 63 | |
| Day Percent Change: -0.73% Day Change: -0.79 | |
| Week Change: 2.28% Year-to-date Change: 13.4% | |
| BFAM Links: Profile News Message Board | |
| Charts:- Daily , Weekly | |
| Add BFAM to Watchlist: View: Get Complete BFAM Trend Analysis ➞ | |
 | WSM Williams-Sonoma, Inc. |
| Sector: Services & Goods | |
| SubSector: Home Furnishing Stores | |
| MarketCap: 3370.05 Millions | |
| Recent Price: 285.51 Smart Investing & Trading Score: 68 | |
| Day Percent Change: 0.15% Day Change: 0.44 | |
| Week Change: 2.26% Year-to-date Change: 41.5% | |
| WSM Links: Profile News Message Board | |
| Charts:- Daily , Weekly | |
| Add WSM to Watchlist: View: Get Complete WSM Trend Analysis ➞ | |
 | IHS IHS Holding Limited |
| Sector: Services & Goods | |
| SubSector: Telecom Services | |
| MarketCap: 3310 Millions | |
| Recent Price: 3.40 Smart Investing & Trading Score: 54 | |
| Day Percent Change: -0.44% Day Change: -0.02 | |
| Week Change: 2.26% Year-to-date Change: -26.2% | |
| IHS Links: Profile News Message Board | |
| Charts:- Daily , Weekly | |
| Add IHS to Watchlist: View: Get Complete IHS Trend Analysis ➞ | |
 | NWSA News Corporation |
| Sector: Services & Goods | |
| SubSector: Broadcasting - TV | |
| MarketCap: 5857.53 Millions | |
| Recent Price: 24.56 Smart Investing & Trading Score: 45 | |
| Day Percent Change: -0.20% Day Change: -0.05 | |
| Week Change: 2.25% Year-to-date Change: 0.0% | |
| NWSA Links: Profile News Message Board | |
| Charts:- Daily , Weekly | |
| Add NWSA to Watchlist: View: Get Complete NWSA Trend Analysis ➞ | |
 | BATRK The Liberty Braves Group |
| Sector: Services & Goods | |
| SubSector: Broadcasting - TV | |
| MarketCap: 638.363 Millions | |
| Recent Price: 38.12 Smart Investing & Trading Score: 42 | |
| Day Percent Change: -0.44% Day Change: -0.17 | |
| Week Change: 2.25% Year-to-date Change: -3.7% | |
| BATRK Links: Profile News Message Board | |
| Charts:- Daily , Weekly | |
| Add BATRK to Watchlist: View: Get Complete BATRK Trend Analysis ➞ | |
 | KFY Korn Ferry |
| Sector: Services & Goods | |
| SubSector: Staffing & Outsourcing Services | |
| MarketCap: 1534.28 Millions | |
| Recent Price: 62.65 Smart Investing & Trading Score: 68 | |
| Day Percent Change: -0.85% Day Change: -0.54 | |
| Week Change: 2.22% Year-to-date Change: 5.6% | |
| KFY Links: Profile News Message Board | |
| Charts:- Daily , Weekly | |
| Add KFY to Watchlist: View: Get Complete KFY Trend Analysis ➞ | |
 | IPG The Interpublic Group of Companies, Inc. |
| Sector: Services & Goods | |
| SubSector: Advertising Agencies | |
| MarketCap: 5730.55 Millions | |
| Recent Price: 31.40 Smart Investing & Trading Score: 67 | |
| Day Percent Change: 1.32% Day Change: 0.41 | |
| Week Change: 2.21% Year-to-date Change: -3.8% | |
| IPG Links: Profile News Message Board | |
| Charts:- Daily , Weekly | |
| Add IPG to Watchlist: View: Get Complete IPG Trend Analysis ➞ | |
 | WYNN Wynn Resorts, Limited |
| Sector: Services & Goods | |
| SubSector: Resorts & Casinos | |
| MarketCap: 6643.34 Millions | |
| Recent Price: 97.04 Smart Investing & Trading Score: 51 | |
| Day Percent Change: -1.80% Day Change: -1.78 | |
| Week Change: 2.16% Year-to-date Change: 6.5% | |
| WYNN Links: Profile News Message Board | |
| Charts:- Daily , Weekly | |
| Add WYNN to Watchlist: View: Get Complete WYNN Trend Analysis ➞ | |
 | UA Under Armour, Inc. |
| Sector: Services & Goods | |
| SubSector: Textile - Apparel Clothing | |
| MarketCap: 3926.93 Millions | |
| Recent Price: 6.61 Smart Investing & Trading Score: 50 | |
| Day Percent Change: -0.15% Day Change: -0.01 | |
| Week Change: 2.16% Year-to-date Change: -20.8% | |
| UA Links: Profile News Message Board | |
| Charts:- Daily , Weekly | |
| Add UA to Watchlist: View: Get Complete UA Trend Analysis ➞ | |
 | ACTG Acacia Research Corporation |
| Sector: Services & Goods | |
| SubSector: Business Services | |
| MarketCap: 112.782 Millions | |
| Recent Price: 4.99 Smart Investing & Trading Score: 68 | |
| Day Percent Change: 0.30% Day Change: 0.02 | |
| Week Change: 2.15% Year-to-date Change: 27.2% | |
| ACTG Links: Profile News Message Board | |
| Charts:- Daily , Weekly | |
| Add ACTG to Watchlist: View: Get Complete ACTG Trend Analysis ➞ | |
 | VVI Viad Corp |
| Sector: Services & Goods | |
| SubSector: Business Services | |
| MarketCap: 270.682 Millions | |
| Recent Price: 35.46 Smart Investing & Trading Score: 63 | |
| Day Percent Change: -0.59% Day Change: -0.21 | |
| Week Change: 2.13% Year-to-date Change: -2.0% | |
| VVI Links: Profile News Message Board | |
| Charts:- Daily , Weekly | |
| Add VVI to Watchlist: View: Get Complete VVI Trend Analysis ➞ | |
 | ARMK Aramark |
| Sector: Services & Goods | |
| SubSector: Specialty Eateries | |
| MarketCap: 5242.27 Millions | |
| Recent Price: 32.55 Smart Investing & Trading Score: 83 | |
| Day Percent Change: 1.40% Day Change: 0.45 | |
| Week Change: 2.13% Year-to-date Change: 15.8% | |
| ARMK Links: Profile News Message Board | |
| Charts:- Daily , Weekly | |
| Add ARMK to Watchlist: View: Get Complete ARMK Trend Analysis ➞ | |
 | KELYA Kelly Services, Inc. |
| Sector: Services & Goods | |
| SubSector: Staffing & Outsourcing Services | |
| MarketCap: 587.228 Millions | |
| Recent Price: 24.21 Smart Investing & Trading Score: 70 | |
| Day Percent Change: 1.38% Day Change: 0.33 | |
| Week Change: 2.11% Year-to-date Change: 12.0% | |
| KELYA Links: Profile News Message Board | |
| Charts:- Daily , Weekly | |
| Add KELYA to Watchlist: View: Get Complete KELYA Trend Analysis ➞ | |
 | VMAR Vision Marine Technologies Inc. |
| Sector: Services & Goods | |
| SubSector: Leisure | |
| MarketCap: 99027 Millions | |
| Recent Price: 0.57 Smart Investing & Trading Score: 47 | |
| Day Percent Change: 0.00% Day Change: 0.00 | |
| Week Change: 2.11% Year-to-date Change: -47.4% | |
| VMAR Links: Profile News Message Board | |
| Charts:- Daily , Weekly | |
| Add VMAR to Watchlist: View: Get Complete VMAR Trend Analysis ➞ | |
 | TSCO Tractor Supply Company |
| Sector: Services & Goods | |
| SubSector: Specialty Retail, Other | |
| MarketCap: 9692.94 Millions | |
| Recent Price: 258.10 Smart Investing & Trading Score: 90 | |
| Day Percent Change: 0.84% Day Change: 2.14 | |
| Week Change: 2.1% Year-to-date Change: 20.0% | |
| TSCO Links: Profile News Message Board | |
| Charts:- Daily , Weekly | |
| Add TSCO to Watchlist: View: Get Complete TSCO Trend Analysis ➞ | |
 | LAUR Laureate Education, Inc. |
| Sector: Services & Goods | |
| SubSector: Education & Training Services | |
| MarketCap: 2258.56 Millions | |
| Recent Price: 14.34 Smart Investing & Trading Score: 48 | |
| Day Percent Change: 0.60% Day Change: 0.09 | |
| Week Change: 2.1% Year-to-date Change: 4.6% | |
| LAUR Links: Profile News Message Board | |
| Charts:- Daily , Weekly | |
| Add LAUR to Watchlist: View: Get Complete LAUR Trend Analysis ➞ | |
 | OLLI Ollie s Bargain Outlet Holdings, Inc. |
| Sector: Services & Goods | |
| SubSector: Discount, Variety Stores | |
| MarketCap: 2904.62 Millions | |
| Recent Price: 74.75 Smart Investing & Trading Score: 90 | |
| Day Percent Change: -0.62% Day Change: -0.47 | |
| Week Change: 2.1% Year-to-date Change: -1.5% | |
| OLLI Links: Profile News Message Board | |
| Charts:- Daily , Weekly | |
| Add OLLI to Watchlist: View: Get Complete OLLI Trend Analysis ➞ | |
 | COST Costco Wholesale Corporation |
| Sector: Services & Goods | |
| SubSector: Discount, Variety Stores | |
| MarketCap: 136355 Millions | |
| Recent Price: 724.17 Smart Investing & Trading Score: 80 | |
| Day Percent Change: 0.21% Day Change: 1.49 | |
| Week Change: 2.07% Year-to-date Change: 9.7% | |
| COST Links: Profile News Message Board | |
| Charts:- Daily , Weekly | |
| Add COST to Watchlist: View: Get Complete COST Trend Analysis ➞ | |
 | TJX The TJX Companies, Inc. |
| Sector: Services & Goods | |
| SubSector: Department Stores | |
| MarketCap: 50656.2 Millions | |
| Recent Price: 95.28 Smart Investing & Trading Score: 52 | |
| Day Percent Change: 0.83% Day Change: 0.78 | |
| Week Change: 2.06% Year-to-date Change: 1.6% | |
| TJX Links: Profile News Message Board | |
| Charts:- Daily , Weekly | |
| Add TJX to Watchlist: View: Get Complete TJX Trend Analysis ➞ | |
 | BATRA The Liberty Braves Group |
| Sector: Services & Goods | |
| SubSector: Broadcasting - TV | |
| MarketCap: 18873.5 Millions | |
| Recent Price: 41.11 Smart Investing & Trading Score: 42 | |
| Day Percent Change: -0.19% Day Change: -0.08 | |
| Week Change: 2.04% Year-to-date Change: -3.9% | |
| BATRA Links: Profile News Message Board | |
| Charts:- Daily , Weekly | |
| Add BATRA to Watchlist: View: Get Complete BATRA Trend Analysis ➞ | |
 | PSNYW Polestar Automotive Holding UK PLC |
| Sector: Services & Goods | |
| SubSector: Auto Manufacturers | |
| MarketCap: 1450 Millions | |
| Recent Price: 0.15 Smart Investing & Trading Score: 25 | |
| Day Percent Change: -3.23% Day Change: -0.01 | |
| Week Change: 2.04% Year-to-date Change: -38.1% | |
| PSNYW Links: Profile News Message Board | |
| Charts:- Daily , Weekly | |
| Add PSNYW to Watchlist: View: Get Complete PSNYW Trend Analysis ➞ | |
| For tabular summary view of above stock list: Summary View ➞ 0 - 25 , 25 - 50 , 50 - 75 , 75 - 100 , 100 - 125 , 125 - 150 , 150 - 175 , 175 - 200 , 200 - 225 , 225 - 250 , 250 - 275 , 275 - 300 , 300 - 325 , 325 - 350 , 350 - 375 , 375 - 400 , 400 - 425 , 425 - 450 , 450 - 475 | ||
| Click To Change The Sort Order: By Market Cap or Company Size Performance: Year-to-date, Week and Day | |
| Select Chart Type: | ||
|
Best Stocks Today 12Stocks.com |
© 2024 12Stocks.com Terms & Conditions Privacy Contact Us
All Information Provided Only For Education And Not To Be Used For Investing or Trading. See Terms & Conditions


One More Thing ... Get Best Stocks Delivered Daily!
Never Ever Miss A Move With Our Top Ten Stocks Lists
Find Best Stocks In Any Market - Bull or Bear Market
Take A Peek At Our Top Ten Stocks Lists: Daily, Weekly, Year-to-Date & Top Trends
Find Best Stocks In Any Market - Bull or Bear Market
Take A Peek At Our Top Ten Stocks Lists: Daily, Weekly, Year-to-Date & Top Trends
Consumer Services Stocks With Best Up Trends [0-bearish to 100-bullish]: Yatsen Holding[100], 1[100], Alibaba [100], MINISO [100], Omnicom [100], Napco Security[100], ASGN [100], IMAX [100], Yum! Brands[100], Dillard s[100], Carriage Services[100]
Best Consumer Services Stocks Year-to-Date:
U Power[3013.84%], Vroom [1807.84%], Yatsen Holding[479.55%], Fluent [308.96%], Codere Online[134.25%], Research[105.46%], Sweetgreen [92.21%], RealReal [71.64%], PaySign [60.36%], DXP Enterprises[54.12%], Bright Scholar[52%] Best Consumer Services Stocks This Week:
Chicken Soup[307.5%], Hibbett Sports[21.56%], Golden Heaven[20.85%], Yatsen Holding[17.29%], Baozun [14.44%], Jumia Technologies[14.21%], Zumiez [13.45%], Ameresco [13.24%], 1[12.87%], Pinduoduo [12.42%], K12 [11.85%] Best Consumer Services Stocks Daily:
Chicken Soup[288.10%], Golden Heaven[11.81%], K12 [8.64%], Yatsen Holding[7.89%], GameStop [7.58%], Dada Nexus[7.53%], U Power[7.31%], Yunji [7.26%], 1[7.23%], Value Line[6.81%], Watsco [6.54%]