
 Login Sign Up


| |||||
 |  | ||||

| 12Stocks.com Market Intelligence |
Best Consumer Services Stocks
| In a hurry? Services & Goods Stocks: Performance Trends Table, Stock Charts
Sort Consumer Services: Daily, Weekly, Year-to-Date, Market Cap & Trends. Filter Services & Goods stocks list by size: All Large Mid-Range Small |
| 12Stocks.com Consumer Services Stocks Performances & Trends Daily | |||||||||
|
|  The overall Smart Investing & Trading Score is 51 (0-bearish to 100-bullish) which puts Consumer Services sector in short term neutral trend. The Smart Investing & Trading Score from previous trading session is 58 and hence a deterioration of trend.
| ||||||||
Here are the Smart Investing & Trading Scores of the most requested Consumer Services stocks at 12Stocks.com (click stock name for detailed review):
|


| Consider signing up for our daily 12Stocks.com "Best Stocks Newsletter". You will never ever miss a big stock move again! |
| 12Stocks.com: Investing in Consumer Services sector with Stocks | |
|
The following table helps investors and traders sort through current performance and trends (as measured by Smart Investing & Trading Score) of various
stocks in the Consumer Services sector. Quick View: Move mouse or cursor over stock symbol (ticker) to view short-term Technical chart and over stock name to view long term chart. Click on  to add stock symbol to your watchlist and to add stock symbol to your watchlist and  to view watchlist. Click on any ticker or stock name for detailed market intelligence report for that stock. to view watchlist. Click on any ticker or stock name for detailed market intelligence report for that stock. |
12Stocks.com Performance of Stocks in Consumer Services Sector
| Ticker | Stock Name | Watchlist | Category | Recent Price | Smart Investing & Trading Score | Change % | YTD Change% |
| BH | Biglari |   | Restaurants | 201.36 | 76 | 0.58% | 22.09% |
| CBZ | CBIZ | | Services | 75.53 | 83 | -3.57% | 20.67% |
| MG | Mistras | | Security | 8.82 | 51 | -1.23% | 20.49% |
| HUYA | HUYA | | Entertainment | 4.41 | 41 | -4.34% | 20.49% |
| DPZ | Domino s | | Restaurants | 494.77 | 88 | 1.45% | 20.02% |
| INSW | Seaways | | Services | 54.58 | 40 | 1.87% | 20.01% |
| RSVR | Reservoir Media | | Entertainment | 8.54 | 93 | 2.89% | 19.94% |
| HIBB | Hibbett Sports | | Retail | 86.10 | 93 | -0.47% | 19.55% |
| VAC | Marriott Vacations | | Casinos | 101.03 | 88 | -2.07% | 19.01% |
| VSEC | VSE | | Services | 76.88 | 69 | -2.20% | 18.99% |
| UTI | Universal Technical | | Education | 14.89 | 56 | 1.85% | 18.93% |
| HTHT | Huazhu | | Lodging | 39.74 | 80 | 1.48% | 18.84% |
| FWRG | First Watch | | Restaurants | 23.63 | 80 | 2.45% | 18.56% |
| MUSA | Murphy USA | | Retail | 420.54 | 85 | -0.14% | 17.94% |
| KBR | KBR | | Services | 65.24 | 88 | 1.34% | 17.74% |
| EBAY | eBay | | Retail | 51.34 | 54 | 0.31% | 17.70% |
| ACVA | ACV Auctions | | Auto & Truck Dealerships | 17.72 | 53 | -2.72% | 17.66% |
| DIBS | 1stdibs.Com | | Internet Retail | 5.51 | 63 | 3.18% | 17.48% |
| KAR | KAR Auction | | Retail | 17.38 | 83 | -0.69% | 17.35% |
| RVLV | Revolve | | Retail | 19.43 | 68 | -1.87% | 17.19% |
| ONON | On Holding | | Footwear & Accessories | 31.94 | 34 | -0.84% | 17.08% |
| MCK | McKesson | | Pharmacy | 539.94 | 78 | 0.84% | 16.62% |
| EM | Smart Share | | Services | 0.60 | 71 | -4.76% | 16.50% |
| GPC | Genuine Parts | | Auto Parts | 161.07 | 68 | -0.45% | 16.30% |
| IMAX | IMAX | | Entertainment | 17.46 | 63 | -1.13% | 16.25% |
| For chart view version of above stock list: Chart View ➞ 0 - 25 , 25 - 50 , 50 - 75 , 75 - 100 , 100 - 125 , 125 - 150 , 150 - 175 , 175 - 200 , 200 - 225 , 225 - 250 , 250 - 275 , 275 - 300 , 300 - 325 , 325 - 350 , 350 - 375 , 375 - 400 , 400 - 425 , 425 - 450 , 450 - 475 | ||
 | Click To Change The Sort Order: By Market Cap or Company Size Performance: Year-to-date, Week and Day |  |
|
Get the most comprehensive stock market coverage daily at 12Stocks.com ➞ Best Stocks Today ➞ Best Stocks Weekly ➞ Best Stocks Year-to-Date ➞ Best Stocks Trends ➞  Best Stocks Today 12Stocks.com Best Nasdaq Stocks ➞ Best S&P 500 Stocks ➞ Best Tech Stocks ➞ Best Biotech Stocks ➞ |
| Detailed Overview of Consumer Services Stocks |
| Consumer Services Technical Overview, Leaders & Laggards, Top Consumer Services ETF Funds & Detailed Consumer Services Stocks List, Charts, Trends & More |
| Consumer Services Sector: Technical Analysis, Trends & YTD Performance | |
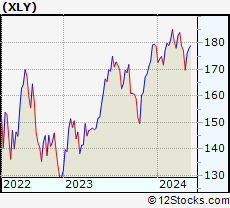
| Consumer Services sector is composed of stocks
from retail, entertainment, media/publishing, consumer goods
and services subsectors. Consumer Services sector, as represented by XLY, an exchange-traded fund [ETF] that holds basket of Consumer Services stocks (e.g, Walmart, Alibaba) is down by -2.5% and is currently underperforming the overall market by -7.66% year-to-date. Below is a quick view of Technical charts and trends: |
|
 XLY Weekly Chart |
|
| Long Term Trend: Good | |
| Medium Term Trend: Not Good | |
 XLY Daily Chart |
|
| Short Term Trend: Very Good | |
| Overall Trend Score: 51 | |
| YTD Performance: -2.5% | |
| **Trend Scores & Views Are Only For Educational Purposes And Not For Investing | |
| 12Stocks.com: Top Performing Consumer Services Sector Stocks | ||||||||||||||||||||||||||||||||||||||||||||||||
 The top performing Consumer Services sector stocks year to date are
Now, more recently, over last week, the top performing Consumer Services sector stocks on the move are


|
||||||||||||||||||||||||||||||||||||||||||||||||
| 12Stocks.com: Investing in Consumer Services Sector using Exchange Traded Funds | |
|
The following table shows list of key exchange traded funds (ETF) that
help investors track Consumer Services Index. For detailed view, check out our ETF Funds section of our website. Quick View: Move mouse or cursor over ETF symbol (ticker) to view short-term Technical chart and over ETF name to view long term chart. Click on ticker or stock name for detailed view. Click on to add stock symbol to your watchlist and to view watchlist. |
12Stocks.com List of ETFs that track Consumer Services Index
| Ticker | ETF Name | Watchlist | Recent Price | Smart Investing & Trading Score | Change % | Week % | Year-to-date % |
| XLY | Consumer Discret Sel | | 174.34 | 51 | 0.09 | 2.7 | -2.5% |
| RTH | Retail | | 198.66 | 44 | -0.57 | 0.02 | 5.54% |
| IYC | Consumer Services | | 77.87 | 36 | 0.05 | 2.1 | 2.77% |
| XRT | Retail | | 72.21 | 51 | -0.43 | 1.46 | -0.15% |
| IYK | Consumer Goods | | 66.98 | 75 | -0.33 | 1.78 | 4.81% |
| UCC | Consumer Services | | 33.25 | 66 | -0.36 | 5.3 | -7.4% |
| RETL | Retail Bull 3X | | 8.47 | 48 | -1.40 | 4.31 | -7.13% |
| RXI | Globl Consumer Discretionary | | 159.18 | 36 | -0.69 | 1.29 | 0.08% |
| SCC | Short Consumer Services | | 16.06 | 42 | -0.37 | -5.27 | 4.8% |
| UGE | Consumer Goods | | 17.12 | 90 | -0.70 | 2.96 | 8.76% |
| 12Stocks.com: Charts, Trends, Fundamental Data and Performances of Consumer Services Stocks | |
|
We now take in-depth look at all Consumer Services stocks including charts, multi-period performances and overall trends (as measured by Smart Investing & Trading Score). One can sort Consumer Services stocks (click link to choose) by Daily, Weekly and by Year-to-Date performances. Also, one can sort by size of the company or by market capitalization. |
| Select Your Default Chart Type: | |||||
| |||||
| Click on stock symbol or name for detailed view. Click on to add stock symbol to your watchlist and to view watchlist. Quick View: Move mouse or cursor over "Daily" to quickly view daily Technical stock chart and over "Weekly" to view weekly Technical stock chart. | |||||

 | BH Biglari Holdings Inc. |
| Sector: Services & Goods | |
| SubSector: Restaurants | |
| MarketCap: 149.07 Millions | |
| Recent Price: 201.36 Smart Investing & Trading Score: 76 | |
| Day Percent Change: 0.58% Day Change: 1.17 | |
| Week Change: 0.82% Year-to-date Change: 22.1% | |
| BH Links: Profile News Message Board | |
| Charts:- Daily , Weekly | |
| Add BH to Watchlist: View: Get Complete BH Trend Analysis ➞ | |
 | CBZ CBIZ, Inc. |
| Sector: Services & Goods | |
| SubSector: Business Services | |
| MarketCap: 1121.32 Millions | |
| Recent Price: 75.53 Smart Investing & Trading Score: 83 | |
| Day Percent Change: -3.57% Day Change: -2.80 | |
| Week Change: 0.81% Year-to-date Change: 20.7% | |
| CBZ Links: Profile News Message Board | |
| Charts:- Daily , Weekly | |
| Add CBZ to Watchlist: View: Get Complete CBZ Trend Analysis ➞ | |
 | MG Mistras Group, Inc. |
| Sector: Services & Goods | |
| SubSector: Security & Protection Services | |
| MarketCap: 136.903 Millions | |
| Recent Price: 8.82 Smart Investing & Trading Score: 51 | |
| Day Percent Change: -1.23% Day Change: -0.11 | |
| Week Change: -2.86% Year-to-date Change: 20.5% | |
| MG Links: Profile News Message Board | |
| Charts:- Daily , Weekly | |
| Add MG to Watchlist: View: Get Complete MG Trend Analysis ➞ | |
 | HUYA HUYA Inc. |
| Sector: Services & Goods | |
| SubSector: Entertainment - Diversified | |
| MarketCap: 3358.17 Millions | |
| Recent Price: 4.41 Smart Investing & Trading Score: 41 | |
| Day Percent Change: -4.34% Day Change: -0.20 | |
| Week Change: 0% Year-to-date Change: 20.5% | |
| HUYA Links: Profile News Message Board | |
| Charts:- Daily , Weekly | |
| Add HUYA to Watchlist: View: Get Complete HUYA Trend Analysis ➞ | |
 | DPZ Domino s Pizza, Inc. |
| Sector: Services & Goods | |
| SubSector: Restaurants | |
| MarketCap: 12166 Millions | |
| Recent Price: 494.77 Smart Investing & Trading Score: 88 | |
| Day Percent Change: 1.45% Day Change: 7.06 | |
| Week Change: 4.48% Year-to-date Change: 20.0% | |
| DPZ Links: Profile News Message Board | |
| Charts:- Daily , Weekly | |
| Add DPZ to Watchlist: View: Get Complete DPZ Trend Analysis ➞ | |
 | INSW International Seaways, Inc. |
| Sector: Services & Goods | |
| SubSector: Business Services | |
| MarketCap: 521.582 Millions | |
| Recent Price: 54.58 Smart Investing & Trading Score: 40 | |
| Day Percent Change: 1.87% Day Change: 1.00 | |
| Week Change: 2.92% Year-to-date Change: 20.0% | |
| INSW Links: Profile News Message Board | |
| Charts:- Daily , Weekly | |
| Add INSW to Watchlist: View: Get Complete INSW Trend Analysis ➞ | |
 | RSVR Reservoir Media, Inc. |
| Sector: Services & Goods | |
| SubSector: Entertainment | |
| MarketCap: 389 Millions | |
| Recent Price: 8.54 Smart Investing & Trading Score: 93 | |
| Day Percent Change: 2.89% Day Change: 0.24 | |
| Week Change: 6.75% Year-to-date Change: 19.9% | |
| RSVR Links: Profile News Message Board | |
| Charts:- Daily , Weekly | |
| Add RSVR to Watchlist: View: Get Complete RSVR Trend Analysis ➞ | |
 | HIBB Hibbett Sports, Inc. |
| Sector: Services & Goods | |
| SubSector: Sporting Goods Stores | |
| MarketCap: 183 Millions | |
| Recent Price: 86.10 Smart Investing & Trading Score: 93 | |
| Day Percent Change: -0.47% Day Change: -0.41 | |
| Week Change: 21.03% Year-to-date Change: 19.6% | |
| HIBB Links: Profile News Message Board | |
| Charts:- Daily , Weekly | |
| Add HIBB to Watchlist: View: Get Complete HIBB Trend Analysis ➞ | |
 | VAC Marriott Vacations Worldwide Corporation |
| Sector: Services & Goods | |
| SubSector: Resorts & Casinos | |
| MarketCap: 2173.54 Millions | |
| Recent Price: 101.03 Smart Investing & Trading Score: 88 | |
| Day Percent Change: -2.07% Day Change: -2.14 | |
| Week Change: 3.1% Year-to-date Change: 19.0% | |
| VAC Links: Profile News Message Board | |
| Charts:- Daily , Weekly | |
| Add VAC to Watchlist: View: Get Complete VAC Trend Analysis ➞ | |
 | VSEC VSE Corporation |
| Sector: Services & Goods | |
| SubSector: Technical Services | |
| MarketCap: 183.61 Millions | |
| Recent Price: 76.88 Smart Investing & Trading Score: 69 | |
| Day Percent Change: -2.20% Day Change: -1.73 | |
| Week Change: 1.59% Year-to-date Change: 19.0% | |
| VSEC Links: Profile News Message Board | |
| Charts:- Daily , Weekly | |
| Add VSEC to Watchlist: View: Get Complete VSEC Trend Analysis ➞ | |
 | UTI Universal Technical Institute, Inc. |
| Sector: Services & Goods | |
| SubSector: Education & Training Services | |
| MarketCap: 163.506 Millions | |
| Recent Price: 14.89 Smart Investing & Trading Score: 56 | |
| Day Percent Change: 1.85% Day Change: 0.27 | |
| Week Change: 2.13% Year-to-date Change: 18.9% | |
| UTI Links: Profile News Message Board | |
| Charts:- Daily , Weekly | |
| Add UTI to Watchlist: View: Get Complete UTI Trend Analysis ➞ | |
 | HTHT Huazhu Group Limited |
| Sector: Services & Goods | |
| SubSector: Lodging | |
| MarketCap: 9164.46 Millions | |
| Recent Price: 39.74 Smart Investing & Trading Score: 80 | |
| Day Percent Change: 1.48% Day Change: 0.58 | |
| Week Change: 7.73% Year-to-date Change: 18.8% | |
| HTHT Links: Profile News Message Board | |
| Charts:- Daily , Weekly | |
| Add HTHT to Watchlist: View: Get Complete HTHT Trend Analysis ➞ | |
 | FWRG First Watch Restaurant Group, Inc. |
| Sector: Services & Goods | |
| SubSector: Restaurants | |
| MarketCap: 1000 Millions | |
| Recent Price: 23.63 Smart Investing & Trading Score: 80 | |
| Day Percent Change: 2.45% Day Change: 0.56 | |
| Week Change: 5.96% Year-to-date Change: 18.6% | |
| FWRG Links: Profile News Message Board | |
| Charts:- Daily , Weekly | |
| Add FWRG to Watchlist: View: Get Complete FWRG Trend Analysis ➞ | |
 | MUSA Murphy USA Inc. |
| Sector: Services & Goods | |
| SubSector: Specialty Retail, Other | |
| MarketCap: 3133.14 Millions | |
| Recent Price: 420.54 Smart Investing & Trading Score: 85 | |
| Day Percent Change: -0.14% Day Change: -0.57 | |
| Week Change: 0.79% Year-to-date Change: 17.9% | |
| MUSA Links: Profile News Message Board | |
| Charts:- Daily , Weekly | |
| Add MUSA to Watchlist: View: Get Complete MUSA Trend Analysis ➞ | |
 | KBR KBR, Inc. |
| Sector: Services & Goods | |
| SubSector: Technical Services | |
| MarketCap: 2526.1 Millions | |
| Recent Price: 65.24 Smart Investing & Trading Score: 88 | |
| Day Percent Change: 1.34% Day Change: 0.86 | |
| Week Change: 4.1% Year-to-date Change: 17.7% | |
| KBR Links: Profile News Message Board | |
| Charts:- Daily , Weekly | |
| Add KBR to Watchlist: View: Get Complete KBR Trend Analysis ➞ | |
 | EBAY eBay Inc. |
| Sector: Services & Goods | |
| SubSector: Specialty Retail, Other | |
| MarketCap: 23152.3 Millions | |
| Recent Price: 51.34 Smart Investing & Trading Score: 54 | |
| Day Percent Change: 0.31% Day Change: 0.16 | |
| Week Change: 1.89% Year-to-date Change: 17.7% | |
| EBAY Links: Profile News Message Board | |
| Charts:- Daily , Weekly | |
| Add EBAY to Watchlist: View: Get Complete EBAY Trend Analysis ➞ | |
 | ACVA ACV Auctions Inc. |
| Sector: Services & Goods | |
| SubSector: Auto & Truck Dealerships | |
| MarketCap: 2680 Millions | |
| Recent Price: 17.72 Smart Investing & Trading Score: 53 | |
| Day Percent Change: -2.72% Day Change: -0.50 | |
| Week Change: 2.37% Year-to-date Change: 17.7% | |
| ACVA Links: Profile News Message Board | |
| Charts:- Daily , Weekly | |
| Add ACVA to Watchlist: View: Get Complete ACVA Trend Analysis ➞ | |
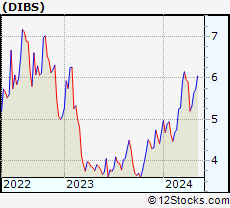 | DIBS 1stdibs.Com, Inc. |
| Sector: Services & Goods | |
| SubSector: Internet Retail | |
| MarketCap: 149 Millions | |
| Recent Price: 5.51 Smart Investing & Trading Score: 63 | |
| Day Percent Change: 3.18% Day Change: 0.17 | |
| Week Change: 3.57% Year-to-date Change: 17.5% | |
| DIBS Links: Profile News Message Board | |
| Charts:- Daily , Weekly | |
| Add DIBS to Watchlist: View: Get Complete DIBS Trend Analysis ➞ | |
 | KAR KAR Auction Services, Inc. |
| Sector: Services & Goods | |
| SubSector: Specialty Retail, Other | |
| MarketCap: 1709.54 Millions | |
| Recent Price: 17.38 Smart Investing & Trading Score: 83 | |
| Day Percent Change: -0.69% Day Change: -0.12 | |
| Week Change: 2.3% Year-to-date Change: 17.4% | |
| KAR Links: Profile News Message Board | |
| Charts:- Daily , Weekly | |
| Add KAR to Watchlist: View: Get Complete KAR Trend Analysis ➞ | |
 | RVLV Revolve Group, Inc. |
| Sector: Services & Goods | |
| SubSector: Specialty Retail, Other | |
| MarketCap: 652.244 Millions | |
| Recent Price: 19.43 Smart Investing & Trading Score: 68 | |
| Day Percent Change: -1.87% Day Change: -0.37 | |
| Week Change: 1.2% Year-to-date Change: 17.2% | |
| RVLV Links: Profile News Message Board | |
| Charts:- Daily , Weekly | |
| Add RVLV to Watchlist: View: Get Complete RVLV Trend Analysis ➞ | |
 | ONON On Holding AG |
| Sector: Services & Goods | |
| SubSector: Footwear & Accessories | |
| MarketCap: 10600 Millions | |
| Recent Price: 31.94 Smart Investing & Trading Score: 34 | |
| Day Percent Change: -0.84% Day Change: -0.27 | |
| Week Change: 1.14% Year-to-date Change: 17.1% | |
| ONON Links: Profile News Message Board | |
| Charts:- Daily , Weekly | |
| Add ONON to Watchlist: View: Get Complete ONON Trend Analysis ➞ | |
 | MCK McKesson Corporation |
| Sector: Services & Goods | |
| SubSector: Drugs Wholesale | |
| MarketCap: 24096.7 Millions | |
| Recent Price: 539.94 Smart Investing & Trading Score: 78 | |
| Day Percent Change: 0.84% Day Change: 4.52 | |
| Week Change: 2.88% Year-to-date Change: 16.6% | |
| MCK Links: Profile News Message Board | |
| Charts:- Daily , Weekly | |
| Add MCK to Watchlist: View: Get Complete MCK Trend Analysis ➞ | |
 | EM Smart Share Global Limited |
| Sector: Services & Goods | |
| SubSector: Personal Services | |
| MarketCap: 238 Millions | |
| Recent Price: 0.60 Smart Investing & Trading Score: 71 | |
| Day Percent Change: -4.76% Day Change: -0.03 | |
| Week Change: -6.25% Year-to-date Change: 16.5% | |
| EM Links: Profile News Message Board | |
| Charts:- Daily , Weekly | |
| Add EM to Watchlist: View: Get Complete EM Trend Analysis ➞ | |
 | GPC Genuine Parts Company |
| Sector: Services & Goods | |
| SubSector: Auto Parts Stores | |
| MarketCap: 8605.9 Millions | |
| Recent Price: 161.07 Smart Investing & Trading Score: 68 | |
| Day Percent Change: -0.45% Day Change: -0.73 | |
| Week Change: -0.81% Year-to-date Change: 16.3% | |
| GPC Links: Profile News Message Board | |
| Charts:- Daily , Weekly | |
| Add GPC to Watchlist: View: Get Complete GPC Trend Analysis ➞ | |
 | IMAX IMAX Corporation |
| Sector: Services & Goods | |
| SubSector: Entertainment - Diversified | |
| MarketCap: 874.237 Millions | |
| Recent Price: 17.46 Smart Investing & Trading Score: 63 | |
| Day Percent Change: -1.13% Day Change: -0.20 | |
| Week Change: 1.93% Year-to-date Change: 16.3% | |
| IMAX Links: Profile News Message Board | |
| Charts:- Daily , Weekly | |
| Add IMAX to Watchlist: View: Get Complete IMAX Trend Analysis ➞ | |
| For tabular summary view of above stock list: Summary View ➞ 0 - 25 , 25 - 50 , 50 - 75 , 75 - 100 , 100 - 125 , 125 - 150 , 150 - 175 , 175 - 200 , 200 - 225 , 225 - 250 , 250 - 275 , 275 - 300 , 300 - 325 , 325 - 350 , 350 - 375 , 375 - 400 , 400 - 425 , 425 - 450 , 450 - 475 | ||
| Click To Change The Sort Order: By Market Cap or Company Size Performance: Year-to-date, Week and Day | |
| Select Chart Type: | ||
|
Best Stocks Today 12Stocks.com |
© 2024 12Stocks.com Terms & Conditions Privacy Contact Us
All Information Provided Only For Education And Not To Be Used For Investing or Trading. See Terms & Conditions


One More Thing ... Get Best Stocks Delivered Daily!
Never Ever Miss A Move With Our Top Ten Stocks Lists
Find Best Stocks In Any Market - Bull or Bear Market
Take A Peek At Our Top Ten Stocks Lists: Daily, Weekly, Year-to-Date & Top Trends
Find Best Stocks In Any Market - Bull or Bear Market
Take A Peek At Our Top Ten Stocks Lists: Daily, Weekly, Year-to-Date & Top Trends
Consumer Services Stocks With Best Up Trends [0-bearish to 100-bullish]: Ardagh Metal[100], Chipotle Mexican[100], Churchill Downs[100], Yatsen Holding[100], Tractor Supply[100], Omnicom [100], Dada Nexus[100], FTI Consulting[100], Avnet [100], Alibaba [100], 1[100]
Best Consumer Services Stocks Year-to-Date:
U Power[2852.01%], Vroom [1804.53%], Yatsen Holding[502.79%], Fluent [298.51%], Codere Online[133.9%], Research[104.68%], Sweetgreen [101.42%], RealReal [69.4%], PaySign [56.43%], Bright Scholar[56%], Spotify Technology[53.81%] Best Consumer Services Stocks This Week:
Chicken Soup[210%], Yatsen Holding[21.99%], Hibbett Sports[21.03%], Strategic Education[19.29%], Noodles & [18.07%], K12 [17.39%], TAL Education[16.8%], Sonic Automotive[16.56%], Golden Heaven[15.91%], Ardagh Metal[14.9%], Altisource Portfolio[13.33%] Best Consumer Services Stocks Daily:
Strategic Education[16.28%], Boqii Holding[15.69%], Sonic Automotive[10.86%], Altisource Portfolio[10.00%], TAL Education[8.89%], Ardagh Metal[8.82%], MOGU [8.43%], TransUnion [8.17%], Noodles & [8.08%], Chipotle Mexican[6.33%], Soho House[6.30%]