
 Login Sign Up


| |||||
 |  | ||||

| 12Stocks.com Market Intelligence |
Best Consumer Services Stocks
| In a hurry? Services & Goods Stocks: Performance Trends Table, Stock Charts
Sort Consumer Services: Daily, Weekly, Year-to-Date, Market Cap & Trends. Filter Services & Goods stocks list by size: All Large Mid-Range Small |
| 12Stocks.com Consumer Services Stocks Performances & Trends Daily | |||||||||
|
|  The overall Smart Investing & Trading Score is 23 (0-bearish to 100-bullish) which puts Consumer Services sector in short term bearish to neutral trend. The Smart Investing & Trading Score from previous trading session is 13 and hence an improvement of trend.
| ||||||||
Here are the Smart Investing & Trading Scores of the most requested Consumer Services stocks at 12Stocks.com (click stock name for detailed review):
|


| Consider signing up for our daily 12Stocks.com "Best Stocks Newsletter". You will never ever miss a big stock move again! |
| 12Stocks.com: Investing in Consumer Services sector with Stocks | |
|
The following table helps investors and traders sort through current performance and trends (as measured by Smart Investing & Trading Score) of various
stocks in the Consumer Services sector. Quick View: Move mouse or cursor over stock symbol (ticker) to view short-term Technical chart and over stock name to view long term chart. Click on  to add stock symbol to your watchlist and to add stock symbol to your watchlist and  to view watchlist. Click on any ticker or stock name for detailed market intelligence report for that stock. to view watchlist. Click on any ticker or stock name for detailed market intelligence report for that stock. |
12Stocks.com Performance of Stocks in Consumer Services Sector
| Ticker | Stock Name | Watchlist | Category | Recent Price | Smart Investing & Trading Score | Change % | YTD Change% |
| GDEN | Golden Entertainment |   | Casinos | 33.76 | 10 | 0.99% | -15.45% |
| ULTA | Ulta Beauty | | Retail | 413.11 | 10 | -2.82% | -15.69% |
| GLBE | Global-e Online | | Internet Retail | 33.29 | 28 | -3.59% | -15.89% |
| RH | RH | | Retail | 244.88 | 27 | -0.17% | -15.99% |
| TV | Grupo Televisa | | Broadcasting | 2.81 | 10 | -1.58% | -16.02% |
| ETSY | Etsy | | Retail | 67.76 | 76 | 0.62% | -16.40% |
| NATH | Nathan s | | Restaurants | 64.95 | 18 | 0.00% | -16.74% |
| QUAD | Quad/Graphics | | Services | 4.51 | 17 | 0.00% | -16.79% |
| FLWS | 1-800-FLOWERS.COM | | Retail | 8.91 | 17 | 1.60% | -17.35% |
| GENI | Genius Sports | | Internet Content & Information | 5.12 | 25 | -2.29% | -17.75% |
| MGA | Magna | | Auto Parts | 48.22 | 10 | 0.76% | -18.39% |
| CZR | Caesars Entertainment | | Casinos | 38.13 | 0 | 0.39% | -18.66% |
| CCO | Clear Channel | | Marketing | 1.48 | 25 | 2.78% | -18.68% |
| KSS | Kohl s | | Department | 23.29 | 32 | 1.93% | -18.79% |
| PZZA | Papa John | | Restaurants | 61.83 | 17 | 0.77% | -18.90% |
| STG | Sunlands Technology | | Education | 8.21 | 0 | 2.50% | -19.27% |
| DLTH | Duluth | | Apparel | 4.34 | 10 | 0.46% | -19.33% |
| PLNT | Planet Fitness | | Sporting | 58.88 | 10 | 0.39% | -19.34% |
| NVEE | NV5 Global | | Services | 89.39 | 0 | -0.08% | -19.56% |
| RHI | Robert Half | | Staffing | 70.65 | 18 | 1.57% | -19.64% |
| COE | China Online | | Education | 6.42 | 20 | -2.73% | -20.06% |
| NEWT | Newtek Business | | Services | 11.02 | 17 | 1.29% | -20.14% |
| CHUY | Chuy s | | Restaurants | 30.45 | 10 | 0.05% | -20.36% |
| STBX | Starbox | | Internet Content & Information | 0.21 | 30 | -0.33% | -20.39% |
| LAD | Lithia Motors | | Automobile | 261.28 | 25 | 0.36% | -20.65% |
| For chart view version of above stock list: Chart View ➞ 0 - 25 , 25 - 50 , 50 - 75 , 75 - 100 , 100 - 125 , 125 - 150 , 150 - 175 , 175 - 200 , 200 - 225 , 225 - 250 , 250 - 275 , 275 - 300 , 300 - 325 , 325 - 350 , 350 - 375 , 375 - 400 , 400 - 425 , 425 - 450 , 450 - 475 | ||
 | Click To Change The Sort Order: By Market Cap or Company Size Performance: Year-to-date, Week and Day |  |
|
Get the most comprehensive stock market coverage daily at 12Stocks.com ➞ Best Stocks Today ➞ Best Stocks Weekly ➞ Best Stocks Year-to-Date ➞ Best Stocks Trends ➞  Best Stocks Today 12Stocks.com Best Nasdaq Stocks ➞ Best S&P 500 Stocks ➞ Best Tech Stocks ➞ Best Biotech Stocks ➞ |
| Detailed Overview of Consumer Services Stocks |
| Consumer Services Technical Overview, Leaders & Laggards, Top Consumer Services ETF Funds & Detailed Consumer Services Stocks List, Charts, Trends & More |
| Consumer Services Sector: Technical Analysis, Trends & YTD Performance | |
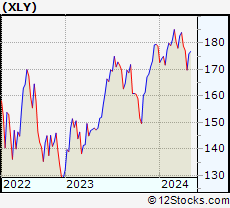
| Consumer Services sector is composed of stocks
from retail, entertainment, media/publishing, consumer goods
and services subsectors. Consumer Services sector, as represented by XLY, an exchange-traded fund [ETF] that holds basket of Consumer Services stocks (e.g, Walmart, Alibaba) is down by -4.39% and is currently underperforming the overall market by -8.47% year-to-date. Below is a quick view of Technical charts and trends: |
|
 XLY Weekly Chart |
|
| Long Term Trend: Good | |
| Medium Term Trend: Not Good | |
 XLY Daily Chart |
|
| Short Term Trend: Deteriorating | |
| Overall Trend Score: 23 | |
| YTD Performance: -4.39% | |
| **Trend Scores & Views Are Only For Educational Purposes And Not For Investing | |
| 12Stocks.com: Top Performing Consumer Services Sector Stocks | ||||||||||||||||||||||||||||||||||||||||||||||||
 The top performing Consumer Services sector stocks year to date are
Now, more recently, over last week, the top performing Consumer Services sector stocks on the move are


|
||||||||||||||||||||||||||||||||||||||||||||||||
| 12Stocks.com: Investing in Consumer Services Sector using Exchange Traded Funds | |
|
The following table shows list of key exchange traded funds (ETF) that
help investors track Consumer Services Index. For detailed view, check out our ETF Funds section of our website. Quick View: Move mouse or cursor over ETF symbol (ticker) to view short-term Technical chart and over ETF name to view long term chart. Click on ticker or stock name for detailed view. Click on to add stock symbol to your watchlist and to view watchlist. |
12Stocks.com List of ETFs that track Consumer Services Index
| Ticker | ETF Name | Watchlist | Recent Price | Smart Investing & Trading Score | Change % | Week % | Year-to-date % |
| XLY | Consumer Discret Sel | | 170.96 | 23 | -0.18 | -3.47 | -4.39% |
| RTH | Retail | | 198.72 | 44 | 0.05 | -1.47 | 5.57% |
| XRT | Retail | | 71.02 | 51 | 0.47 | -1.2 | -1.8% |
| UCC | Consumer Services | | 32.26 | 33 | -1.16 | -6.3 | -10.16% |
| RXI | Globl Consumer Discretionary | | 157.08 | 36 | -0.24 | -2.31 | -1.25% |
| SCC | Short Consumer Services | | 16.71 | 74 | 0.66 | 7.34 | 9.05% |
| UGE | Consumer Goods | | 16.28 | 73 | 0.13 | 0.57 | 3.43% |
| 12Stocks.com: Charts, Trends, Fundamental Data and Performances of Consumer Services Stocks | |
|
We now take in-depth look at all Consumer Services stocks including charts, multi-period performances and overall trends (as measured by Smart Investing & Trading Score). One can sort Consumer Services stocks (click link to choose) by Daily, Weekly and by Year-to-Date performances. Also, one can sort by size of the company or by market capitalization. |
| Select Your Default Chart Type: | |||||
| |||||
| Click on stock symbol or name for detailed view. Click on to add stock symbol to your watchlist and to view watchlist. Quick View: Move mouse or cursor over "Daily" to quickly view daily Technical stock chart and over "Weekly" to view weekly Technical stock chart. | |||||

 | GDEN Golden Entertainment, Inc. |
| Sector: Services & Goods | |
| SubSector: Resorts & Casinos | |
| MarketCap: 130.794 Millions | |
| Recent Price: 33.76 Smart Investing & Trading Score: 10 | |
| Day Percent Change: 0.99% Day Change: 0.33 | |
| Week Change: -5.33% Year-to-date Change: -15.5% | |
| GDEN Links: Profile News Message Board | |
| Charts:- Daily , Weekly | |
| Add GDEN to Watchlist: View: Get Complete GDEN Trend Analysis ➞ | |
 | ULTA Ulta Beauty, Inc. |
| Sector: Services & Goods | |
| SubSector: Specialty Retail, Other | |
| MarketCap: 9429.94 Millions | |
| Recent Price: 413.11 Smart Investing & Trading Score: 10 | |
| Day Percent Change: -2.82% Day Change: -12.00 | |
| Week Change: -6.6% Year-to-date Change: -15.7% | |
| ULTA Links: Profile News Message Board | |
| Charts:- Daily , Weekly | |
| Add ULTA to Watchlist: View: Get Complete ULTA Trend Analysis ➞ | |
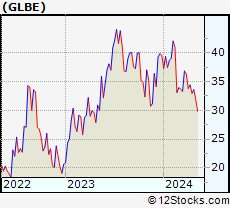 | GLBE Global-e Online Ltd. |
| Sector: Services & Goods | |
| SubSector: Internet Retail | |
| MarketCap: 6610 Millions | |
| Recent Price: 33.29 Smart Investing & Trading Score: 28 | |
| Day Percent Change: -3.59% Day Change: -1.24 | |
| Week Change: -3.31% Year-to-date Change: -15.9% | |
| GLBE Links: Profile News Message Board | |
| Charts:- Daily , Weekly | |
| Add GLBE to Watchlist: View: Get Complete GLBE Trend Analysis ➞ | |
 | RH RH |
| Sector: Services & Goods | |
| SubSector: Home Furnishing Stores | |
| MarketCap: 1828.25 Millions | |
| Recent Price: 244.88 Smart Investing & Trading Score: 27 | |
| Day Percent Change: -0.17% Day Change: -0.41 | |
| Week Change: -4.04% Year-to-date Change: -16.0% | |
| RH Links: Profile News Message Board | |
| Charts:- Daily , Weekly | |
| Add RH to Watchlist: View: Get Complete RH Trend Analysis ➞ | |
 | TV Grupo Televisa, S.A.B. |
| Sector: Services & Goods | |
| SubSector: Broadcasting - TV | |
| MarketCap: 3740.43 Millions | |
| Recent Price: 2.81 Smart Investing & Trading Score: 10 | |
| Day Percent Change: -1.58% Day Change: -0.04 | |
| Week Change: -13.16% Year-to-date Change: -16.0% | |
| TV Links: Profile News Message Board | |
| Charts:- Daily , Weekly | |
| Add TV to Watchlist: View: Get Complete TV Trend Analysis ➞ | |
 | ETSY Etsy, Inc. |
| Sector: Services & Goods | |
| SubSector: Specialty Retail, Other | |
| MarketCap: 4263.24 Millions | |
| Recent Price: 67.76 Smart Investing & Trading Score: 76 | |
| Day Percent Change: 0.62% Day Change: 0.42 | |
| Week Change: -0.95% Year-to-date Change: -16.4% | |
| ETSY Links: Profile News Message Board | |
| Charts:- Daily , Weekly | |
| Add ETSY to Watchlist: View: Get Complete ETSY Trend Analysis ➞ | |
 | NATH Nathan s Famous, Inc. |
| Sector: Services & Goods | |
| SubSector: Restaurants | |
| MarketCap: 211.77 Millions | |
| Recent Price: 64.95 Smart Investing & Trading Score: 18 | |
| Day Percent Change: 0.00% Day Change: 0.00 | |
| Week Change: -2.02% Year-to-date Change: -16.7% | |
| NATH Links: Profile News Message Board | |
| Charts:- Daily , Weekly | |
| Add NATH to Watchlist: View: Get Complete NATH Trend Analysis ➞ | |
 | QUAD Quad/Graphics, Inc. |
| Sector: Services & Goods | |
| SubSector: Business Services | |
| MarketCap: 205.182 Millions | |
| Recent Price: 4.51 Smart Investing & Trading Score: 17 | |
| Day Percent Change: 0.00% Day Change: 0.00 | |
| Week Change: -5.65% Year-to-date Change: -16.8% | |
| QUAD Links: Profile News Message Board | |
| Charts:- Daily , Weekly | |
| Add QUAD to Watchlist: View: Get Complete QUAD Trend Analysis ➞ | |
 | FLWS 1-800-FLOWERS.COM, Inc. |
| Sector: Services & Goods | |
| SubSector: Specialty Retail, Other | |
| MarketCap: 940 Millions | |
| Recent Price: 8.91 Smart Investing & Trading Score: 17 | |
| Day Percent Change: 1.60% Day Change: 0.14 | |
| Week Change: -0.34% Year-to-date Change: -17.4% | |
| FLWS Links: Profile News Message Board | |
| Charts:- Daily , Weekly | |
| Add FLWS to Watchlist: View: Get Complete FLWS Trend Analysis ➞ | |
 | GENI Genius Sports Limited |
| Sector: Services & Goods | |
| SubSector: Internet Content & Information | |
| MarketCap: 1410 Millions | |
| Recent Price: 5.12 Smart Investing & Trading Score: 25 | |
| Day Percent Change: -2.29% Day Change: -0.12 | |
| Week Change: -4.12% Year-to-date Change: -17.8% | |
| GENI Links: Profile News Message Board | |
| Charts:- Daily , Weekly | |
| Add GENI to Watchlist: View: Get Complete GENI Trend Analysis ➞ | |
 | MGA Magna International Inc. |
| Sector: Services & Goods | |
| SubSector: Auto Parts Wholesale | |
| MarketCap: 8967.3 Millions | |
| Recent Price: 48.22 Smart Investing & Trading Score: 10 | |
| Day Percent Change: 0.76% Day Change: 0.37 | |
| Week Change: -5.98% Year-to-date Change: -18.4% | |
| MGA Links: Profile News Message Board | |
| Charts:- Daily , Weekly | |
| Add MGA to Watchlist: View: Get Complete MGA Trend Analysis ➞ | |
 | CZR Caesars Entertainment Corporation |
| Sector: Services & Goods | |
| SubSector: Resorts & Casinos | |
| MarketCap: 4618.44 Millions | |
| Recent Price: 38.13 Smart Investing & Trading Score: 0 | |
| Day Percent Change: 0.39% Day Change: 0.15 | |
| Week Change: -4.91% Year-to-date Change: -18.7% | |
| CZR Links: Profile News Message Board | |
| Charts:- Daily , Weekly | |
| Add CZR to Watchlist: View: Get Complete CZR Trend Analysis ➞ | |
 | CCO Clear Channel Outdoor Holdings, Inc. |
| Sector: Services & Goods | |
| SubSector: Marketing Services | |
| MarketCap: 312.715 Millions | |
| Recent Price: 1.48 Smart Investing & Trading Score: 25 | |
| Day Percent Change: 2.78% Day Change: 0.04 | |
| Week Change: -2.63% Year-to-date Change: -18.7% | |
| CCO Links: Profile News Message Board | |
| Charts:- Daily , Weekly | |
| Add CCO to Watchlist: View: Get Complete CCO Trend Analysis ➞ | |
 | KSS Kohl s Corporation |
| Sector: Services & Goods | |
| SubSector: Department Stores | |
| MarketCap: 3068 Millions | |
| Recent Price: 23.29 Smart Investing & Trading Score: 32 | |
| Day Percent Change: 1.93% Day Change: 0.44 | |
| Week Change: 2.46% Year-to-date Change: -18.8% | |
| KSS Links: Profile News Message Board | |
| Charts:- Daily , Weekly | |
| Add KSS to Watchlist: View: Get Complete KSS Trend Analysis ➞ | |
 | PZZA Papa John s International, Inc. |
| Sector: Services & Goods | |
| SubSector: Specialty Eateries | |
| MarketCap: 1925.27 Millions | |
| Recent Price: 61.83 Smart Investing & Trading Score: 17 | |
| Day Percent Change: 0.77% Day Change: 0.48 | |
| Week Change: 0.07% Year-to-date Change: -18.9% | |
| PZZA Links: Profile News Message Board | |
| Charts:- Daily , Weekly | |
| Add PZZA to Watchlist: View: Get Complete PZZA Trend Analysis ➞ | |
 | STG Sunlands Technology Group |
| Sector: Services & Goods | |
| SubSector: Education & Training Services | |
| MarketCap: 295.706 Millions | |
| Recent Price: 8.21 Smart Investing & Trading Score: 0 | |
| Day Percent Change: 2.50% Day Change: 0.20 | |
| Week Change: -6.51% Year-to-date Change: -19.3% | |
| STG Links: Profile News Message Board | |
| Charts:- Daily , Weekly | |
| Add STG to Watchlist: View: Get Complete STG Trend Analysis ➞ | |
 | DLTH Duluth Holdings Inc. |
| Sector: Services & Goods | |
| SubSector: Apparel Stores | |
| MarketCap: 180.008 Millions | |
| Recent Price: 4.34 Smart Investing & Trading Score: 10 | |
| Day Percent Change: 0.46% Day Change: 0.02 | |
| Week Change: -2.25% Year-to-date Change: -19.3% | |
| DLTH Links: Profile News Message Board | |
| Charts:- Daily , Weekly | |
| Add DLTH to Watchlist: View: Get Complete DLTH Trend Analysis ➞ | |
 | PLNT Planet Fitness, Inc. |
| Sector: Services & Goods | |
| SubSector: Sporting Activities | |
| MarketCap: 3485.94 Millions | |
| Recent Price: 58.88 Smart Investing & Trading Score: 10 | |
| Day Percent Change: 0.39% Day Change: 0.23 | |
| Week Change: -3.93% Year-to-date Change: -19.3% | |
| PLNT Links: Profile News Message Board | |
| Charts:- Daily , Weekly | |
| Add PLNT to Watchlist: View: Get Complete PLNT Trend Analysis ➞ | |
 | NVEE NV5 Global, Inc. |
| Sector: Services & Goods | |
| SubSector: Technical Services | |
| MarketCap: 484.91 Millions | |
| Recent Price: 89.39 Smart Investing & Trading Score: 0 | |
| Day Percent Change: -0.08% Day Change: -0.07 | |
| Week Change: -5.74% Year-to-date Change: -19.6% | |
| NVEE Links: Profile News Message Board | |
| Charts:- Daily , Weekly | |
| Add NVEE to Watchlist: View: Get Complete NVEE Trend Analysis ➞ | |
 | RHI Robert Half International Inc. |
| Sector: Services & Goods | |
| SubSector: Staffing & Outsourcing Services | |
| MarketCap: 4302 Millions | |
| Recent Price: 70.65 Smart Investing & Trading Score: 18 | |
| Day Percent Change: 1.57% Day Change: 1.09 | |
| Week Change: -1.97% Year-to-date Change: -19.6% | |
| RHI Links: Profile News Message Board | |
| Charts:- Daily , Weekly | |
| Add RHI to Watchlist: View: Get Complete RHI Trend Analysis ➞ | |
 | COE China Online Education Group |
| Sector: Services & Goods | |
| SubSector: Education & Training Services | |
| MarketCap: 643.406 Millions | |
| Recent Price: 6.42 Smart Investing & Trading Score: 20 | |
| Day Percent Change: -2.73% Day Change: -0.18 | |
| Week Change: -1.38% Year-to-date Change: -20.1% | |
| COE Links: Profile News Message Board | |
| Charts:- Daily , Weekly | |
| Add COE to Watchlist: View: Get Complete COE Trend Analysis ➞ | |
 | NEWT Newtek Business Services Corp. |
| Sector: Services & Goods | |
| SubSector: Business Services | |
| MarketCap: 243.982 Millions | |
| Recent Price: 11.02 Smart Investing & Trading Score: 17 | |
| Day Percent Change: 1.29% Day Change: 0.14 | |
| Week Change: -2.99% Year-to-date Change: -20.1% | |
| NEWT Links: Profile News Message Board | |
| Charts:- Daily , Weekly | |
| Add NEWT to Watchlist: View: Get Complete NEWT Trend Analysis ➞ | |
 | CHUY Chuy s Holdings, Inc. |
| Sector: Services & Goods | |
| SubSector: Restaurants | |
| MarketCap: 159.17 Millions | |
| Recent Price: 30.45 Smart Investing & Trading Score: 10 | |
| Day Percent Change: 0.05% Day Change: 0.02 | |
| Week Change: -3.5% Year-to-date Change: -20.4% | |
| CHUY Links: Profile News Message Board | |
| Charts:- Daily , Weekly | |
| Add CHUY to Watchlist: View: Get Complete CHUY Trend Analysis ➞ | |
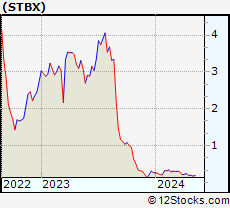 | STBX Starbox Group Holdings Ltd. |
| Sector: Services & Goods | |
| SubSector: Internet Content & Information | |
| MarketCap: 162 Millions | |
| Recent Price: 0.21 Smart Investing & Trading Score: 30 | |
| Day Percent Change: -0.33% Day Change: 0.00 | |
| Week Change: -12.86% Year-to-date Change: -20.4% | |
| STBX Links: Profile News Message Board | |
| Charts:- Daily , Weekly | |
| Add STBX to Watchlist: View: Get Complete STBX Trend Analysis ➞ | |
 | LAD Lithia Motors, Inc. |
| Sector: Services & Goods | |
| SubSector: Auto Dealerships | |
| MarketCap: 1727.21 Millions | |
| Recent Price: 261.28 Smart Investing & Trading Score: 25 | |
| Day Percent Change: 0.36% Day Change: 0.93 | |
| Week Change: -1.22% Year-to-date Change: -20.7% | |
| LAD Links: Profile News Message Board | |
| Charts:- Daily , Weekly | |
| Add LAD to Watchlist: View: Get Complete LAD Trend Analysis ➞ | |
| For tabular summary view of above stock list: Summary View ➞ 0 - 25 , 25 - 50 , 50 - 75 , 75 - 100 , 100 - 125 , 125 - 150 , 150 - 175 , 175 - 200 , 200 - 225 , 225 - 250 , 250 - 275 , 275 - 300 , 300 - 325 , 325 - 350 , 350 - 375 , 375 - 400 , 400 - 425 , 425 - 450 , 450 - 475 | ||
| Click To Change The Sort Order: By Market Cap or Company Size Performance: Year-to-date, Week and Day | |
| Select Chart Type: | ||
|
Best Stocks Today 12Stocks.com |
© 2024 12Stocks.com Terms & Conditions Privacy Contact Us
All Information Provided Only For Education And Not To Be Used For Investing or Trading. See Terms & Conditions


One More Thing ... Get Best Stocks Delivered Daily!
Never Ever Miss A Move With Our Top Ten Stocks Lists
Find Best Stocks In Any Market - Bull or Bear Market
Take A Peek At Our Top Ten Stocks Lists: Daily, Weekly, Year-to-Date & Top Trends
Find Best Stocks In Any Market - Bull or Bear Market
Take A Peek At Our Top Ten Stocks Lists: Daily, Weekly, Year-to-Date & Top Trends
Consumer Services Stocks With Best Up Trends [0-bearish to 100-bullish]: Gaia [100], Genuine Parts[100], IMAX [100], MYT Netherlands[93], Gannett Co[93], Envestnet [93], ContextLogic [90], Winmark [90], Wendy s[87], Smart Share[86], Biglari [83]
Best Consumer Services Stocks Year-to-Date:
U Power[2818.53%], Vroom [1713.36%], Yatsen Holding[394.12%], Fluent [288.06%], Codere Online[138.01%], Research[96.93%], Sweetgreen [86.02%], Bright Scholar[68%], RealReal [57.96%], PaySign [52.5%], DXP Enterprises[50.45%] Best Consumer Services Stocks This Week:
Yatsen Holding[20.1%], ContextLogic [20%], AMC Entertainment[17.36%], Secoo Holding[15.24%], Bright Scholar[14.13%], E.W. Scripps[12.5%], Genuine Parts[10.93%], Advance Auto[10.04%], Envestnet [9.27%], Smart Share[9.26%], Altisource Portfolio[8.45%] Best Consumer Services Stocks Daily:
Bright Scholar[11.70%], Vision Marine[7.40%], Lanvin [6.99%], AMC Entertainment[6.51%], Allbirds [5.72%], GreenTree Hospitality[4.56%], E.W. Scripps[4.35%], ContextLogic [4.35%], Altisource Portfolio[4.22%], MYT Netherlands[4.06%], Allego N.V[3.96%]