
 Login Sign Up


| |||||
 |  | ||||

| 12Stocks.com Market Intelligence |
Best Consumer Services Stocks
| In a hurry? Services & Goods Stocks: Performance Trends Table, Stock Charts
Sort Consumer Services: Daily, Weekly, Year-to-Date, Market Cap & Trends. Filter Services & Goods stocks list by size: All Large Mid-Range Small |
| 12Stocks.com Consumer Services Stocks Performances & Trends Daily | |||||||||
|
|  The overall Smart Investing & Trading Score is 35 (0-bearish to 100-bullish) which puts Consumer Services sector in short term bearish to neutral trend. The Smart Investing & Trading Score from previous trading session is 7 and hence an improvement of trend.
| ||||||||
Here are the Smart Investing & Trading Scores of the most requested Consumer Services stocks at 12Stocks.com (click stock name for detailed review):
|


| Consider signing up for our daily 12Stocks.com "Best Stocks Newsletter". You will never ever miss a big stock move again! |
| 12Stocks.com: Investing in Consumer Services sector with Stocks | |
|
The following table helps investors and traders sort through current performance and trends (as measured by Smart Investing & Trading Score) of various
stocks in the Consumer Services sector. Quick View: Move mouse or cursor over stock symbol (ticker) to view short-term Technical chart and over stock name to view long term chart. Click on  to add stock symbol to your watchlist and to add stock symbol to your watchlist and  to view watchlist. Click on any ticker or stock name for detailed market intelligence report for that stock. to view watchlist. Click on any ticker or stock name for detailed market intelligence report for that stock. |
12Stocks.com Performance of Stocks in Consumer Services Sector
| Ticker | Stock Name | Watchlist | Category | Recent Price | Smart Investing & Trading Score | Change % | YTD Change% |
| DJCO | Daily Journal |   | Publishing | 359.54 | 88 | 1.68% | 5.49% |
| CATO | Cato | | Apparel | 4.77 | 10 | 1.49% | -33.19% |
| CSV | Carriage Services | | Services | 25.65 | 80 | -0.62% | 2.56% |
| PLCE | Children s | | Apparel | 7.70 | 42 | 14.58% | -66.84% |
| NCMI | National CineMedia | | Marketing | 4.52 | 58 | 1.12% | 9.18% |
| LOCO | El Pollo | | Restaurants | 8.59 | 14 | 1.78% | -2.61% |
| STG | Sunlands Technology | | Education | 7.90 | 32 | -1.13% | -22.32% |
| CARS | Cars.com | | Automobile | 16.90 | 25 | 1.87% | -10.91% |
| TISI | Team | | Services | 6.05 | 51 | -9.16% | -8.33% |
| PLAY | Dave & Buster s Entertainment | | Restaurants | 52.44 | 10 | 0.27% | -2.62% |
| CURV | Torrid | | Apparel Retail | 5.23 | 57 | 3.36% | -10.60% |
| EVRI | Everi | | Gaming | 8.16 | 20 | 1.49% | -27.60% |
| VVI | Viad Corp | | Services | 35.29 | 17 | 3.01% | -2.51% |
| LE | Lands | | Retail | 14.17 | 93 | 4.42% | 48.22% |
| FFIE | Faraday Future | | Auto Manufacturers | 0.04 | 30 | -12.61% | -82.57% |
| BBSI | Barrett Business | | Staffing | 119.77 | 0 | -2.17% | 3.43% |
| ICLK | iClick Interactive | | Marketing | 1.26 | 32 | -0.79% | -67.10% |
| TDUP | ThredUp | | Internet Retail | 1.67 | 34 | 2.45% | -26.11% |
| GME | GameStop | | Retail | 12.76 | 74 | 16.96% | -27.21% |
| VALU | Value Line | | Publishing | 36.30 | 30 | 0.00% | -25.54% |
| HVT | Haverty Furniture | | Retail | 28.52 | 0 | -8.03% | -19.66% |
| EEX | Emerald Holding | | Services | 5.92 | 58 | 0.68% | -1.00% |
| SCVL | Shoe Carnival | | Apparel | 34.01 | 56 | 1.98% | 12.58% |
| LSXMB | Liberty SiriusXM | | Broadcasting | 26.18 | 48 | 3.89% | -9.03% |
| OB | Outbrain | | Internet Content & Information | 4.42 | 100 | 4.49% | 0.91% |
| For chart view version of above stock list: Chart View ➞ 0 - 25 , 25 - 50 , 50 - 75 , 75 - 100 , 100 - 125 , 125 - 150 , 150 - 175 , 175 - 200 , 200 - 225 , 225 - 250 , 250 - 275 , 275 - 300 , 300 - 325 , 325 - 350 , 350 - 375 , 375 - 400 , 400 - 425 , 425 - 450 , 450 - 475 | ||
 | Click To Change The Sort Order: By Market Cap or Company Size Performance: Year-to-date, Week and Day |  |
|
Get the most comprehensive stock market coverage daily at 12Stocks.com ➞ Best Stocks Today ➞ Best Stocks Weekly ➞ Best Stocks Year-to-Date ➞ Best Stocks Trends ➞  Best Stocks Today 12Stocks.com Best Nasdaq Stocks ➞ Best S&P 500 Stocks ➞ Best Tech Stocks ➞ Best Biotech Stocks ➞ |
| Detailed Overview of Consumer Services Stocks |
| Consumer Services Technical Overview, Leaders & Laggards, Top Consumer Services ETF Funds & Detailed Consumer Services Stocks List, Charts, Trends & More |
| Consumer Services Sector: Technical Analysis, Trends & YTD Performance | |
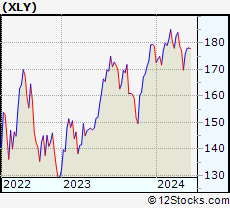
| Consumer Services sector is composed of stocks
from retail, entertainment, media/publishing, consumer goods
and services subsectors. Consumer Services sector, as represented by XLY, an exchange-traded fund [ETF] that holds basket of Consumer Services stocks (e.g, Walmart, Alibaba) is down by -1.17% and is currently underperforming the overall market by -6.79% year-to-date. Below is a quick view of Technical charts and trends: |
|
 XLY Weekly Chart |
|
| Long Term Trend: Not Good | |
| Medium Term Trend: Deteriorating | |
 XLY Daily Chart |
|
| Short Term Trend: Deteriorating | |
| Overall Trend Score: 35 | |
| YTD Performance: -1.17% | |
| **Trend Scores & Views Are Only For Educational Purposes And Not For Investing | |
| 12Stocks.com: Top Performing Consumer Services Sector Stocks | ||||||||||||||||||||||||||||||||||||||||||||||||
 The top performing Consumer Services sector stocks year to date are
Now, more recently, over last week, the top performing Consumer Services sector stocks on the move are


|
||||||||||||||||||||||||||||||||||||||||||||||||
| 12Stocks.com: Investing in Consumer Services Sector using Exchange Traded Funds | |
|
The following table shows list of key exchange traded funds (ETF) that
help investors track Consumer Services Index. For detailed view, check out our ETF Funds section of our website. Quick View: Move mouse or cursor over ETF symbol (ticker) to view short-term Technical chart and over ETF name to view long term chart. Click on ticker or stock name for detailed view. Click on to add stock symbol to your watchlist and to view watchlist. |
12Stocks.com List of ETFs that track Consumer Services Index
| Ticker | ETF Name | Watchlist | Recent Price | Smart Investing & Trading Score | Change % | Week % | Year-to-date % |
| XLY | Consumer Discret Sel | | 176.72 | 35 | 1.26 | 0.46 | -1.17% |
| RTH | Retail | | 199.00 | 7 | 1.49 | -1.03 | 5.72% |
| IYC | Consumer Services | | 78.35 | 7 | 1.28 | -0.01 | 3.41% |
| XRT | Retail | | 72.49 | 25 | 1.70 | -1 | 0.24% |
| IYK | Consumer Goods | | 66.46 | 63 | 0.51 | -0.45 | 4% |
| UCC | Consumer Services | | 33.96 | 49 | 1.98 | -0.59 | -5.42% |
| RETL | Retail Bull 3X | | 8.53 | 5 | 5.44 | -3.4 | -6.47% |
| RXI | Globl Consumer Discretionary | | 161.47 | 27 | 1.46 | 0.18 | 1.52% |
| SCC | Short Consumer Services | | 15.66 | 88 | -1.97 | -0.73 | 2.23% |
| UGE | Consumer Goods | | 16.92 | 80 | 0.39 | -1.46 | 7.49% |
| 12Stocks.com: Charts, Trends, Fundamental Data and Performances of Consumer Services Stocks | |
|
We now take in-depth look at all Consumer Services stocks including charts, multi-period performances and overall trends (as measured by Smart Investing & Trading Score). One can sort Consumer Services stocks (click link to choose) by Daily, Weekly and by Year-to-Date performances. Also, one can sort by size of the company or by market capitalization. |
| Select Your Default Chart Type: | |||||
| |||||
| Click on stock symbol or name for detailed view. Click on to add stock symbol to your watchlist and to view watchlist. Quick View: Move mouse or cursor over "Daily" to quickly view daily Technical stock chart and over "Weekly" to view weekly Technical stock chart. | |||||

 | DJCO Daily Journal Corporation |
| Sector: Services & Goods | |
| SubSector: Publishing - Newspapers | |
| MarketCap: 306.822 Millions | |
| Recent Price: 359.54 Smart Investing & Trading Score: 88 | |
| Day Percent Change: 1.68% Day Change: 5.94 | |
| Week Change: 3.67% Year-to-date Change: 5.5% | |
| DJCO Links: Profile News Message Board | |
| Charts:- Daily , Weekly | |
| Add DJCO to Watchlist: View: Get Complete DJCO Trend Analysis ➞ | |
 | CATO The Cato Corporation |
| Sector: Services & Goods | |
| SubSector: Apparel Stores | |
| MarketCap: 305.208 Millions | |
| Recent Price: 4.77 Smart Investing & Trading Score: 10 | |
| Day Percent Change: 1.49% Day Change: 0.07 | |
| Week Change: 3.7% Year-to-date Change: -33.2% | |
| CATO Links: Profile News Message Board | |
| Charts:- Daily , Weekly | |
| Add CATO to Watchlist: View: Get Complete CATO Trend Analysis ➞ | |
 | CSV Carriage Services, Inc. |
| Sector: Services & Goods | |
| SubSector: Personal Services | |
| MarketCap: 304.725 Millions | |
| Recent Price: 25.65 Smart Investing & Trading Score: 80 | |
| Day Percent Change: -0.62% Day Change: -0.16 | |
| Week Change: 2.93% Year-to-date Change: 2.6% | |
| CSV Links: Profile News Message Board | |
| Charts:- Daily , Weekly | |
| Add CSV to Watchlist: View: Get Complete CSV Trend Analysis ➞ | |
 | PLCE The Children s Place, Inc. |
| Sector: Services & Goods | |
| SubSector: Apparel Stores | |
| MarketCap: 303.608 Millions | |
| Recent Price: 7.70 Smart Investing & Trading Score: 42 | |
| Day Percent Change: 14.58% Day Change: 0.98 | |
| Week Change: 8.6% Year-to-date Change: -66.8% | |
| PLCE Links: Profile News Message Board | |
| Charts:- Daily , Weekly | |
| Add PLCE to Watchlist: View: Get Complete PLCE Trend Analysis ➞ | |
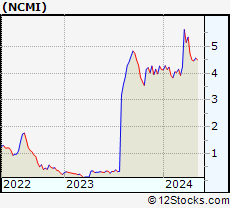 | NCMI National CineMedia, Inc. |
| Sector: Services & Goods | |
| SubSector: Marketing Services | |
| MarketCap: 298.015 Millions | |
| Recent Price: 4.52 Smart Investing & Trading Score: 58 | |
| Day Percent Change: 1.12% Day Change: 0.05 | |
| Week Change: 1.23% Year-to-date Change: 9.2% | |
| NCMI Links: Profile News Message Board | |
| Charts:- Daily , Weekly | |
| Add NCMI to Watchlist: View: Get Complete NCMI Trend Analysis ➞ | |
 | LOCO El Pollo Loco Holdings, Inc. |
| Sector: Services & Goods | |
| SubSector: Restaurants | |
| MarketCap: 296.97 Millions | |
| Recent Price: 8.59 Smart Investing & Trading Score: 14 | |
| Day Percent Change: 1.78% Day Change: 0.15 | |
| Week Change: -3.59% Year-to-date Change: -2.6% | |
| LOCO Links: Profile News Message Board | |
| Charts:- Daily , Weekly | |
| Add LOCO to Watchlist: View: Get Complete LOCO Trend Analysis ➞ | |
 | STG Sunlands Technology Group |
| Sector: Services & Goods | |
| SubSector: Education & Training Services | |
| MarketCap: 295.706 Millions | |
| Recent Price: 7.90 Smart Investing & Trading Score: 32 | |
| Day Percent Change: -1.13% Day Change: -0.09 | |
| Week Change: -0.69% Year-to-date Change: -22.3% | |
| STG Links: Profile News Message Board | |
| Charts:- Daily , Weekly | |
| Add STG to Watchlist: View: Get Complete STG Trend Analysis ➞ | |
 | CARS Cars.com Inc. |
| Sector: Services & Goods | |
| SubSector: Auto Dealerships | |
| MarketCap: 290.321 Millions | |
| Recent Price: 16.90 Smart Investing & Trading Score: 25 | |
| Day Percent Change: 1.87% Day Change: 0.31 | |
| Week Change: -0.71% Year-to-date Change: -10.9% | |
| CARS Links: Profile News Message Board | |
| Charts:- Daily , Weekly | |
| Add CARS to Watchlist: View: Get Complete CARS Trend Analysis ➞ | |
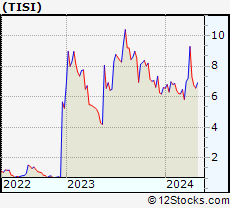 | TISI Team, Inc. |
| Sector: Services & Goods | |
| SubSector: Business Services | |
| MarketCap: 284.982 Millions | |
| Recent Price: 6.05 Smart Investing & Trading Score: 51 | |
| Day Percent Change: -9.16% Day Change: -0.61 | |
| Week Change: -7.91% Year-to-date Change: -8.3% | |
| TISI Links: Profile News Message Board | |
| Charts:- Daily , Weekly | |
| Add TISI to Watchlist: View: Get Complete TISI Trend Analysis ➞ | |
 | PLAY Dave & Buster s Entertainment, Inc. |
| Sector: Services & Goods | |
| SubSector: Restaurants | |
| MarketCap: 283.07 Millions | |
| Recent Price: 52.44 Smart Investing & Trading Score: 10 | |
| Day Percent Change: 0.27% Day Change: 0.14 | |
| Week Change: 0.52% Year-to-date Change: -2.6% | |
| PLAY Links: Profile News Message Board | |
| Charts:- Daily , Weekly | |
| Add PLAY to Watchlist: View: Get Complete PLAY Trend Analysis ➞ | |
 | CURV Torrid Holdings Inc. |
| Sector: Services & Goods | |
| SubSector: Apparel Retail | |
| MarketCap: 278 Millions | |
| Recent Price: 5.23 Smart Investing & Trading Score: 57 | |
| Day Percent Change: 3.36% Day Change: 0.17 | |
| Week Change: 4.6% Year-to-date Change: -10.6% | |
| CURV Links: Profile News Message Board | |
| Charts:- Daily , Weekly | |
| Add CURV to Watchlist: View: Get Complete CURV Trend Analysis ➞ | |
 | EVRI Everi Holdings Inc. |
| Sector: Services & Goods | |
| SubSector: Gaming Activities | |
| MarketCap: 273.389 Millions | |
| Recent Price: 8.16 Smart Investing & Trading Score: 20 | |
| Day Percent Change: 1.49% Day Change: 0.12 | |
| Week Change: -2.63% Year-to-date Change: -27.6% | |
| EVRI Links: Profile News Message Board | |
| Charts:- Daily , Weekly | |
| Add EVRI to Watchlist: View: Get Complete EVRI Trend Analysis ➞ | |
 | VVI Viad Corp |
| Sector: Services & Goods | |
| SubSector: Business Services | |
| MarketCap: 270.682 Millions | |
| Recent Price: 35.29 Smart Investing & Trading Score: 17 | |
| Day Percent Change: 3.01% Day Change: 1.03 | |
| Week Change: 0.46% Year-to-date Change: -2.5% | |
| VVI Links: Profile News Message Board | |
| Charts:- Daily , Weekly | |
| Add VVI to Watchlist: View: Get Complete VVI Trend Analysis ➞ | |
 | LE Lands End, Inc. |
| Sector: Services & Goods | |
| SubSector: Catalog & Mail Order Houses | |
| MarketCap: 268.692 Millions | |
| Recent Price: 14.17 Smart Investing & Trading Score: 93 | |
| Day Percent Change: 4.42% Day Change: 0.60 | |
| Week Change: 8.92% Year-to-date Change: 48.2% | |
| LE Links: Profile News Message Board | |
| Charts:- Daily , Weekly | |
| Add LE to Watchlist: View: Get Complete LE Trend Analysis ➞ | |
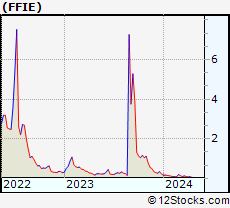 | FFIE Faraday Future Intelligent Electric Inc. |
| Sector: Services & Goods | |
| SubSector: Auto Manufacturers | |
| MarketCap: 268 Millions | |
| Recent Price: 0.04 Smart Investing & Trading Score: 30 | |
| Day Percent Change: -12.61% Day Change: -0.01 | |
| Week Change: -14.47% Year-to-date Change: -82.6% | |
| FFIE Links: Profile News Message Board | |
| Charts:- Daily , Weekly | |
| Add FFIE to Watchlist: View: Get Complete FFIE Trend Analysis ➞ | |
 | BBSI Barrett Business Services, Inc. |
| Sector: Services & Goods | |
| SubSector: Staffing & Outsourcing Services | |
| MarketCap: 262.028 Millions | |
| Recent Price: 119.77 Smart Investing & Trading Score: 0 | |
| Day Percent Change: -2.17% Day Change: -2.66 | |
| Week Change: -1.64% Year-to-date Change: 3.4% | |
| BBSI Links: Profile News Message Board | |
| Charts:- Daily , Weekly | |
| Add BBSI to Watchlist: View: Get Complete BBSI Trend Analysis ➞ | |
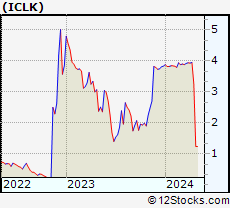 | ICLK iClick Interactive Asia Group Limited |
| Sector: Services & Goods | |
| SubSector: Marketing Services | |
| MarketCap: 258.915 Millions | |
| Recent Price: 1.26 Smart Investing & Trading Score: 32 | |
| Day Percent Change: -0.79% Day Change: -0.01 | |
| Week Change: 1.61% Year-to-date Change: -67.1% | |
| ICLK Links: Profile News Message Board | |
| Charts:- Daily , Weekly | |
| Add ICLK to Watchlist: View: Get Complete ICLK Trend Analysis ➞ | |
 | TDUP ThredUp Inc. |
| Sector: Services & Goods | |
| SubSector: Internet Retail | |
| MarketCap: 258 Millions | |
| Recent Price: 1.67 Smart Investing & Trading Score: 34 | |
| Day Percent Change: 2.45% Day Change: 0.04 | |
| Week Change: 3.73% Year-to-date Change: -26.1% | |
| TDUP Links: Profile News Message Board | |
| Charts:- Daily , Weekly | |
| Add TDUP to Watchlist: View: Get Complete TDUP Trend Analysis ➞ | |
 | GME GameStop Corp. |
| Sector: Services & Goods | |
| SubSector: Electronics Stores | |
| MarketCap: 257.8 Millions | |
| Recent Price: 12.76 Smart Investing & Trading Score: 74 | |
| Day Percent Change: 16.96% Day Change: 1.85 | |
| Week Change: 7.23% Year-to-date Change: -27.2% | |
| GME Links: Profile News Message Board | |
| Charts:- Daily , Weekly | |
| Add GME to Watchlist: View: Get Complete GME Trend Analysis ➞ | |
 | VALU Value Line, Inc. |
| Sector: Services & Goods | |
| SubSector: Publishing - Periodicals | |
| MarketCap: 254.3 Millions | |
| Recent Price: 36.30 Smart Investing & Trading Score: 30 | |
| Day Percent Change: 0.00% Day Change: 0.00 | |
| Week Change: -0.14% Year-to-date Change: -25.5% | |
| VALU Links: Profile News Message Board | |
| Charts:- Daily , Weekly | |
| Add VALU to Watchlist: View: Get Complete VALU Trend Analysis ➞ | |
 | HVT Haverty Furniture Companies, Inc. |
| Sector: Services & Goods | |
| SubSector: Home Furnishing Stores | |
| MarketCap: 253.125 Millions | |
| Recent Price: 28.52 Smart Investing & Trading Score: 0 | |
| Day Percent Change: -8.03% Day Change: -2.49 | |
| Week Change: -8.88% Year-to-date Change: -19.7% | |
| HVT Links: Profile News Message Board | |
| Charts:- Daily , Weekly | |
| Add HVT to Watchlist: View: Get Complete HVT Trend Analysis ➞ | |
 | EEX Emerald Holding, Inc. |
| Sector: Services & Goods | |
| SubSector: Business Services | |
| MarketCap: 252.682 Millions | |
| Recent Price: 5.92 Smart Investing & Trading Score: 58 | |
| Day Percent Change: 0.68% Day Change: 0.04 | |
| Week Change: 1.02% Year-to-date Change: -1.0% | |
| EEX Links: Profile News Message Board | |
| Charts:- Daily , Weekly | |
| Add EEX to Watchlist: View: Get Complete EEX Trend Analysis ➞ | |
 | SCVL Shoe Carnival, Inc. |
| Sector: Services & Goods | |
| SubSector: Apparel Stores | |
| MarketCap: 252.508 Millions | |
| Recent Price: 34.01 Smart Investing & Trading Score: 56 | |
| Day Percent Change: 1.98% Day Change: 0.66 | |
| Week Change: -1.51% Year-to-date Change: 12.6% | |
| SCVL Links: Profile News Message Board | |
| Charts:- Daily , Weekly | |
| Add SCVL to Watchlist: View: Get Complete SCVL Trend Analysis ➞ | |
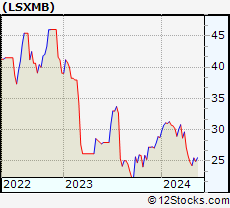 | LSXMB The Liberty SiriusXM Group |
| Sector: Services & Goods | |
| SubSector: Broadcasting - Radio | |
| MarketCap: 252.295 Millions | |
| Recent Price: 26.18 Smart Investing & Trading Score: 48 | |
| Day Percent Change: 3.89% Day Change: 0.98 | |
| Week Change: 7.83% Year-to-date Change: -9.0% | |
| LSXMB Links: Profile News Message Board | |
| Charts:- Daily , Weekly | |
| Add LSXMB to Watchlist: View: Get Complete LSXMB Trend Analysis ➞ | |
 | OB Outbrain Inc. |
| Sector: Services & Goods | |
| SubSector: Internet Content & Information | |
| MarketCap: 250 Millions | |
| Recent Price: 4.42 Smart Investing & Trading Score: 100 | |
| Day Percent Change: 4.49% Day Change: 0.19 | |
| Week Change: 5.74% Year-to-date Change: 0.9% | |
| OB Links: Profile News Message Board | |
| Charts:- Daily , Weekly | |
| Add OB to Watchlist: View: Get Complete OB Trend Analysis ➞ | |
| For tabular summary view of above stock list: Summary View ➞ 0 - 25 , 25 - 50 , 50 - 75 , 75 - 100 , 100 - 125 , 125 - 150 , 150 - 175 , 175 - 200 , 200 - 225 , 225 - 250 , 250 - 275 , 275 - 300 , 300 - 325 , 325 - 350 , 350 - 375 , 375 - 400 , 400 - 425 , 425 - 450 , 450 - 475 | ||
| Click To Change The Sort Order: By Market Cap or Company Size Performance: Year-to-date, Week and Day | |
| Select Chart Type: | ||
|
Best Stocks Today 12Stocks.com |
© 2024 12Stocks.com Terms & Conditions Privacy Contact Us
All Information Provided Only For Education And Not To Be Used For Investing or Trading. See Terms & Conditions


One More Thing ... Get Best Stocks Delivered Daily!
Never Ever Miss A Move With Our Top Ten Stocks Lists
Find Best Stocks In Any Market - Bull or Bear Market
Take A Peek At Our Top Ten Stocks Lists: Daily, Weekly, Year-to-Date & Top Trends
Find Best Stocks In Any Market - Bull or Bear Market
Take A Peek At Our Top Ten Stocks Lists: Daily, Weekly, Year-to-Date & Top Trends
Consumer Services Stocks With Best Up Trends [0-bearish to 100-bullish]: Perdoceo Education[100], Gannett Co[100], Sprouts Farmers[100], MINISO [100], Smart Share[100], Thomson Reuters[100], Gray Television[100], WESCO [100], Alibaba [100], Tetra Tech[100], Hesai [100]
Best Consumer Services Stocks Year-to-Date:
U Power[2974.78%], Vroom [1965.31%], Yatsen Holding[475.45%], Fluent [397.76%], Research[136.47%], Codere Online[132.88%], Carvana Co[120.06%], Sweetgreen [88.85%], RealReal [87.06%], Smart Share[68.74%], PaySign [65.36%] Best Consumer Services Stocks This Week:
Chicken Soup[156.52%], Smart Share[39.89%], Carvana Co[38.18%], Perdoceo Education[28.15%], Olaplex [24.63%], CareDx [22.75%], Polestar Automotive[21.61%], XPeng [19.9%], Gannett Co[18.6%], OneSpaWorld [16.2%], Li Auto[15.79%] Best Consumer Services Stocks Daily:
Carvana Co[33.77%], Perdoceo Education[31.79%], Gannett Co[26.97%], Sunnova Energy[25.21%], Chicken Soup[20.41%], Olaplex [19.29%], GameStop [16.96%], Wayfair [16.05%], XPeng [15.76%], Children s[14.58%], OneWater Marine[14.09%]