
 Login Sign Up


| |||||
 |  | ||||

| 12Stocks.com Market Intelligence |
Best Consumer Services Stocks
| In a hurry? Services & Goods Stocks: Performance Trends Table, Stock Charts
Sort Consumer Services: Daily, Weekly, Year-to-Date, Market Cap & Trends. Filter Services & Goods stocks list by size: All Large Mid-Range Small |
| 12Stocks.com Consumer Services Stocks Performances & Trends Daily | |||||||||
|
|  The overall Smart Investing & Trading Score is 35 (0-bearish to 100-bullish) which puts Consumer Services sector in short term bearish to neutral trend. The Smart Investing & Trading Score from previous trading session is 7 and hence an improvement of trend.
| ||||||||
Here are the Smart Investing & Trading Scores of the most requested Consumer Services stocks at 12Stocks.com (click stock name for detailed review):
|


| Consider signing up for our daily 12Stocks.com "Best Stocks Newsletter". You will never ever miss a big stock move again! |
| 12Stocks.com: Investing in Consumer Services sector with Stocks | |
|
The following table helps investors and traders sort through current performance and trends (as measured by Smart Investing & Trading Score) of various
stocks in the Consumer Services sector. Quick View: Move mouse or cursor over stock symbol (ticker) to view short-term Technical chart and over stock name to view long term chart. Click on  to add stock symbol to your watchlist and to add stock symbol to your watchlist and  to view watchlist. Click on any ticker or stock name for detailed market intelligence report for that stock. to view watchlist. Click on any ticker or stock name for detailed market intelligence report for that stock. |
12Stocks.com Performance of Stocks in Consumer Services Sector
| Ticker | Stock Name | Watchlist | Category | Recent Price | Smart Investing & Trading Score | Change % | YTD Change% |
| CMPR | Cimpress |   | Services | 82.43 | 0 | -2.22% | 2.97% |
| PDCO | Patterson | | Medical | 25.43 | 18 | -0.08% | -10.62% |
| DKS | DICK S | | Retail | 199.19 | 38 | 0.54% | 35.55% |
| BZUN | Baozun | | Retail | 2.87 | 95 | 6.30% | 4.74% |
| PSMT | PriceSmart | | Retail | 82.08 | 52 | 0.65% | 8.31% |
| BYD | Boyd Gaming | | Casinos | 54.16 | 25 | 1.52% | -13.50% |
| URBN | Urban Outfitters | | Apparel | 39.39 | 27 | 2.31% | 10.37% |
| PTLO | Portillos | | Restaurants | 11.90 | 10 | -1.12% | -25.89% |
| AEO | American Eagle | | Apparel | 24.47 | 75 | 3.25% | 15.64% |
| SEAT | Vivid Seats | | Internet Content & Information | 5.24 | 7 | 0.77% | -16.11% |
| AFYA | Afya | | Education | 17.41 | 44 | 0.78% | -20.59% |
| KFY | Korn Ferry | | Staffing | 61.87 | 32 | 1.13% | 4.25% |
| AIT | Applied Industrial | | Equipment | 184.63 | 17 | 2.21% | 6.91% |
| SHAK | Shake Shack | | Restaurants | 104.94 | 95 | 1.56% | 41.58% |
| MBC | MasterBrand | | Furnishings, Fixtures & Appliances | 16.94 | 10 | 1.26% | 13.50% |
| AMCX | AMC Networks | | Entertainment | 11.53 | 62 | 4.34% | -38.64% |
| SBGI | Slair Broadcast | | Broadcasting | 13.28 | 74 | 3.83% | 1.92% |
| ARHS | Arhaus | | Home Improvement Retail | 12.91 | 17 | 0.55% | 8.21% |
| PSNYW | Polestar Automotive | | Auto Manufacturers | 0.15 | 18 | 0.00% | -38.19% |
| FUN | Cedar Fair | | Entertainment | 37.86 | 25 | -0.63% | -4.87% |
| MMYT | MakeMyTrip | | Entertainment | 70.51 | 85 | 4.43% | 50.09% |
| MSC | Studio City | | Casinos | 7.58 | 41 | -0.02% | 16.98% |
| SG | Sweetgreen | | Restaurants | 21.34 | 31 | 7.18% | 88.85% |
| GENI | Genius Sports | | Internet Content & Information | 5.13 | 20 | 1.89% | -17.67% |
| SSTK | Shutterstock | | Services | 41.75 | 35 | -1.63% | -13.53% |
| For chart view version of above stock list: Chart View ➞ 0 - 25 , 25 - 50 , 50 - 75 , 75 - 100 , 100 - 125 , 125 - 150 , 150 - 175 , 175 - 200 , 200 - 225 , 225 - 250 , 250 - 275 , 275 - 300 , 300 - 325 , 325 - 350 , 350 - 375 , 375 - 400 , 400 - 425 , 425 - 450 , 450 - 475 | ||
 | Click To Change The Sort Order: By Market Cap or Company Size Performance: Year-to-date, Week and Day |  |
|
Get the most comprehensive stock market coverage daily at 12Stocks.com ➞ Best Stocks Today ➞ Best Stocks Weekly ➞ Best Stocks Year-to-Date ➞ Best Stocks Trends ➞  Best Stocks Today 12Stocks.com Best Nasdaq Stocks ➞ Best S&P 500 Stocks ➞ Best Tech Stocks ➞ Best Biotech Stocks ➞ |
| Detailed Overview of Consumer Services Stocks |
| Consumer Services Technical Overview, Leaders & Laggards, Top Consumer Services ETF Funds & Detailed Consumer Services Stocks List, Charts, Trends & More |
| Consumer Services Sector: Technical Analysis, Trends & YTD Performance | |
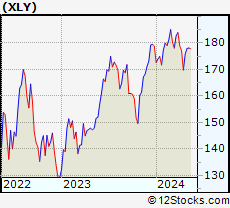
| Consumer Services sector is composed of stocks
from retail, entertainment, media/publishing, consumer goods
and services subsectors. Consumer Services sector, as represented by XLY, an exchange-traded fund [ETF] that holds basket of Consumer Services stocks (e.g, Walmart, Alibaba) is down by -1.17% and is currently underperforming the overall market by -6.79% year-to-date. Below is a quick view of Technical charts and trends: |
|
 XLY Weekly Chart |
|
| Long Term Trend: Not Good | |
| Medium Term Trend: Deteriorating | |
 XLY Daily Chart |
|
| Short Term Trend: Deteriorating | |
| Overall Trend Score: 35 | |
| YTD Performance: -1.17% | |
| **Trend Scores & Views Are Only For Educational Purposes And Not For Investing | |
| 12Stocks.com: Top Performing Consumer Services Sector Stocks | ||||||||||||||||||||||||||||||||||||||||||||||||
 The top performing Consumer Services sector stocks year to date are
Now, more recently, over last week, the top performing Consumer Services sector stocks on the move are


|
||||||||||||||||||||||||||||||||||||||||||||||||
| 12Stocks.com: Investing in Consumer Services Sector using Exchange Traded Funds | |
|
The following table shows list of key exchange traded funds (ETF) that
help investors track Consumer Services Index. For detailed view, check out our ETF Funds section of our website. Quick View: Move mouse or cursor over ETF symbol (ticker) to view short-term Technical chart and over ETF name to view long term chart. Click on ticker or stock name for detailed view. Click on to add stock symbol to your watchlist and to view watchlist. |
12Stocks.com List of ETFs that track Consumer Services Index
| Ticker | ETF Name | Watchlist | Recent Price | Smart Investing & Trading Score | Change % | Week % | Year-to-date % |
| XLY | Consumer Discret Sel | | 176.72 | 35 | 1.26 | 0.46 | -1.17% |
| RTH | Retail | | 199.00 | 7 | 1.49 | -1.03 | 5.72% |
| IYC | Consumer Services | | 78.35 | 7 | 1.28 | -0.01 | 3.41% |
| XRT | Retail | | 72.49 | 25 | 1.70 | -1 | 0.24% |
| IYK | Consumer Goods | | 66.46 | 63 | 0.51 | -0.45 | 4% |
| UCC | Consumer Services | | 33.96 | 49 | 1.98 | -0.59 | -5.42% |
| RETL | Retail Bull 3X | | 8.53 | 5 | 5.44 | -3.4 | -6.47% |
| RXI | Globl Consumer Discretionary | | 161.47 | 27 | 1.46 | 0.18 | 1.52% |
| SCC | Short Consumer Services | | 15.66 | 88 | -1.97 | -0.73 | 2.23% |
| UGE | Consumer Goods | | 16.92 | 80 | 0.39 | -1.46 | 7.49% |
| 12Stocks.com: Charts, Trends, Fundamental Data and Performances of Consumer Services Stocks | |
|
We now take in-depth look at all Consumer Services stocks including charts, multi-period performances and overall trends (as measured by Smart Investing & Trading Score). One can sort Consumer Services stocks (click link to choose) by Daily, Weekly and by Year-to-Date performances. Also, one can sort by size of the company or by market capitalization. |
| Select Your Default Chart Type: | |||||
| |||||
| Click on stock symbol or name for detailed view. Click on to add stock symbol to your watchlist and to view watchlist. Quick View: Move mouse or cursor over "Daily" to quickly view daily Technical stock chart and over "Weekly" to view weekly Technical stock chart. | |||||

 | CMPR Cimpress plc |
| Sector: Services & Goods | |
| SubSector: Business Services | |
| MarketCap: 1675.02 Millions | |
| Recent Price: 82.43 Smart Investing & Trading Score: 0 | |
| Day Percent Change: -2.22% Day Change: -1.87 | |
| Week Change: -7.47% Year-to-date Change: 3.0% | |
| CMPR Links: Profile News Message Board | |
| Charts:- Daily , Weekly | |
| Add CMPR to Watchlist: View: Get Complete CMPR Trend Analysis ➞ | |
 | PDCO Patterson Companies, Inc. |
| Sector: Services & Goods | |
| SubSector: Medical Equipment Wholesale | |
| MarketCap: 1672.2 Millions | |
| Recent Price: 25.43 Smart Investing & Trading Score: 18 | |
| Day Percent Change: -0.08% Day Change: -0.02 | |
| Week Change: -1.32% Year-to-date Change: -10.6% | |
| PDCO Links: Profile News Message Board | |
| Charts:- Daily , Weekly | |
| Add PDCO to Watchlist: View: Get Complete PDCO Trend Analysis ➞ | |
 | DKS DICK S Sporting Goods, Inc. |
| Sector: Services & Goods | |
| SubSector: Sporting Goods Stores | |
| MarketCap: 1672.04 Millions | |
| Recent Price: 199.19 Smart Investing & Trading Score: 38 | |
| Day Percent Change: 0.54% Day Change: 1.07 | |
| Week Change: -3.83% Year-to-date Change: 35.6% | |
| DKS Links: Profile News Message Board | |
| Charts:- Daily , Weekly | |
| Add DKS to Watchlist: View: Get Complete DKS Trend Analysis ➞ | |
 | BZUN Baozun Inc. |
| Sector: Services & Goods | |
| SubSector: Catalog & Mail Order Houses | |
| MarketCap: 1668.92 Millions | |
| Recent Price: 2.87 Smart Investing & Trading Score: 95 | |
| Day Percent Change: 6.30% Day Change: 0.17 | |
| Week Change: 4.36% Year-to-date Change: 4.7% | |
| BZUN Links: Profile News Message Board | |
| Charts:- Daily , Weekly | |
| Add BZUN to Watchlist: View: Get Complete BZUN Trend Analysis ➞ | |
 | PSMT PriceSmart, Inc. |
| Sector: Services & Goods | |
| SubSector: Discount, Variety Stores | |
| MarketCap: 1655.72 Millions | |
| Recent Price: 82.08 Smart Investing & Trading Score: 52 | |
| Day Percent Change: 0.65% Day Change: 0.53 | |
| Week Change: 0.72% Year-to-date Change: 8.3% | |
| PSMT Links: Profile News Message Board | |
| Charts:- Daily , Weekly | |
| Add PSMT to Watchlist: View: Get Complete PSMT Trend Analysis ➞ | |
 | BYD Boyd Gaming Corporation |
| Sector: Services & Goods | |
| SubSector: Resorts & Casinos | |
| MarketCap: 1652.54 Millions | |
| Recent Price: 54.16 Smart Investing & Trading Score: 25 | |
| Day Percent Change: 1.52% Day Change: 0.81 | |
| Week Change: 1.84% Year-to-date Change: -13.5% | |
| BYD Links: Profile News Message Board | |
| Charts:- Daily , Weekly | |
| Add BYD to Watchlist: View: Get Complete BYD Trend Analysis ➞ | |
 | URBN Urban Outfitters, Inc. |
| Sector: Services & Goods | |
| SubSector: Apparel Stores | |
| MarketCap: 1638.08 Millions | |
| Recent Price: 39.39 Smart Investing & Trading Score: 27 | |
| Day Percent Change: 2.31% Day Change: 0.89 | |
| Week Change: -2.81% Year-to-date Change: 10.4% | |
| URBN Links: Profile News Message Board | |
| Charts:- Daily , Weekly | |
| Add URBN to Watchlist: View: Get Complete URBN Trend Analysis ➞ | |
 | PTLO Portillos Inc. |
| Sector: Services & Goods | |
| SubSector: Restaurants | |
| MarketCap: 1590 Millions | |
| Recent Price: 11.90 Smart Investing & Trading Score: 10 | |
| Day Percent Change: -1.12% Day Change: -0.13 | |
| Week Change: -1.04% Year-to-date Change: -25.9% | |
| PTLO Links: Profile News Message Board | |
| Charts:- Daily , Weekly | |
| Add PTLO to Watchlist: View: Get Complete PTLO Trend Analysis ➞ | |
 | AEO American Eagle Outfitters, Inc. |
| Sector: Services & Goods | |
| SubSector: Apparel Stores | |
| MarketCap: 1577.08 Millions | |
| Recent Price: 24.47 Smart Investing & Trading Score: 75 | |
| Day Percent Change: 3.25% Day Change: 0.77 | |
| Week Change: 0.33% Year-to-date Change: 15.6% | |
| AEO Links: Profile News Message Board | |
| Charts:- Daily , Weekly | |
| Add AEO to Watchlist: View: Get Complete AEO Trend Analysis ➞ | |
 | SEAT Vivid Seats Inc. |
| Sector: Services & Goods | |
| SubSector: Internet Content & Information | |
| MarketCap: 1560 Millions | |
| Recent Price: 5.24 Smart Investing & Trading Score: 7 | |
| Day Percent Change: 0.77% Day Change: 0.04 | |
| Week Change: -11.65% Year-to-date Change: -16.1% | |
| SEAT Links: Profile News Message Board | |
| Charts:- Daily , Weekly | |
| Add SEAT to Watchlist: View: Get Complete SEAT Trend Analysis ➞ | |
 | AFYA Afya Limited |
| Sector: Services & Goods | |
| SubSector: Education & Training Services | |
| MarketCap: 1559.26 Millions | |
| Recent Price: 17.41 Smart Investing & Trading Score: 44 | |
| Day Percent Change: 0.78% Day Change: 0.13 | |
| Week Change: -2.93% Year-to-date Change: -20.6% | |
| AFYA Links: Profile News Message Board | |
| Charts:- Daily , Weekly | |
| Add AFYA to Watchlist: View: Get Complete AFYA Trend Analysis ➞ | |
 | KFY Korn Ferry |
| Sector: Services & Goods | |
| SubSector: Staffing & Outsourcing Services | |
| MarketCap: 1534.28 Millions | |
| Recent Price: 61.87 Smart Investing & Trading Score: 32 | |
| Day Percent Change: 1.13% Day Change: 0.69 | |
| Week Change: 1.41% Year-to-date Change: 4.3% | |
| KFY Links: Profile News Message Board | |
| Charts:- Daily , Weekly | |
| Add KFY to Watchlist: View: Get Complete KFY Trend Analysis ➞ | |
 | AIT Applied Industrial Technologies, Inc. |
| Sector: Services & Goods | |
| SubSector: Industrial Equipment Wholesale | |
| MarketCap: 1531.58 Millions | |
| Recent Price: 184.63 Smart Investing & Trading Score: 17 | |
| Day Percent Change: 2.21% Day Change: 4.00 | |
| Week Change: 2.07% Year-to-date Change: 6.9% | |
| AIT Links: Profile News Message Board | |
| Charts:- Daily , Weekly | |
| Add AIT to Watchlist: View: Get Complete AIT Trend Analysis ➞ | |
 | SHAK Shake Shack Inc. |
| Sector: Services & Goods | |
| SubSector: Specialty Eateries | |
| MarketCap: 1497.67 Millions | |
| Recent Price: 104.94 Smart Investing & Trading Score: 95 | |
| Day Percent Change: 1.56% Day Change: 1.61 | |
| Week Change: 0.06% Year-to-date Change: 41.6% | |
| SHAK Links: Profile News Message Board | |
| Charts:- Daily , Weekly | |
| Add SHAK to Watchlist: View: Get Complete SHAK Trend Analysis ➞ | |
 | MBC MasterBrand, Inc. |
| Sector: Services & Goods | |
| SubSector: Furnishings, Fixtures & Appliances | |
| MarketCap: 1480 Millions | |
| Recent Price: 16.94 Smart Investing & Trading Score: 10 | |
| Day Percent Change: 1.26% Day Change: 0.21 | |
| Week Change: -0.59% Year-to-date Change: 13.5% | |
| MBC Links: Profile News Message Board | |
| Charts:- Daily , Weekly | |
| Add MBC to Watchlist: View: Get Complete MBC Trend Analysis ➞ | |
 | AMCX AMC Networks Inc. |
| Sector: Services & Goods | |
| SubSector: Entertainment - Diversified | |
| MarketCap: 1477.37 Millions | |
| Recent Price: 11.53 Smart Investing & Trading Score: 62 | |
| Day Percent Change: 4.34% Day Change: 0.48 | |
| Week Change: 6.46% Year-to-date Change: -38.6% | |
| AMCX Links: Profile News Message Board | |
| Charts:- Daily , Weekly | |
| Add AMCX to Watchlist: View: Get Complete AMCX Trend Analysis ➞ | |
 | SBGI Sinclair Broadcast Group, Inc. |
| Sector: Services & Goods | |
| SubSector: Broadcasting - TV | |
| MarketCap: 1461.73 Millions | |
| Recent Price: 13.28 Smart Investing & Trading Score: 74 | |
| Day Percent Change: 3.83% Day Change: 0.49 | |
| Week Change: 9.57% Year-to-date Change: 1.9% | |
| SBGI Links: Profile News Message Board | |
| Charts:- Daily , Weekly | |
| Add SBGI to Watchlist: View: Get Complete SBGI Trend Analysis ➞ | |
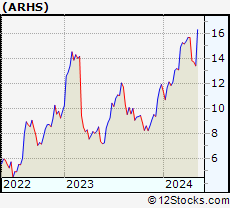 | ARHS Arhaus, Inc. |
| Sector: Services & Goods | |
| SubSector: Home Improvement Retail | |
| MarketCap: 1450 Millions | |
| Recent Price: 12.91 Smart Investing & Trading Score: 17 | |
| Day Percent Change: 0.55% Day Change: 0.07 | |
| Week Change: -5.97% Year-to-date Change: 8.2% | |
| ARHS Links: Profile News Message Board | |
| Charts:- Daily , Weekly | |
| Add ARHS to Watchlist: View: Get Complete ARHS Trend Analysis ➞ | |
 | PSNYW Polestar Automotive Holding UK PLC |
| Sector: Services & Goods | |
| SubSector: Auto Manufacturers | |
| MarketCap: 1450 Millions | |
| Recent Price: 0.15 Smart Investing & Trading Score: 18 | |
| Day Percent Change: 0.00% Day Change: 0.00 | |
| Week Change: -5.78% Year-to-date Change: -38.2% | |
| PSNYW Links: Profile News Message Board | |
| Charts:- Daily , Weekly | |
| Add PSNYW to Watchlist: View: Get Complete PSNYW Trend Analysis ➞ | |
 | FUN Cedar Fair, L.P. |
| Sector: Services & Goods | |
| SubSector: General Entertainment | |
| MarketCap: 1440.49 Millions | |
| Recent Price: 37.86 Smart Investing & Trading Score: 25 | |
| Day Percent Change: -0.63% Day Change: -0.24 | |
| Week Change: -1.2% Year-to-date Change: -4.9% | |
| FUN Links: Profile News Message Board | |
| Charts:- Daily , Weekly | |
| Add FUN to Watchlist: View: Get Complete FUN Trend Analysis ➞ | |
 | MMYT MakeMyTrip Limited |
| Sector: Services & Goods | |
| SubSector: General Entertainment | |
| MarketCap: 1429.59 Millions | |
| Recent Price: 70.51 Smart Investing & Trading Score: 85 | |
| Day Percent Change: 4.43% Day Change: 2.99 | |
| Week Change: 4.51% Year-to-date Change: 50.1% | |
| MMYT Links: Profile News Message Board | |
| Charts:- Daily , Weekly | |
| Add MMYT to Watchlist: View: Get Complete MMYT Trend Analysis ➞ | |
 | MSC Studio City International Holdings Limited |
| Sector: Services & Goods | |
| SubSector: Resorts & Casinos | |
| MarketCap: 1420.54 Millions | |
| Recent Price: 7.58 Smart Investing & Trading Score: 41 | |
| Day Percent Change: -0.02% Day Change: 0.00 | |
| Week Change: 6.54% Year-to-date Change: 17.0% | |
| MSC Links: Profile News Message Board | |
| Charts:- Daily , Weekly | |
| Add MSC to Watchlist: View: Get Complete MSC Trend Analysis ➞ | |
 | SG Sweetgreen, Inc. |
| Sector: Services & Goods | |
| SubSector: Restaurants | |
| MarketCap: 1420 Millions | |
| Recent Price: 21.34 Smart Investing & Trading Score: 31 | |
| Day Percent Change: 7.18% Day Change: 1.43 | |
| Week Change: -12.97% Year-to-date Change: 88.9% | |
| SG Links: Profile News Message Board | |
| Charts:- Daily , Weekly | |
| Add SG to Watchlist: View: Get Complete SG Trend Analysis ➞ | |
 | GENI Genius Sports Limited |
| Sector: Services & Goods | |
| SubSector: Internet Content & Information | |
| MarketCap: 1410 Millions | |
| Recent Price: 5.13 Smart Investing & Trading Score: 20 | |
| Day Percent Change: 1.89% Day Change: 0.09 | |
| Week Change: -1.25% Year-to-date Change: -17.7% | |
| GENI Links: Profile News Message Board | |
| Charts:- Daily , Weekly | |
| Add GENI to Watchlist: View: Get Complete GENI Trend Analysis ➞ | |
 | SSTK Shutterstock, Inc. |
| Sector: Services & Goods | |
| SubSector: Business Services | |
| MarketCap: 1409.62 Millions | |
| Recent Price: 41.75 Smart Investing & Trading Score: 35 | |
| Day Percent Change: -1.63% Day Change: -0.69 | |
| Week Change: -1.44% Year-to-date Change: -13.5% | |
| SSTK Links: Profile News Message Board | |
| Charts:- Daily , Weekly | |
| Add SSTK to Watchlist: View: Get Complete SSTK Trend Analysis ➞ | |
| For tabular summary view of above stock list: Summary View ➞ 0 - 25 , 25 - 50 , 50 - 75 , 75 - 100 , 100 - 125 , 125 - 150 , 150 - 175 , 175 - 200 , 200 - 225 , 225 - 250 , 250 - 275 , 275 - 300 , 300 - 325 , 325 - 350 , 350 - 375 , 375 - 400 , 400 - 425 , 425 - 450 , 450 - 475 | ||
| Click To Change The Sort Order: By Market Cap or Company Size Performance: Year-to-date, Week and Day | |
| Select Chart Type: | ||
|
Best Stocks Today 12Stocks.com |
© 2024 12Stocks.com Terms & Conditions Privacy Contact Us
All Information Provided Only For Education And Not To Be Used For Investing or Trading. See Terms & Conditions


One More Thing ... Get Best Stocks Delivered Daily!
Never Ever Miss A Move With Our Top Ten Stocks Lists
Find Best Stocks In Any Market - Bull or Bear Market
Take A Peek At Our Top Ten Stocks Lists: Daily, Weekly, Year-to-Date & Top Trends
Find Best Stocks In Any Market - Bull or Bear Market
Take A Peek At Our Top Ten Stocks Lists: Daily, Weekly, Year-to-Date & Top Trends
Consumer Services Stocks With Best Up Trends [0-bearish to 100-bullish]: Perdoceo Education[100], Gannett Co[100], Sprouts Farmers[100], MINISO [100], Smart Share[100], Thomson Reuters[100], Gray Television[100], WESCO [100], Alibaba [100], Tetra Tech[100], Hesai [100]
Best Consumer Services Stocks Year-to-Date:
U Power[2974.78%], Vroom [1965.31%], Yatsen Holding[475.45%], Fluent [397.76%], Research[136.47%], Codere Online[132.88%], Carvana Co[120.06%], Sweetgreen [88.85%], RealReal [87.06%], Smart Share[68.74%], PaySign [65.36%] Best Consumer Services Stocks This Week:
Chicken Soup[156.52%], Smart Share[39.89%], Carvana Co[38.18%], Perdoceo Education[28.15%], Olaplex [24.63%], CareDx [22.75%], Polestar Automotive[21.61%], XPeng [19.9%], Gannett Co[18.6%], OneSpaWorld [16.2%], Li Auto[15.79%] Best Consumer Services Stocks Daily:
Carvana Co[33.77%], Perdoceo Education[31.79%], Gannett Co[26.97%], Sunnova Energy[25.21%], Chicken Soup[20.41%], Olaplex [19.29%], GameStop [16.96%], Wayfair [16.05%], XPeng [15.76%], Children s[14.58%], OneWater Marine[14.09%]