
 Login Sign Up


| |||||
 |  | ||||

| 12Stocks.com Market Intelligence |
Best Consumer Services Stocks
| In a hurry? Services & Goods Stocks: Performance Trends Table, Stock Charts
Sort Consumer Services: Daily, Weekly, Year-to-Date, Market Cap & Trends. Filter Services & Goods stocks list by size: All Large Mid-Range Small |
| 12Stocks.com Consumer Services Stocks Performances & Trends Daily | |||||||||
|
|  The overall Smart Investing & Trading Score is 64 (0-bearish to 100-bullish) which puts Consumer Services sector in short term neutral to bullish trend. The Smart Investing & Trading Score from previous trading session is 57 and hence an improvement of trend.
| ||||||||
Here are the Smart Investing & Trading Scores of the most requested Consumer Services stocks at 12Stocks.com (click stock name for detailed review):
|


| Consider signing up for our daily 12Stocks.com "Best Stocks Newsletter". You will never ever miss a big stock move again! |
| 12Stocks.com: Investing in Consumer Services sector with Stocks | |
|
The following table helps investors and traders sort through current performance and trends (as measured by Smart Investing & Trading Score) of various
stocks in the Consumer Services sector. Quick View: Move mouse or cursor over stock symbol (ticker) to view short-term Technical chart and over stock name to view long term chart. Click on  to add stock symbol to your watchlist and to add stock symbol to your watchlist and  to view watchlist. Click on any ticker or stock name for detailed market intelligence report for that stock. to view watchlist. Click on any ticker or stock name for detailed market intelligence report for that stock. |
12Stocks.com Performance of Stocks in Consumer Services Sector
| Ticker | Stock Name | Watchlist | Category | Recent Price | Smart Investing & Trading Score | Change % | Weekly Change% |
| VRM | Vroom |   | Auto & Truck Dealerships | 15.56 | 100 | 19.33% | 19.33% |
| LCID | Lucid | | Auto Manufacturers | 3.08 | 74 | 10.79% | 10.79% |
| TW | Tradeweb Markets | | Services | 109.28 | 95 | 4.53% | 4.53% |
| BAH | Booz Allen | | Services | 152.88 | 95 | 3.82% | 3.82% |
| LI | Li Auto | | Auto Manufacturers | 29.02 | 64 | 3.70% | 3.70% |
| TRU | TransUnion | | Services | 79.74 | 100 | 3.46% | 3.46% |
| RIVN | Rivian Automotive | | Auto Manufacturers | 10.34 | 69 | 2.58% | 2.58% |
| DIS | Walt Disney | | Entertainment | 116.47 | 90 | 2.47% | 2.47% |
| ONEW | OneWater Marine | | Recreational | 23.24 | 42 | 2.47% | 2.47% |
| TJX | TJX | | Department | 97.45 | 64 | 2.46% | 2.46% |
| ONON | On Holding | | Footwear & Accessories | 34.06 | 69 | 2.39% | 2.39% |
| RBLX | Roblox | | Electronic Gaming & Multimedia | 40.13 | 87 | 2.26% | 2.26% |
| ROL | Rollins | | Services | 47.10 | 100 | 2.12% | 2.12% |
| VRSK | Verisk Analytics | | Services | 241.94 | 87 | 1.94% | 1.94% |
| MCO | Moody s | | Services | 387.70 | 90 | 1.88% | 1.88% |
| CTAS | Cintas | | Services | 686.06 | 85 | 1.78% | 1.78% |
| COST | Costco Wholesale | | Retail | 756.71 | 95 | 1.72% | 1.72% |
| ALLE | Allegion | | Security | 124.88 | 50 | 1.63% | 1.63% |
| SIRI | Sirius XM | | Broadcasting | 3.17 | 57 | 1.60% | 1.60% |
| DPZ | Domino s | | Restaurants | 522.38 | 95 | 1.57% | 1.57% |
| FOX | Twenty-First Century | | Entertainment | 30.03 | 100 | 1.52% | 1.52% |
| CPNG | Coupang | | Internet Retail | 23.35 | 95 | 1.50% | 1.50% |
| FOXA | Fox | | Entertainment | 32.56 | 100 | 1.42% | 1.42% |
| TRI | Thomson Reuters | | Publishing | 167.07 | 100 | 1.41% | 1.41% |
| QS | QuantumScape | | Auto Parts | 5.78 | 69 | 1.40% | 1.40% |
| For chart view version of above stock list: Chart View ➞ 0 - 25 , 25 - 50 , 50 - 75 , 75 - 100 , 100 - 125 | ||
 | Click To Change The Sort Order: By Market Cap or Company Size Performance: Year-to-date, Week and Day |  |
|
Get the most comprehensive stock market coverage daily at 12Stocks.com ➞ Best Stocks Today ➞ Best Stocks Weekly ➞ Best Stocks Year-to-Date ➞ Best Stocks Trends ➞  Best Stocks Today 12Stocks.com Best Nasdaq Stocks ➞ Best S&P 500 Stocks ➞ Best Tech Stocks ➞ Best Biotech Stocks ➞ |
| Detailed Overview of Consumer Services Stocks |
| Consumer Services Technical Overview, Leaders & Laggards, Top Consumer Services ETF Funds & Detailed Consumer Services Stocks List, Charts, Trends & More |
| Consumer Services Sector: Technical Analysis, Trends & YTD Performance | |
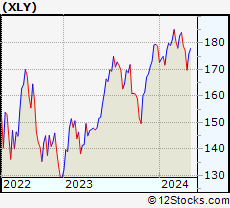
| Consumer Services sector is composed of stocks
from retail, entertainment, media/publishing, consumer goods
and services subsectors. Consumer Services sector, as represented by XLY, an exchange-traded fund [ETF] that holds basket of Consumer Services stocks (e.g, Walmart, Alibaba) is up by 0.56% and is currently underperforming the overall market by -7.46% year-to-date. Below is a quick view of Technical charts and trends: |
|
 XLY Weekly Chart |
|
| Long Term Trend: Not Good | |
| Medium Term Trend: Very Good | |
 XLY Daily Chart |
|
| Short Term Trend: Very Good | |
| Overall Trend Score: 64 | |
| YTD Performance: 0.56% | |
| **Trend Scores & Views Are Only For Educational Purposes And Not For Investing | |
| 12Stocks.com: Top Performing Consumer Services Sector Stocks | ||||||||||||||||||||||||||||||||||||||||||||||||
 The top performing Consumer Services sector stocks year to date are
Now, more recently, over last week, the top performing Consumer Services sector stocks on the move are


|
||||||||||||||||||||||||||||||||||||||||||||||||
| 12Stocks.com: Investing in Consumer Services Sector using Exchange Traded Funds | |
|
The following table shows list of key exchange traded funds (ETF) that
help investors track Consumer Services Index. For detailed view, check out our ETF Funds section of our website. Quick View: Move mouse or cursor over ETF symbol (ticker) to view short-term Technical chart and over ETF name to view long term chart. Click on ticker or stock name for detailed view. Click on to add stock symbol to your watchlist and to view watchlist. |
12Stocks.com List of ETFs that track Consumer Services Index
| Ticker | ETF Name | Watchlist | Recent Price | Smart Investing & Trading Score | Change % | Week % | Year-to-date % |
| XLY | Consumer Discret Sel | | 179.81 | 64 | 1.07 | 1.07 | 0.56% |
| RTH | Retail | | 200.36 | 40 | -0.08 | -0.08 | 6.44% |
| IYC | Consumer Services | | 79.98 | 64 | 1.13 | 1.13 | 5.56% |
| XRT | Retail | | 74.29 | 69 | 1.18 | 1.18 | 2.72% |
| IYK | Consumer Goods | | 66.59 | 66 | 0.00 | 0 | 4.2% |
| UCC | Consumer Services | | 35.27 | 64 | 3.53 | 3.53 | -1.78% |
| RETL | Retail Bull 3X | | 9.12 | 69 | 3.28 | 3.28 | 0% |
| RXI | Globl Consumer Discretionary | | 164.25 | 64 | 0.70 | 0.7 | 3.26% |
| SCC | Short Consumer Services | | 15.24 | 36 | -0.95 | -0.95 | -0.55% |
| UGE | Consumer Goods | | 17.23 | 90 | -0.23 | -0.23 | 9.46% |
| 12Stocks.com: Charts, Trends, Fundamental Data and Performances of Consumer Services Stocks | |
|
We now take in-depth look at all Consumer Services stocks including charts, multi-period performances and overall trends (as measured by Smart Investing & Trading Score). One can sort Consumer Services stocks (click link to choose) by Daily, Weekly and by Year-to-Date performances. Also, one can sort by size of the company or by market capitalization. |
| Select Your Default Chart Type: | |||||
| |||||
| Click on stock symbol or name for detailed view. Click on to add stock symbol to your watchlist and to view watchlist. Quick View: Move mouse or cursor over "Daily" to quickly view daily Technical stock chart and over "Weekly" to view weekly Technical stock chart. | |||||

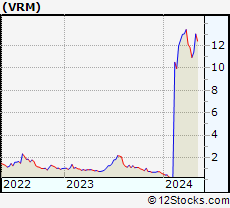 | VRM Vroom, Inc. |
| Sector: Services & Goods | |
| SubSector: Auto & Truck Dealerships | |
| MarketCap: 44327 Millions | |
| Recent Price: 15.56 Smart Investing & Trading Score: 100 | |
| Day Percent Change: 19.33% Day Change: 2.52 | |
| Week Change: 19.33% Year-to-date Change: 2,479.2% | |
| VRM Links: Profile News Message Board | |
| Charts:- Daily , Weekly | |
| Add VRM to Watchlist: View: Get Complete VRM Trend Analysis ➞ | |
 | LCID Lucid Group, Inc. |
| Sector: Services & Goods | |
| SubSector: Auto Manufacturers | |
| MarketCap: 12910 Millions | |
| Recent Price: 3.08 Smart Investing & Trading Score: 74 | |
| Day Percent Change: 10.79% Day Change: 0.30 | |
| Week Change: 10.79% Year-to-date Change: -26.2% | |
| LCID Links: Profile News Message Board | |
| Charts:- Daily , Weekly | |
| Add LCID to Watchlist: View: Get Complete LCID Trend Analysis ➞ | |
 | TW Tradeweb Markets Inc. |
| Sector: Services & Goods | |
| SubSector: Management Services | |
| MarketCap: 9913.35 Millions | |
| Recent Price: 109.28 Smart Investing & Trading Score: 95 | |
| Day Percent Change: 4.53% Day Change: 4.73 | |
| Week Change: 4.53% Year-to-date Change: 20.2% | |
| TW Links: Profile News Message Board | |
| Charts:- Daily , Weekly | |
| Add TW to Watchlist: View: Get Complete TW Trend Analysis ➞ | |
 | BAH Booz Allen Hamilton Holding Corporation |
| Sector: Services & Goods | |
| SubSector: Management Services | |
| MarketCap: 9037.35 Millions | |
| Recent Price: 152.88 Smart Investing & Trading Score: 95 | |
| Day Percent Change: 3.82% Day Change: 5.63 | |
| Week Change: 3.82% Year-to-date Change: 19.5% | |
| BAH Links: Profile News Message Board | |
| Charts:- Daily , Weekly | |
| Add BAH to Watchlist: View: Get Complete BAH Trend Analysis ➞ | |
 | LI Li Auto Inc. |
| Sector: Services & Goods | |
| SubSector: Auto Manufacturers | |
| MarketCap: 29167 Millions | |
| Recent Price: 29.02 Smart Investing & Trading Score: 64 | |
| Day Percent Change: 3.70% Day Change: 1.04 | |
| Week Change: 3.7% Year-to-date Change: -22.5% | |
| LI Links: Profile News Message Board | |
| Charts:- Daily , Weekly | |
| Add LI to Watchlist: View: Get Complete LI Trend Analysis ➞ | |
 | TRU TransUnion |
| Sector: Services & Goods | |
| SubSector: Business Services | |
| MarketCap: 11457.2 Millions | |
| Recent Price: 79.74 Smart Investing & Trading Score: 100 | |
| Day Percent Change: 3.46% Day Change: 2.67 | |
| Week Change: 3.46% Year-to-date Change: 16.1% | |
| TRU Links: Profile News Message Board | |
| Charts:- Daily , Weekly | |
| Add TRU to Watchlist: View: Get Complete TRU Trend Analysis ➞ | |
 | RIVN Rivian Automotive, Inc. |
| Sector: Services & Goods | |
| SubSector: Auto Manufacturers | |
| MarketCap: 14310 Millions | |
| Recent Price: 10.34 Smart Investing & Trading Score: 69 | |
| Day Percent Change: 2.58% Day Change: 0.26 | |
| Week Change: 2.58% Year-to-date Change: -55.9% | |
| RIVN Links: Profile News Message Board | |
| Charts:- Daily , Weekly | |
| Add RIVN to Watchlist: View: Get Complete RIVN Trend Analysis ➞ | |
 | DIS The Walt Disney Company |
| Sector: Services & Goods | |
| SubSector: Entertainment - Diversified | |
| MarketCap: 178396 Millions | |
| Recent Price: 116.47 Smart Investing & Trading Score: 90 | |
| Day Percent Change: 2.47% Day Change: 2.81 | |
| Week Change: 2.47% Year-to-date Change: 29.0% | |
| DIS Links: Profile News Message Board | |
| Charts:- Daily , Weekly | |
| Add DIS to Watchlist: View: Get Complete DIS Trend Analysis ➞ | |
 | ONEW OneWater Marine Inc. |
| Sector: Services & Goods | |
| SubSector: Recreational Vehicles | |
| MarketCap: 42027 Millions | |
| Recent Price: 23.24 Smart Investing & Trading Score: 42 | |
| Day Percent Change: 2.47% Day Change: 0.56 | |
| Week Change: 2.47% Year-to-date Change: -31.2% | |
| ONEW Links: Profile News Message Board | |
| Charts:- Daily , Weekly | |
| Add ONEW to Watchlist: View: Get Complete ONEW Trend Analysis ➞ | |
 | TJX The TJX Companies, Inc. |
| Sector: Services & Goods | |
| SubSector: Department Stores | |
| MarketCap: 50656.2 Millions | |
| Recent Price: 97.45 Smart Investing & Trading Score: 64 | |
| Day Percent Change: 2.46% Day Change: 2.34 | |
| Week Change: 2.46% Year-to-date Change: 3.9% | |
| TJX Links: Profile News Message Board | |
| Charts:- Daily , Weekly | |
| Add TJX to Watchlist: View: Get Complete TJX Trend Analysis ➞ | |
 | ONON On Holding AG |
| Sector: Services & Goods | |
| SubSector: Footwear & Accessories | |
| MarketCap: 10600 Millions | |
| Recent Price: 34.06 Smart Investing & Trading Score: 69 | |
| Day Percent Change: 2.39% Day Change: 0.80 | |
| Week Change: 2.39% Year-to-date Change: 24.9% | |
| ONON Links: Profile News Message Board | |
| Charts:- Daily , Weekly | |
| Add ONON to Watchlist: View: Get Complete ONON Trend Analysis ➞ | |
 | RBLX Roblox Corporation |
| Sector: Services & Goods | |
| SubSector: Electronic Gaming & Multimedia | |
| MarketCap: 25420 Millions | |
| Recent Price: 40.13 Smart Investing & Trading Score: 87 | |
| Day Percent Change: 2.26% Day Change: 0.88 | |
| Week Change: 2.26% Year-to-date Change: -13.1% | |
| RBLX Links: Profile News Message Board | |
| Charts:- Daily , Weekly | |
| Add RBLX to Watchlist: View: Get Complete RBLX Trend Analysis ➞ | |
 | ROL Rollins, Inc. |
| Sector: Services & Goods | |
| SubSector: Business Services | |
| MarketCap: 12827.4 Millions | |
| Recent Price: 47.10 Smart Investing & Trading Score: 100 | |
| Day Percent Change: 2.12% Day Change: 0.98 | |
| Week Change: 2.12% Year-to-date Change: 7.9% | |
| ROL Links: Profile News Message Board | |
| Charts:- Daily , Weekly | |
| Add ROL to Watchlist: View: Get Complete ROL Trend Analysis ➞ | |
 | VRSK Verisk Analytics, Inc. |
| Sector: Services & Goods | |
| SubSector: Business Services | |
| MarketCap: 22033.2 Millions | |
| Recent Price: 241.94 Smart Investing & Trading Score: 87 | |
| Day Percent Change: 1.94% Day Change: 4.61 | |
| Week Change: 1.94% Year-to-date Change: 1.3% | |
| VRSK Links: Profile News Message Board | |
| Charts:- Daily , Weekly | |
| Add VRSK to Watchlist: View: Get Complete VRSK Trend Analysis ➞ | |
 | MCO Moody s Corporation |
| Sector: Services & Goods | |
| SubSector: Business Services | |
| MarketCap: 35998.5 Millions | |
| Recent Price: 387.70 Smart Investing & Trading Score: 90 | |
| Day Percent Change: 1.88% Day Change: 7.14 | |
| Week Change: 1.88% Year-to-date Change: -0.7% | |
| MCO Links: Profile News Message Board | |
| Charts:- Daily , Weekly | |
| Add MCO to Watchlist: View: Get Complete MCO Trend Analysis ➞ | |
 | CTAS Cintas Corporation |
| Sector: Services & Goods | |
| SubSector: Business Services | |
| MarketCap: 20154.6 Millions | |
| Recent Price: 686.06 Smart Investing & Trading Score: 85 | |
| Day Percent Change: 1.78% Day Change: 12.02 | |
| Week Change: 1.78% Year-to-date Change: 13.8% | |
| CTAS Links: Profile News Message Board | |
| Charts:- Daily , Weekly | |
| Add CTAS to Watchlist: View: Get Complete CTAS Trend Analysis ➞ | |
 | COST Costco Wholesale Corporation |
| Sector: Services & Goods | |
| SubSector: Discount, Variety Stores | |
| MarketCap: 136355 Millions | |
| Recent Price: 756.71 Smart Investing & Trading Score: 95 | |
| Day Percent Change: 1.72% Day Change: 12.81 | |
| Week Change: 1.72% Year-to-date Change: 14.6% | |
| COST Links: Profile News Message Board | |
| Charts:- Daily , Weekly | |
| Add COST to Watchlist: View: Get Complete COST Trend Analysis ➞ | |
 | ALLE Allegion plc |
| Sector: Services & Goods | |
| SubSector: Security & Protection Services | |
| MarketCap: 8515.93 Millions | |
| Recent Price: 124.88 Smart Investing & Trading Score: 50 | |
| Day Percent Change: 1.63% Day Change: 2.00 | |
| Week Change: 1.63% Year-to-date Change: -1.4% | |
| ALLE Links: Profile News Message Board | |
| Charts:- Daily , Weekly | |
| Add ALLE to Watchlist: View: Get Complete ALLE Trend Analysis ➞ | |
 | SIRI Sirius XM Holdings Inc. |
| Sector: Services & Goods | |
| SubSector: Broadcasting - Radio | |
| MarketCap: 21325.5 Millions | |
| Recent Price: 3.17 Smart Investing & Trading Score: 57 | |
| Day Percent Change: 1.60% Day Change: 0.05 | |
| Week Change: 1.6% Year-to-date Change: -42.1% | |
| SIRI Links: Profile News Message Board | |
| Charts:- Daily , Weekly | |
| Add SIRI to Watchlist: View: Get Complete SIRI Trend Analysis ➞ | |
 | DPZ Domino s Pizza, Inc. |
| Sector: Services & Goods | |
| SubSector: Restaurants | |
| MarketCap: 12166 Millions | |
| Recent Price: 522.38 Smart Investing & Trading Score: 95 | |
| Day Percent Change: 1.57% Day Change: 8.05 | |
| Week Change: 1.57% Year-to-date Change: 26.7% | |
| DPZ Links: Profile News Message Board | |
| Charts:- Daily , Weekly | |
| Add DPZ to Watchlist: View: Get Complete DPZ Trend Analysis ➞ | |
 | FOX Twenty-First Century Fox, Inc. |
| Sector: Services & Goods | |
| SubSector: Entertainment - Diversified | |
| MarketCap: 24211.2 Millions | |
| Recent Price: 30.03 Smart Investing & Trading Score: 100 | |
| Day Percent Change: 1.52% Day Change: 0.45 | |
| Week Change: 1.52% Year-to-date Change: 8.6% | |
| FOX Links: Profile News Message Board | |
| Charts:- Daily , Weekly | |
| Add FOX to Watchlist: View: Get Complete FOX Trend Analysis ➞ | |
 | CPNG Coupang, Inc. |
| Sector: Services & Goods | |
| SubSector: Internet Retail | |
| MarketCap: 30840 Millions | |
| Recent Price: 23.35 Smart Investing & Trading Score: 95 | |
| Day Percent Change: 1.50% Day Change: 0.35 | |
| Week Change: 1.5% Year-to-date Change: 44.1% | |
| CPNG Links: Profile News Message Board | |
| Charts:- Daily , Weekly | |
| Add CPNG to Watchlist: View: Get Complete CPNG Trend Analysis ➞ | |
 | FOXA Fox Corporation |
| Sector: Services & Goods | |
| SubSector: Entertainment - Diversified | |
| MarketCap: 13440.7 Millions | |
| Recent Price: 32.56 Smart Investing & Trading Score: 100 | |
| Day Percent Change: 1.42% Day Change: 0.45 | |
| Week Change: 1.42% Year-to-date Change: 9.8% | |
| FOXA Links: Profile News Message Board | |
| Charts:- Daily , Weekly | |
| Add FOXA to Watchlist: View: Get Complete FOXA Trend Analysis ➞ | |
 | TRI Thomson Reuters Corporation |
| Sector: Services & Goods | |
| SubSector: Publishing - Periodicals | |
| MarketCap: 30959.4 Millions | |
| Recent Price: 167.07 Smart Investing & Trading Score: 100 | |
| Day Percent Change: 1.41% Day Change: 2.33 | |
| Week Change: 1.41% Year-to-date Change: 14.3% | |
| TRI Links: Profile News Message Board | |
| Charts:- Daily , Weekly | |
| Add TRI to Watchlist: View: Get Complete TRI Trend Analysis ➞ | |
 | QS QuantumScape Corporation |
| Sector: Services & Goods | |
| SubSector: Auto Parts | |
| MarketCap: 13137 Millions | |
| Recent Price: 5.78 Smart Investing & Trading Score: 69 | |
| Day Percent Change: 1.40% Day Change: 0.08 | |
| Week Change: 1.4% Year-to-date Change: -16.8% | |
| QS Links: Profile News Message Board | |
| Charts:- Daily , Weekly | |
| Add QS to Watchlist: View: Get Complete QS Trend Analysis ➞ | |
| For tabular summary view of above stock list: Summary View ➞ 0 - 25 , 25 - 50 , 50 - 75 , 75 - 100 , 100 - 125 | ||
| Click To Change The Sort Order: By Market Cap or Company Size Performance: Year-to-date, Week and Day | |
| Select Chart Type: | ||
|
Best Stocks Today 12Stocks.com |
© 2024 12Stocks.com Terms & Conditions Privacy Contact Us
All Information Provided Only For Education And Not To Be Used For Investing or Trading. See Terms & Conditions


One More Thing ... Get Best Stocks Delivered Daily!
Never Ever Miss A Move With Our Top Ten Stocks Lists
Find Best Stocks In Any Market - Bull or Bear Market
Take A Peek At Our Top Ten Stocks Lists: Daily, Weekly, Year-to-Date & Top Trends
Find Best Stocks In Any Market - Bull or Bear Market
Take A Peek At Our Top Ten Stocks Lists: Daily, Weekly, Year-to-Date & Top Trends
Consumer Services Stocks With Best Up Trends [0-bearish to 100-bullish]: Vroom [100], MYT Netherlands[100], Despegar.com [100], Wayfair [100], ATRenew [100], Smart Share[100], Life Time[100], Willdan [100], Adtalem Global[100], Brinker [100], E.W. Scripps[100]
Best Consumer Services Stocks Year-to-Date:
U Power[3209.15%], Vroom [2479.15%], Yatsen Holding[497.32%], Fluent [434.33%], Research[182.21%], Codere Online[136.3%], Carvana Co[132.28%], RealReal [109.45%], Sweetgreen [101.24%], Smart Share[80.58%], CAVA [70.75%] Best Consumer Services Stocks This Week:
Gogoro [24.35%], Vroom [19.33%], Research[16.67%], MYT Netherlands[12%], Noodles & [11.39%], Lucid [10.79%], Despegar.com [8.86%], ThredUp [8.45%], Jumia Technologies[8.1%], RealReal [7.95%], Wayfair [7.63%] Best Consumer Services Stocks Daily:
Gogoro [24.35%], Vroom [19.33%], Research[16.67%], MYT Netherlands[12.00%], Noodles & [11.39%], Lucid [10.79%], Despegar.com [8.86%], ThredUp [8.45%], Jumia Technologies[8.10%], RealReal [7.95%], Wayfair [7.63%]