
 Login Sign Up


| |||||
 |  | ||||

| 12Stocks.com Market Intelligence |
Best Asia Stocks
|
|
| Quick Read: Top Asia Stocks By Performances & Trends: Daily, Weekly, Year-to-Date, Market Cap (Size) & Technical Trends | |||
| Best Asia Views: Quick Browse View, Summary & Slide Show | |||
| 12Stocks.com Asia Stocks Performances & Trends Daily | |||||||||
|
|  The overall market intelligence score is 90 (0-bearish to 100-bullish) which puts Asia index in short term bullish trend. The market intelligence score from previous trading session is 70 and hence an improvement of trend.
| ||||||||
Here are the market intelligence trend scores of the most requested Asia stocks at 12Stocks.com (click stock name for detailed review):
|


| Consider signing up for our daily 12Stocks.com "Best Stocks Newsletter". You will never ever miss a big stock move again! |
| 12Stocks.com: Top Performing Asia Index Stocks | ||||||||||||||||||||||||||||||||||||||||||||||||
 The top performing Asia Index stocks year to date are
Now, more recently, over last week, the top performing Asia Index stocks on the move are


|
||||||||||||||||||||||||||||||||||||||||||||||||
| 12Stocks.com: Investing in Asia Index with Stocks | |
|
The following table helps investors and traders sort through current performance and trends (as measured by market intelligence score) of various
stocks in the Asia Index. Quick View: Move mouse or cursor over stock symbol (ticker) to view short-term technical chart and over stock name to view long term chart. Click on  to add stock symbol to your watchlist and to add stock symbol to your watchlist and  to view watchlist. Click on any ticker or stock name for detailed market intelligence report for that stock. to view watchlist. Click on any ticker or stock name for detailed market intelligence report for that stock. |
12Stocks.com Performance of Stocks in Asia Index
| Ticker | Stock Name | Watchlist | Category | Recent Price | Market Intelligence Score | Change % | YTD Change% |
| HSAI | Hesai |   | Services & Goods | 5.15 | 100 | 5.10% | -43.28% |
| UMC | United Microelectronics | | Technology | 8.08 | 100 | 3.06% | -4.49% |
| NOAH | Noah | | Financials | 13.40 | 100 | 2.41% | -2.93% |
| HTHT | Huazhu | | Services & Goods | 40.64 | 100 | 2.26% | 21.53% |
| SDA | SunCar | | Services & Goods | 8.46 | 100 | 11.47% | 8.82% |
| RERE | ATRenew | | Services & Goods | 2.15 | 100 | 1.89% | 14.02% |
| WB | | Technology | 9.45 | 100 | 1.67% | -13.74% | |
| TME | Tencent Music | | Technology | 13.26 | 100 | 1.61% | 47.17% |
| BILI | Bilibili | | Technology | 14.96 | 100 | 1.60% | 22.88% |
| BQ | Boqii Holding | | Services & Goods | 0.33 | 100 | 1.57% | -27.13% |
| BIDU | Baidu | | Technology | 111.94 | 100 | 0.17% | -6.01% |
| BABA | Alibaba | | Services & Goods | 80.45 | 100 | 0.15% | 3.79% |
| RETO | ReTo Eco- | | Industrials | 1.27 | 100 | 0.00% | 247.51% |
| GDS | GDS | | Technology | 8.59 | 100 | -2.94% | -5.81% |
| HCM | Hutchison China | | Health Care | 19.12 | 100 | -2.25% | 5.58% |
| QFIN | 360 Finance | | Financials | 19.52 | 100 | -1.84% | 23.36% |
| NIU | Niu | | Consumer Staples | 2.34 | 100 | -1.68% | 6.85% |
| MNSO | MINISO | | Services & Goods | 23.86 | 100 | -1.40% | 16.96% |
| BEKE | KE | | Financials | 16.76 | 100 | -0.48% | 3.39% |
| VNET | 21Vianet | | Technology | 1.91 | 100 | -0.26% | -33.62% |
| JD | JD.com | | Technology | 32.58 | 100 | -0.18% | 12.77% |
| MMYT | MakeMyTrip | | Services & Goods | 72.26 | 95 | 2.54% | 53.81% |
| SIMO | Silicon Motion | | Technology | 75.19 | 95 | 2.45% | 22.73% |
| TCOM | Trip.com | | Services & Goods | 52.09 | 95 | 2.26% | 44.65% |
| SOHU | Sohu.com | | Technology | 11.86 | 95 | 0.76% | 19.44% |
| To view more stocks, click on Next / Previous arrows or select different range: 0 - 25 , 25 - 50 , 50 - 75 , 75 - 100 , 100 - 125 , 125 - 150 , 150 - 175 , 175 - 200 , 200 - 225 | ||
 | Click To Change The Sort Order: By Market Cap or Company Size Performance: Year-to-date, Week and Day |  |
|
Get the most comprehensive stock market coverage daily at 12Stocks.com ➞ Best Stocks Today ➞ Best Stocks Weekly ➞ Best Stocks Year-to-Date ➞ Best Stocks Trends ➞  Best Stocks Today 12Stocks.com Best Nasdaq Stocks ➞ Best S&P 500 Stocks ➞ Best Tech Stocks ➞ Best Biotech Stocks ➞ |
| Detailed Overview of Asia Stocks |
| Asia Technical Overview, Leaders & Laggards, Top Asia ETF Funds & Detailed Asia Stocks List, Charts, Trends & More |
| Asia: Technical Analysis, Trends & YTD Performance | |
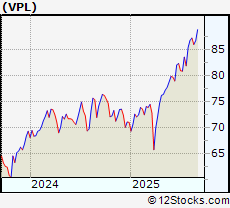
 VPL Weekly Chart |
|
| Long Term Trend: Very Good | |
| Medium Term Trend: Very Good | |
 VPL Daily Chart |
|
| Short Term Trend: Very Good | |
| Overall Trend Score: 90 | |
| YTD Performance: 3.12% | |
| **Trend Scores & Views Are Only For Educational Purposes And Not For Investing | |
| 12Stocks.com: Investing in Asia Index using Exchange Traded Funds | |
|
The following table shows list of key exchange traded funds (ETF) that
help investors play Asia stock market. For detailed view, check out our ETF Funds section of our website. Quick View: Move mouse or cursor over ETF symbol (ticker) to view short-term technical chart and over ETF name to view long term chart. Click on ticker or stock name for detailed view. Click on to add stock symbol to your watchlist and to view watchlist. |
12Stocks.com List of ETFs that track Asia Index
| Ticker | ETF Name | Watchlist | Recent Price | Market Intelligence Score | Change % | Week % | Year-to-date % |
| VPL | Pacific | | 74.28 | 90 | 0.54 | 2.44 | 3.12% |
| ASEA | Southeast Asia | | 15.07 | 100 | 0.77 | 2.48 | -0.04% |
| FXI | China Large-Cap | | 27.11 | 100 | -0.15 | 4.79 | 12.82% |
| EWY | South Korea | | 64.82 | 95 | 0.56 | 2.34 | -1.08% |
| EWT | Taiwan | | 48.40 | 93 | 1.04 | 2.76 | 5.15% |
| EWJ | Japan | | 68.81 | 57 | 0.50 | 2.51 | 7.29% |
| EWH | Hong Kong | | 16.82 | 100 | 0.21 | 5.29 | -3.14% |
| EWS | Singapore | | 19.22 | 100 | 0.26 | 1.42 | 2.78% |
| EWM | Malaysia | | 22.74 | 100 | 1.11 | 2.06 | 7.01% |
| 12Stocks.com: Charts, Trends, Fundamental Data and Performances of Asia Stocks | |
|
We now take in-depth look at all Asia stocks including charts, multi-period performances and overall trends (as measured by market intelligence score). One can sort Asia stocks (click link to choose) by Daily, Weekly and by Year-to-Date performances. Also, one can sort by size of the company or by market capitalization. |
| Select Your Default Chart Type: | |||||
| |||||
| Click on stock symbol or name for detailed view. Click on to add stock symbol to your watchlist and to view watchlist. Quick View: Move mouse or cursor over "Daily" to quickly view daily technical stock chart and over "Weekly" to view weekly technical stock chart. | |||||

 | HSAI Hesai Group |
| Sector: Services & Goods | |
| SubSector: Auto Parts | |
| MarketCap: 1330 Millions | |
| Recent Price: 5.15 Market Intelligence Score: 100 | |
| Day Percent Change: 5.10% Day Change: 0.25 | |
| Week Change: 17.05% Year-to-date Change: -43.3% | |
| HSAI Links: Profile News Message Board | |
| Charts:- Daily , Weekly | |
| Add HSAI to Watchlist: View: Get Complete HSAI Trend Analysis ➞ | |
 | UMC United Microelectronics Corporation |
| Sector: Technology | |
| SubSector: Semiconductor Equipment & Materials | |
| MarketCap: 5672.78 Millions | |
| Recent Price: 8.08 Market Intelligence Score: 100 | |
| Day Percent Change: 3.06% Day Change: 0.24 | |
| Week Change: 3.72% Year-to-date Change: -4.5% | |
| UMC Links: Profile News Message Board | |
| Charts:- Daily , Weekly | |
| Add UMC to Watchlist: View: Get Complete UMC Trend Analysis ➞ | |
 | NOAH Noah Holdings Limited |
| Sector: Financials | |
| SubSector: Asset Management | |
| MarketCap: 1495.33 Millions | |
| Recent Price: 13.40 Market Intelligence Score: 100 | |
| Day Percent Change: 2.41% Day Change: 0.31 | |
| Week Change: 5.39% Year-to-date Change: -2.9% | |
| NOAH Links: Profile News Message Board | |
| Charts:- Daily , Weekly | |
| Add NOAH to Watchlist: View: Get Complete NOAH Trend Analysis ➞ | |
 | HTHT Huazhu Group Limited |
| Sector: Services & Goods | |
| SubSector: Lodging | |
| MarketCap: 9164.46 Millions | |
| Recent Price: 40.64 Market Intelligence Score: 100 | |
| Day Percent Change: 2.26% Day Change: 0.90 | |
| Week Change: 1.45% Year-to-date Change: 21.5% | |
| HTHT Links: Profile News Message Board | |
| Charts:- Daily , Weekly | |
| Add HTHT to Watchlist: View: Get Complete HTHT Trend Analysis ➞ | |
 | SDA SunCar Technology Group Inc. |
| Sector: Services & Goods | |
| SubSector: Auto & Truck Dealerships | |
| MarketCap: 2680 Millions | |
| Recent Price: 8.46 Market Intelligence Score: 100 | |
| Day Percent Change: 11.47% Day Change: 0.87 | |
| Week Change: 16.46% Year-to-date Change: 8.8% | |
| SDA Links: Profile News Message Board | |
| Charts:- Daily , Weekly | |
| Add SDA to Watchlist: View: Get Complete SDA Trend Analysis ➞ | |
 | RERE ATRenew Inc. |
| Sector: Services & Goods | |
| SubSector: Internet Retail | |
| MarketCap: 672 Millions | |
| Recent Price: 2.15 Market Intelligence Score: 100 | |
| Day Percent Change: 1.89% Day Change: 0.04 | |
| Week Change: 8.84% Year-to-date Change: 14.0% | |
| RERE Links: Profile News Message Board | |
| Charts:- Daily , Weekly | |
| Add RERE to Watchlist: View: Get Complete RERE Trend Analysis ➞ | |
 | WB Weibo Corporation |
| Sector: Technology | |
| SubSector: Internet Information Providers | |
| MarketCap: 8164.6 Millions | |
| Recent Price: 9.45 Market Intelligence Score: 100 | |
| Day Percent Change: 1.67% Day Change: 0.16 | |
| Week Change: 7.33% Year-to-date Change: -13.7% | |
| WB Links: Profile News Message Board | |
| Charts:- Daily , Weekly | |
| Add WB to Watchlist: View: Get Complete WB Trend Analysis ➞ | |
 | TME Tencent Music Entertainment Group |
| Sector: Technology | |
| SubSector: Internet Information Providers | |
| MarketCap: 16195 Millions | |
| Recent Price: 13.26 Market Intelligence Score: 100 | |
| Day Percent Change: 1.61% Day Change: 0.21 | |
| Week Change: 2.95% Year-to-date Change: 47.2% | |
| TME Links: Profile News Message Board | |
| Charts:- Daily , Weekly | |
| Add TME to Watchlist: View: Get Complete TME Trend Analysis ➞ | |
 | BILI Bilibili Inc. |
| Sector: Technology | |
| SubSector: Internet Information Providers | |
| MarketCap: 7043.1 Millions | |
| Recent Price: 14.96 Market Intelligence Score: 100 | |
| Day Percent Change: 1.60% Day Change: 0.23 | |
| Week Change: 13.99% Year-to-date Change: 22.9% | |
| BILI Links: Profile News Message Board | |
| Charts:- Daily , Weekly | |
| Add BILI to Watchlist: View: Get Complete BILI Trend Analysis ➞ | |
 | BQ Boqii Holding Limited |
| Sector: Services & Goods | |
| SubSector: Specialty Retail | |
| MarketCap: 33027 Millions | |
| Recent Price: 0.33 Market Intelligence Score: 100 | |
| Day Percent Change: 1.57% Day Change: 0.01 | |
| Week Change: 8.94% Year-to-date Change: -27.1% | |
| BQ Links: Profile News Message Board | |
| Charts:- Daily , Weekly | |
| Add BQ to Watchlist: View: Get Complete BQ Trend Analysis ➞ | |
 | BIDU Baidu, Inc. |
| Sector: Technology | |
| SubSector: Internet Information Providers | |
| MarketCap: 33525.9 Millions | |
| Recent Price: 111.94 Market Intelligence Score: 100 | |
| Day Percent Change: 0.17% Day Change: 0.19 | |
| Week Change: 11.36% Year-to-date Change: -6.0% | |
| BIDU Links: Profile News Message Board | |
| Charts:- Daily , Weekly | |
| Add BIDU to Watchlist: View: Get Complete BIDU Trend Analysis ➞ | |
 | BABA Alibaba Group Holding Limited |
| Sector: Services & Goods | |
| SubSector: Specialty Retail, Other | |
| MarketCap: 522666 Millions | |
| Recent Price: 80.45 Market Intelligence Score: 100 | |
| Day Percent Change: 0.15% Day Change: 0.12 | |
| Week Change: 6.49% Year-to-date Change: 3.8% | |
| BABA Links: Profile News Message Board | |
| Charts:- Daily , Weekly | |
| Add BABA to Watchlist: View: Get Complete BABA Trend Analysis ➞ | |
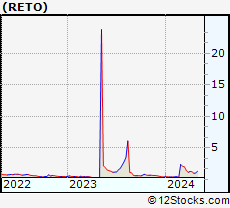 | RETO ReTo Eco-Solutions, Inc. |
| Sector: Industrials | |
| SubSector: General Building Materials | |
| MarketCap: 13.1953 Millions | |
| Recent Price: 1.27 Market Intelligence Score: 100 | |
| Day Percent Change: 0.00% Day Change: 0.00 | |
| Week Change: 28.92% Year-to-date Change: 247.5% | |
| RETO Links: Profile News Message Board | |
| Charts:- Daily , Weekly | |
| Add RETO to Watchlist: View: Get Complete RETO Trend Analysis ➞ | |
 | GDS GDS Holdings Limited |
| Sector: Technology | |
| SubSector: Data Storage Devices | |
| MarketCap: 8597.99 Millions | |
| Recent Price: 8.59 Market Intelligence Score: 100 | |
| Day Percent Change: -2.94% Day Change: -0.26 | |
| Week Change: 10.7% Year-to-date Change: -5.8% | |
| GDS Links: Profile News Message Board | |
| Charts:- Daily , Weekly | |
| Add GDS to Watchlist: View: Get Complete GDS Trend Analysis ➞ | |
 | HCM Hutchison China MediTech Limited |
| Sector: Health Care | |
| SubSector: Drug Manufacturers - Major | |
| MarketCap: 2324.43 Millions | |
| Recent Price: 19.12 Market Intelligence Score: 100 | |
| Day Percent Change: -2.25% Day Change: -0.44 | |
| Week Change: 5.29% Year-to-date Change: 5.6% | |
| HCM Links: Profile News Message Board | |
| Charts:- Daily , Weekly | |
| Add HCM to Watchlist: View: Get Complete HCM Trend Analysis ➞ | |
 | QFIN 360 Finance, Inc. |
| Sector: Financials | |
| SubSector: Credit Services | |
| MarketCap: 956.208 Millions | |
| Recent Price: 19.52 Market Intelligence Score: 100 | |
| Day Percent Change: -1.84% Day Change: -0.36 | |
| Week Change: 5.37% Year-to-date Change: 23.4% | |
| QFIN Links: Profile News Message Board | |
| Charts:- Daily , Weekly | |
| Add QFIN to Watchlist: View: Get Complete QFIN Trend Analysis ➞ | |
 | NIU Niu Technologies |
| Sector: Consumer Staples | |
| SubSector: Auto Manufacturers - Major | |
| MarketCap: 543.271 Millions | |
| Recent Price: 2.34 Market Intelligence Score: 100 | |
| Day Percent Change: -1.68% Day Change: -0.04 | |
| Week Change: 3.54% Year-to-date Change: 6.9% | |
| NIU Links: Profile News Message Board | |
| Charts:- Daily , Weekly | |
| Add NIU to Watchlist: View: Get Complete NIU Trend Analysis ➞ | |
 | MNSO MINISO Group Holding Limited |
| Sector: Services & Goods | |
| SubSector: Specialty Retail | |
| MarketCap: 69427 Millions | |
| Recent Price: 23.86 Market Intelligence Score: 100 | |
| Day Percent Change: -1.40% Day Change: -0.34 | |
| Week Change: 0.97% Year-to-date Change: 17.0% | |
| MNSO Links: Profile News Message Board | |
| Charts:- Daily , Weekly | |
| Add MNSO to Watchlist: View: Get Complete MNSO Trend Analysis ➞ | |
 | BEKE KE Holdings Inc. |
| Sector: Financials | |
| SubSector: Real Estate Services | |
| MarketCap: 80167 Millions | |
| Recent Price: 16.76 Market Intelligence Score: 100 | |
| Day Percent Change: -0.48% Day Change: -0.08 | |
| Week Change: 13.01% Year-to-date Change: 3.4% | |
| BEKE Links: Profile News Message Board | |
| Charts:- Daily , Weekly | |
| Add BEKE to Watchlist: View: Get Complete BEKE Trend Analysis ➞ | |
 | VNET 21Vianet Group, Inc. |
| Sector: Technology | |
| SubSector: Information Technology Services | |
| MarketCap: 1846.98 Millions | |
| Recent Price: 1.91 Market Intelligence Score: 100 | |
| Day Percent Change: -0.26% Day Change: 0.00 | |
| Week Change: 20.57% Year-to-date Change: -33.6% | |
| VNET Links: Profile News Message Board | |
| Charts:- Daily , Weekly | |
| Add VNET to Watchlist: View: Get Complete VNET Trend Analysis ➞ | |
 | JD JD.com, Inc. |
| Sector: Technology | |
| SubSector: Internet Information Providers | |
| MarketCap: 59907.3 Millions | |
| Recent Price: 32.58 Market Intelligence Score: 100 | |
| Day Percent Change: -0.18% Day Change: -0.06 | |
| Week Change: 7.38% Year-to-date Change: 12.8% | |
| JD Links: Profile News Message Board | |
| Charts:- Daily , Weekly | |
| Add JD to Watchlist: View: Get Complete JD Trend Analysis ➞ | |
 | MMYT MakeMyTrip Limited |
| Sector: Services & Goods | |
| SubSector: General Entertainment | |
| MarketCap: 1429.59 Millions | |
| Recent Price: 72.26 Market Intelligence Score: 95 | |
| Day Percent Change: 2.54% Day Change: 1.79 | |
| Week Change: 7.1% Year-to-date Change: 53.8% | |
| MMYT Links: Profile News Message Board | |
| Charts:- Daily , Weekly | |
| Add MMYT to Watchlist: View: Get Complete MMYT Trend Analysis ➞ | |
 | SIMO Silicon Motion Technology Corporation |
| Sector: Technology | |
| SubSector: Diversified Electronics | |
| MarketCap: 1186.66 Millions | |
| Recent Price: 75.19 Market Intelligence Score: 95 | |
| Day Percent Change: 2.45% Day Change: 1.79 | |
| Week Change: 2.52% Year-to-date Change: 22.7% | |
| SIMO Links: Profile News Message Board | |
| Charts:- Daily , Weekly | |
| Add SIMO to Watchlist: View: Get Complete SIMO Trend Analysis ➞ | |
 | TCOM Trip.com Group Limited |
| Sector: Services & Goods | |
| SubSector: Lodging | |
| MarketCap: 13449.6 Millions | |
| Recent Price: 52.09 Market Intelligence Score: 95 | |
| Day Percent Change: 2.26% Day Change: 1.15 | |
| Week Change: 2.94% Year-to-date Change: 44.7% | |
| TCOM Links: Profile News Message Board | |
| Charts:- Daily , Weekly | |
| Add TCOM to Watchlist: View: Get Complete TCOM Trend Analysis ➞ | |
 | SOHU Sohu.com Limited |
| Sector: Technology | |
| SubSector: Internet Information Providers | |
| MarketCap: 243.48 Millions | |
| Recent Price: 11.86 Market Intelligence Score: 95 | |
| Day Percent Change: 0.76% Day Change: 0.09 | |
| Week Change: 3.76% Year-to-date Change: 19.4% | |
| SOHU Links: Profile News Message Board | |
| Charts:- Daily , Weekly | |
| Add SOHU to Watchlist: View: Get Complete SOHU Trend Analysis ➞ | |
| To view more stocks, click on Next / Previous arrows or select different range: 0 - 25 , 25 - 50 , 50 - 75 , 75 - 100 , 100 - 125 , 125 - 150 , 150 - 175 , 175 - 200 , 200 - 225 | ||
| Click To Change The Sort Order: By Market Cap or Company Size Performance: Year-to-date, Week and Day | |
| Select Chart Type: | ||
|
Best Stocks Today 12Stocks.com |
© 2024 12Stocks.com Terms & Conditions Privacy Contact Us
All Information Provided Only For Education And Not To Be Used For Investing or Trading. See Terms & Conditions


One More Thing ... Get Best Stocks Delivered Daily!
Never Ever Miss A Move With Our Top Ten Stocks Lists
Find Best Stocks In Any Market - Bull or Bear Market
Take A Peek At Our Top Ten Stocks Lists: Daily, Weekly, Year-to-Date & Top Trends
Find Best Stocks In Any Market - Bull or Bear Market
Take A Peek At Our Top Ten Stocks Lists: Daily, Weekly, Year-to-Date & Top Trends
Asia Stocks With Best Up Trends [0-bearish to 100-bullish]: SunCar [100], Hesai [100], United Microelectronics[100], Noah [100], Huazhu [100], ATRenew [100], Weibo [100], Tencent Music[100], Bilibili [100], Boqii Holding[100], Baidu [100]
Best Asia Stocks Year-to-Date:
U Power[3264.96%], DouYu [856.84%], MicroCloud Hologram[584.89%], China Liberal[515.21%], Yatsen Holding[478.18%], Zhongchao [351.93%], Uxin [176.75%], GigaCloud [97.11%], QuantaSing [95.06%], Cheetah Mobile[75.66%], Smart Share[68.93%] Best Asia Stocks This Week:
SYLA [48.97%], Smart Share[40.05%], Dingdong (Cayman)[24.6%], Regencell Bioscience[21.31%], 21Vianet [20.57%], NIO [20.16%], U Power[17.77%], Hesai [17.05%], SunCar [16.46%], AMTD Digital[16.36%], Golden Heaven[15.1%] Best Asia Stocks Daily:
SunCar [11.47%], U Power[9.44%], AMTD Digital[8.33%], Dingdong (Cayman)[5.72%], Hesai [5.10%], New Oriental[5.04%], Intchains [4.99%], WiMi Hologram[4.77%], China Liberal[4.76%], GigaCloud [4.04%], Atour Lifestyle[3.67%]