
 Login Sign Up


| |||||
 |  | ||||

| 12Stocks.com Market Intelligence |
Best SmallCap Stocks
|
| In a hurry? Small Cap Stock Lists: Performance Trends Table, Stock Charts
Sort Small Cap stocks: Daily, Weekly, Year-to-Date, Market Cap & Trends. Filter Small Cap stocks list by sector: Show all, Tech, Finance, Energy, Staples, Retail, Industrial, Materials, Utilities and HealthCare Filter Small Cap stocks list by size: All Large Medium Small and MicroCap |
| 12Stocks.com Small Cap Stocks Performances & Trends Daily | |||||||||
|
|  The overall Smart Investing & Trading Score is 76 (0-bearish to 100-bullish) which puts Small Cap index in short term neutral to bullish trend. The Smart Investing & Trading Score from previous trading session is 90 and hence a deterioration of trend.
| ||||||||
Here are the Smart Investing & Trading Scores of the most requested small cap stocks at 12Stocks.com (click stock name for detailed review):
|


| 12Stocks.com: Investing in Smallcap Index with Stocks | |
|
The following table helps investors and traders sort through current performance and trends (as measured by Smart Investing & Trading Score) of various
stocks in the Smallcap Index. Quick View: Move mouse or cursor over stock symbol (ticker) to view short-term technical chart and over stock name to view long term chart. Click on  to add stock symbol to your watchlist and to add stock symbol to your watchlist and  to view watchlist. Click on any ticker or stock name for detailed market intelligence report for that stock. to view watchlist. Click on any ticker or stock name for detailed market intelligence report for that stock. |
12Stocks.com Performance of Stocks in Smallcap Index
| Ticker | Stock Name | Watchlist | Category | Recent Price | Smart Investing & Trading Score | Change % | Weekly Change% |
| NHI | National Health |   | Financials | 66.51 | 83 | -0.20% | 1.85% |
| POWI | Power Integrations | | Technology | 76.79 | 76 | -1.12% | 1.83% |
| THR | Thermon Group | | Industrials | 34.99 | 95 | 1.27% | 1.83% |
| AMTB | Amerant Bancorp | | Financials | 23.34 | 88 | 0.60% | 1.83% |
| PDCO | Patterson | | Services & Goods | 25.76 | 38 | -0.35% | 1.82% |
| ICHR | Ichor | | Technology | 38.72 | 40 | 1.65% | 1.81% |
| EXLS | ExlService | | Technology | 31.18 | 82 | 1.17% | 1.80% |
| GTY | Getty Realty | | Financials | 28.45 | 90 | -0.07% | 1.79% |
| MGRC | McGrath RentCorp | | Transports | 111.60 | 57 | 2.87% | 1.78% |
| CSGS | CSG Systems | | Technology | 42.78 | 27 | -1.02% | 1.78% |
| GTLS | Chart Industries | | Industrials | 154.00 | 58 | 0.00% | 1.78% |
| DX | Dynex Capital | | Financials | 12.61 | 90 | 0.32% | 1.78% |
| FMAO | Farmers & Merchants Bancorp | | Financials | 22.86 | 83 | 0.40% | 1.78% |
| UBSI | United Bankshares | | Financials | 35.02 | 100 | 1.01% | 1.77% |
| BCC | Boise Cascade | | Industrials | 136.05 | 28 | -0.90% | 1.77% |
| APAM | Artisan Partners | | Financials | 44.84 | 63 | -0.82% | 1.77% |
| HFWA | Heritage Financial | | Financials | 19.08 | 100 | 1.01% | 1.76% |
| DEA | Easterly Government | | Financials | 12.17 | 75 | 0.00% | 1.76% |
| TBBK | Bancorp | | Financials | 33.69 | 39 | 0.87% | 1.75% |
| BLMN | Bloomin | | Services & Goods | 23.45 | 10 | -2.78% | 1.74% |
| AHH | Armada Hoffler | | Financials | 11.68 | 83 | 0.69% | 1.74% |
| SLDP | Solid Power | | Industrials | 1.75 | 58 | -1.69% | 1.74% |
| BRZE | Braze | | Technology | 41.94 | 32 | -0.19% | 1.72% |
| MAC | Macerich | | Financials | 15.54 | 17 | -3.30% | 1.70% |
| SWX | Southwest Gas | | Utilities | 77.68 | 95 | 0.40% | 1.70% |


| Too many stocks? View smallcap stocks filtered by marketcap & sector |
| Marketcap: All SmallCap Stocks (default-no microcap), Large, Mid-Range, Small |
| Smallcap Sector: Tech, Finance, Energy, Staples, Retail, Industrial, Materials, & Medical |
|
Get the most comprehensive stock market coverage daily at 12Stocks.com ➞ Best Stocks Today ➞ Best Stocks Weekly ➞ Best Stocks Year-to-Date ➞ Best Stocks Trends ➞  Best Stocks Today 12Stocks.com Best Nasdaq Stocks ➞ Best S&P 500 Stocks ➞ Best Tech Stocks ➞ Best Biotech Stocks ➞ |
| Detailed Overview of SmallCap Stocks |
| SmallCap Technical Overview, Leaders & Laggards, Top SmallCap ETF Funds & Detailed SmallCap Stocks List, Charts, Trends & More |
| Smallcap: Technical Analysis, Trends & YTD Performance | |
| SmallCap segment as represented by
IWM, an exchange-traded fund [ETF], holds basket of thousands of smallcap stocks from across all major sectors of the US stock market. The smallcap index (contains stocks like Riverbed & Sotheby's) is up by 3.67% and is currently underperforming the overall market by -6.9% year-to-date. Below is a quick view of technical charts and trends: | |
 IWM Weekly Chart |
|
| Long Term Trend: Very Good | |
| Medium Term Trend: Very Good | |
 IWM Daily Chart |
|
| Short Term Trend: Good | |
| Overall Trend Score: 76 | |
| YTD Performance: 3.67% | |
| **Trend Scores & Views Are Only For Educational Purposes And Not For Investing | |
| 12Stocks.com: Top Performing Small Cap Index Stocks | ||||||||||||||||||||||||||||||||||||||||||||||||
 The top performing Small Cap Index stocks year to date are
Now, more recently, over last week, the top performing Small Cap Index stocks on the move are


|
||||||||||||||||||||||||||||||||||||||||||||||||
| 12Stocks.com: Investing in Smallcap Index using Exchange Traded Funds | |
|
The following table shows list of key exchange traded funds (ETF) that
help investors track Smallcap index. The following list also includes leveraged ETF funds that track twice or thrice the daily returns of Smallcap indices. Short or inverse ETF funds move in the opposite direction to the index they track and are useful during market pullbacks or during bear markets. Quick View: Move mouse or cursor over ETF symbol (ticker) to view short-term technical chart and over ETF name to view long term chart. Click on ticker or stock name for detailed view. Click on to add stock symbol to your watchlist and to view watchlist. |
12Stocks.com List of ETFs that track Smallcap Index
| Ticker | ETF Name | Watchlist | Recent Price | Smart Investing & Trading Score | Change % | Week % | Year-to-date % |
| IWM | iShares Russell 2000 | | 208.08 | 76 | 0.07 | 1.85 | 3.67% |
| VTWO | Vanguard Russell 2000 ETF | | 84.11 | 71 | 0.00 | 1.8 | 3.71% |
| IJR | iShares Core S&P Small-Cap | | 110.39 | 68 | -0.22 | 1.29 | 1.98% |
| IWN | iShares Russell 2000 Value | | 158.71 | 76 | -0.07 | 1.61 | 2.18% |
| IWO | iShares Russell 2000 Growth | | 265.15 | 63 | -0.75 | 2.01 | 5.13% |
| IJS | iShares S&P Small-Cap 600 Value | | 101.87 | 76 | -0.15 | 1.34 | -1.16% |
| IJT | iShares S&P Small-Cap 600 Growth | | 131.34 | 71 | 0.04 | 1.14 | 4.95% |
| XSLV | PowerShares S&P SmallCap Low Volatil ETF | | 44.48 | 83 | -0.01 | 0.55 | 0.74% |
| SAA | ProShares Ultra SmallCap600 | | 24.90 | 71 | 0.50 | 2.28 | -0.18% |
| SMLV | SPDR SSGA US Small Cap Low Volatil ETF | | 113.28 | 95 | 0.43 | 1.85 | 0.68% |
| SDD | ProShares UltraShort SmallCap600 | | 17.84 | 35 | 0.96 | -2.41 | -3.19% |
| SBB | ProShares Short SmallCap600 | | 15.77 | 25 | 0.41 | -1.14 | -0.98% |
| 12Stocks.com: Charts, Trends, Fundamental Data and Performances of SmallCap Stocks | |
|
We now take in-depth look at all SmallCap stocks including charts, multi-period performances and overall trends (as measured by Smart Investing & Trading Score). One can sort SmallCap stocks (click link to choose) by Daily, Weekly and by Year-to-Date performances. Also, one can sort by size of the company or by market capitalization. |
| Select Your Default Chart Type: | |||||
| |||||
| Click on stock symbol or name for detailed view. Click on to add stock symbol to your watchlist and to view watchlist. Quick View: Move mouse or cursor over "Daily" to quickly view daily technical stock chart and over "Weekly" to view weekly technical stock chart. | |||||

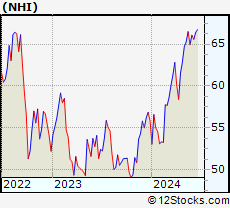 | NHI National Health Investors, Inc. |
| Sector: Financials | |
| SubSector: REIT - Healthcare Facilities | |
| MarketCap: 2156.54 Millions | |
| Recent Price: 66.51 Smart Investing & Trading Score: 83 | |
| Day Percent Change: -0.20% Day Change: -0.13 | |
| Week Change: 1.85% Year-to-date Change: 19.1% | |
| NHI Links: Profile News Message Board | |
| Charts:- Daily , Weekly | |
| Add NHI to Watchlist: View: Get Complete NHI Trend Analysis ➞ | |
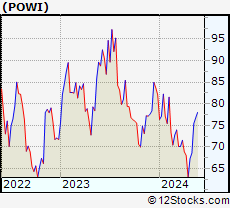 | POWI Power Integrations, Inc. |
| Sector: Technology | |
| SubSector: Semiconductor - Integrated Circuits | |
| MarketCap: 2612.1 Millions | |
| Recent Price: 76.79 Smart Investing & Trading Score: 76 | |
| Day Percent Change: -1.12% Day Change: -0.87 | |
| Week Change: 1.83% Year-to-date Change: -6.5% | |
| POWI Links: Profile News Message Board | |
| Charts:- Daily , Weekly | |
| Add POWI to Watchlist: View: Get Complete POWI Trend Analysis ➞ | |
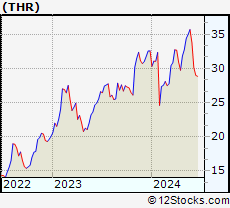 | THR Thermon Group Holdings, Inc. |
| Sector: Industrials | |
| SubSector: Diversified Machinery | |
| MarketCap: 492.816 Millions | |
| Recent Price: 34.99 Smart Investing & Trading Score: 95 | |
| Day Percent Change: 1.27% Day Change: 0.44 | |
| Week Change: 1.83% Year-to-date Change: 7.4% | |
| THR Links: Profile News Message Board | |
| Charts:- Daily , Weekly | |
| Add THR to Watchlist: View: Get Complete THR Trend Analysis ➞ | |
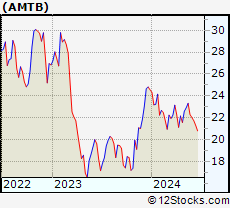 | AMTB Amerant Bancorp Inc. |
| Sector: Financials | |
| SubSector: Regional - Midwest Banks | |
| MarketCap: 653.87 Millions | |
| Recent Price: 23.34 Smart Investing & Trading Score: 88 | |
| Day Percent Change: 0.60% Day Change: 0.14 | |
| Week Change: 1.83% Year-to-date Change: -5.0% | |
| AMTB Links: Profile News Message Board | |
| Charts:- Daily , Weekly | |
| Add AMTB to Watchlist: View: Get Complete AMTB Trend Analysis ➞ | |
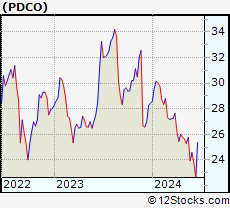 | PDCO Patterson Companies, Inc. |
| Sector: Services & Goods | |
| SubSector: Medical Equipment Wholesale | |
| MarketCap: 1672.2 Millions | |
| Recent Price: 25.76 Smart Investing & Trading Score: 38 | |
| Day Percent Change: -0.35% Day Change: -0.09 | |
| Week Change: 1.82% Year-to-date Change: -9.5% | |
| PDCO Links: Profile News Message Board | |
| Charts:- Daily , Weekly | |
| Add PDCO to Watchlist: View: Get Complete PDCO Trend Analysis ➞ | |
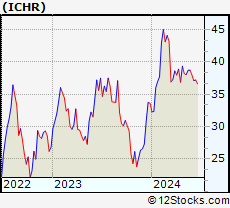 | ICHR Ichor Holdings, Ltd. |
| Sector: Technology | |
| SubSector: Semiconductor Equipment & Materials | |
| MarketCap: 409.018 Millions | |
| Recent Price: 38.72 Smart Investing & Trading Score: 40 | |
| Day Percent Change: 1.65% Day Change: 0.63 | |
| Week Change: 1.81% Year-to-date Change: 15.1% | |
| ICHR Links: Profile News Message Board | |
| Charts:- Daily , Weekly | |
| Add ICHR to Watchlist: View: Get Complete ICHR Trend Analysis ➞ | |
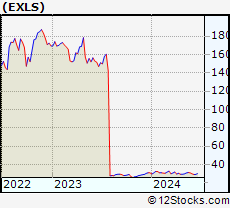 | EXLS ExlService Holdings, Inc. |
| Sector: Technology | |
| SubSector: Information Technology Services | |
| MarketCap: 1781.78 Millions | |
| Recent Price: 31.18 Smart Investing & Trading Score: 82 | |
| Day Percent Change: 1.17% Day Change: 0.36 | |
| Week Change: 1.8% Year-to-date Change: 1.1% | |
| EXLS Links: Profile News Message Board | |
| Charts:- Daily , Weekly | |
| Add EXLS to Watchlist: View: Get Complete EXLS Trend Analysis ➞ | |
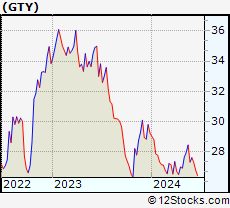 | GTY Getty Realty Corp. |
| Sector: Financials | |
| SubSector: REIT - Retail | |
| MarketCap: 926.114 Millions | |
| Recent Price: 28.45 Smart Investing & Trading Score: 90 | |
| Day Percent Change: -0.07% Day Change: -0.02 | |
| Week Change: 1.79% Year-to-date Change: -2.6% | |
| GTY Links: Profile News Message Board | |
| Charts:- Daily , Weekly | |
| Add GTY to Watchlist: View: Get Complete GTY Trend Analysis ➞ | |
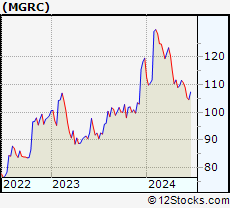 | MGRC McGrath RentCorp |
| Sector: Transports | |
| SubSector: Rental & Leasing Services | |
| MarketCap: 1289.04 Millions | |
| Recent Price: 111.60 Smart Investing & Trading Score: 57 | |
| Day Percent Change: 2.87% Day Change: 3.11 | |
| Week Change: 1.78% Year-to-date Change: -6.7% | |
| MGRC Links: Profile News Message Board | |
| Charts:- Daily , Weekly | |
| Add MGRC to Watchlist: View: Get Complete MGRC Trend Analysis ➞ | |
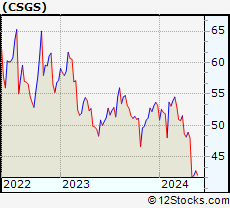 | CSGS CSG Systems International, Inc. |
| Sector: Technology | |
| SubSector: Business Software & Services | |
| MarketCap: 1336.78 Millions | |
| Recent Price: 42.78 Smart Investing & Trading Score: 27 | |
| Day Percent Change: -1.02% Day Change: -0.44 | |
| Week Change: 1.78% Year-to-date Change: -19.6% | |
| CSGS Links: Profile News Message Board | |
| Charts:- Daily , Weekly | |
| Add CSGS to Watchlist: View: Get Complete CSGS Trend Analysis ➞ | |
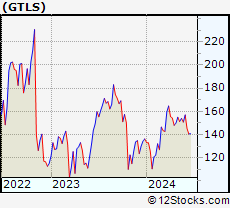 | GTLS Chart Industries, Inc. |
| Sector: Industrials | |
| SubSector: Metal Fabrication | |
| MarketCap: 751.15 Millions | |
| Recent Price: 154.00 Smart Investing & Trading Score: 58 | |
| Day Percent Change: 0.00% Day Change: 0.00 | |
| Week Change: 1.78% Year-to-date Change: 13.0% | |
| GTLS Links: Profile News Message Board | |
| Charts:- Daily , Weekly | |
| Add GTLS to Watchlist: View: Get Complete GTLS Trend Analysis ➞ | |
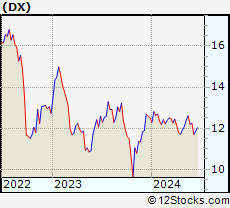 | DX Dynex Capital, Inc. |
| Sector: Financials | |
| SubSector: Mortgage Investment | |
| MarketCap: 327.839 Millions | |
| Recent Price: 12.61 Smart Investing & Trading Score: 90 | |
| Day Percent Change: 0.32% Day Change: 0.04 | |
| Week Change: 1.78% Year-to-date Change: 0.7% | |
| DX Links: Profile News Message Board | |
| Charts:- Daily , Weekly | |
| Add DX to Watchlist: View: Get Complete DX Trend Analysis ➞ | |
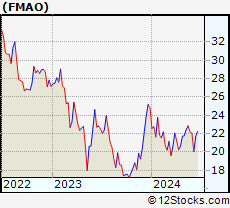 | FMAO Farmers & Merchants Bancorp, Inc. |
| Sector: Financials | |
| SubSector: Regional - Midwest Banks | |
| MarketCap: 280.27 Millions | |
| Recent Price: 22.86 Smart Investing & Trading Score: 83 | |
| Day Percent Change: 0.40% Day Change: 0.09 | |
| Week Change: 1.78% Year-to-date Change: -7.8% | |
| FMAO Links: Profile News Message Board | |
| Charts:- Daily , Weekly | |
| Add FMAO to Watchlist: View: Get Complete FMAO Trend Analysis ➞ | |
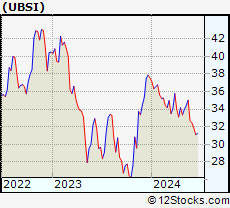 | UBSI United Bankshares, Inc. |
| Sector: Financials | |
| SubSector: Regional - Mid-Atlantic Banks | |
| MarketCap: 2286.79 Millions | |
| Recent Price: 35.02 Smart Investing & Trading Score: 100 | |
| Day Percent Change: 1.01% Day Change: 0.35 | |
| Week Change: 1.77% Year-to-date Change: -6.7% | |
| UBSI Links: Profile News Message Board | |
| Charts:- Daily , Weekly | |
| Add UBSI to Watchlist: View: Get Complete UBSI Trend Analysis ➞ | |
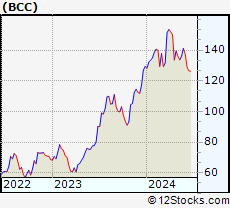 | BCC Boise Cascade Company |
| Sector: Industrials | |
| SubSector: Lumber, Wood Production | |
| MarketCap: 963.938 Millions | |
| Recent Price: 136.05 Smart Investing & Trading Score: 28 | |
| Day Percent Change: -0.90% Day Change: -1.24 | |
| Week Change: 1.77% Year-to-date Change: 5.2% | |
| BCC Links: Profile News Message Board | |
| Charts:- Daily , Weekly | |
| Add BCC to Watchlist: View: Get Complete BCC Trend Analysis ➞ | |
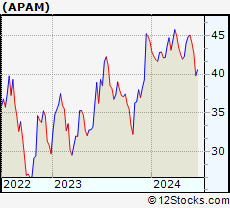 | APAM Artisan Partners Asset Management Inc. |
| Sector: Financials | |
| SubSector: Asset Management | |
| MarketCap: 1688.33 Millions | |
| Recent Price: 44.84 Smart Investing & Trading Score: 63 | |
| Day Percent Change: -0.82% Day Change: -0.37 | |
| Week Change: 1.77% Year-to-date Change: 1.5% | |
| APAM Links: Profile News Message Board | |
| Charts:- Daily , Weekly | |
| Add APAM to Watchlist: View: Get Complete APAM Trend Analysis ➞ | |
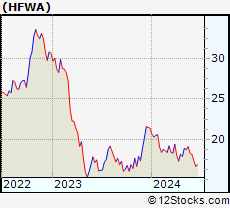 | HFWA Heritage Financial Corporation |
| Sector: Financials | |
| SubSector: Regional - Pacific Banks | |
| MarketCap: 752.829 Millions | |
| Recent Price: 19.08 Smart Investing & Trading Score: 100 | |
| Day Percent Change: 1.01% Day Change: 0.19 | |
| Week Change: 1.76% Year-to-date Change: -10.8% | |
| HFWA Links: Profile News Message Board | |
| Charts:- Daily , Weekly | |
| Add HFWA to Watchlist: View: Get Complete HFWA Trend Analysis ➞ | |
 | DEA Easterly Government Properties, Inc. |
| Sector: Financials | |
| SubSector: REIT - Office | |
| MarketCap: 1832.56 Millions | |
| Recent Price: 12.17 Smart Investing & Trading Score: 75 | |
| Day Percent Change: 0.00% Day Change: 0.00 | |
| Week Change: 1.76% Year-to-date Change: -9.5% | |
| DEA Links: Profile News Message Board | |
| Charts:- Daily , Weekly | |
| Add DEA to Watchlist: View: Get Complete DEA Trend Analysis ➞ | |
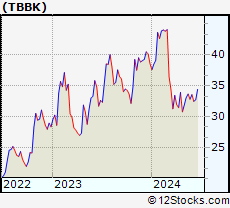 | TBBK The Bancorp, Inc. |
| Sector: Financials | |
| SubSector: Regional - Mid-Atlantic Banks | |
| MarketCap: 267.859 Millions | |
| Recent Price: 33.69 Smart Investing & Trading Score: 39 | |
| Day Percent Change: 0.87% Day Change: 0.29 | |
| Week Change: 1.75% Year-to-date Change: -12.6% | |
| TBBK Links: Profile News Message Board | |
| Charts:- Daily , Weekly | |
| Add TBBK to Watchlist: View: Get Complete TBBK Trend Analysis ➞ | |
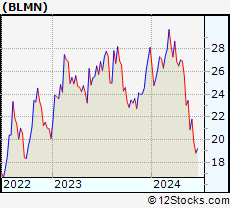 | BLMN Bloomin Brands, Inc. |
| Sector: Services & Goods | |
| SubSector: Restaurants | |
| MarketCap: 503.47 Millions | |
| Recent Price: 23.45 Smart Investing & Trading Score: 10 | |
| Day Percent Change: -2.78% Day Change: -0.67 | |
| Week Change: 1.74% Year-to-date Change: -16.7% | |
| BLMN Links: Profile News Message Board | |
| Charts:- Daily , Weekly | |
| Add BLMN to Watchlist: View: Get Complete BLMN Trend Analysis ➞ | |
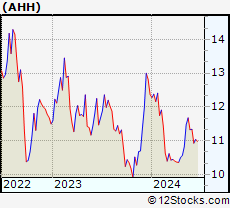 | AHH Armada Hoffler Properties, Inc. |
| Sector: Financials | |
| SubSector: REIT - Diversified | |
| MarketCap: 550.653 Millions | |
| Recent Price: 11.68 Smart Investing & Trading Score: 83 | |
| Day Percent Change: 0.69% Day Change: 0.08 | |
| Week Change: 1.74% Year-to-date Change: -5.6% | |
| AHH Links: Profile News Message Board | |
| Charts:- Daily , Weekly | |
| Add AHH to Watchlist: View: Get Complete AHH Trend Analysis ➞ | |
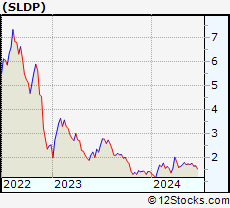 | SLDP Solid Power, Inc. |
| Sector: Industrials | |
| SubSector: Electrical Equipment & Parts | |
| MarketCap: 445 Millions | |
| Recent Price: 1.75 Smart Investing & Trading Score: 58 | |
| Day Percent Change: -1.69% Day Change: -0.03 | |
| Week Change: 1.74% Year-to-date Change: 22.8% | |
| SLDP Links: Profile News Message Board | |
| Charts:- Daily , Weekly | |
| Add SLDP to Watchlist: View: Get Complete SLDP Trend Analysis ➞ | |
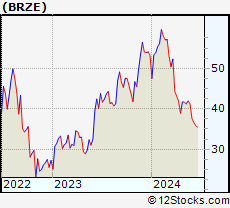 | BRZE Braze, Inc. |
| Sector: Technology | |
| SubSector: Software - Application | |
| MarketCap: 4340 Millions | |
| Recent Price: 41.94 Smart Investing & Trading Score: 32 | |
| Day Percent Change: -0.19% Day Change: -0.08 | |
| Week Change: 1.72% Year-to-date Change: -21.2% | |
| BRZE Links: Profile News Message Board | |
| Charts:- Daily , Weekly | |
| Add BRZE to Watchlist: View: Get Complete BRZE Trend Analysis ➞ | |
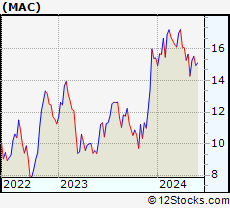 | MAC The Macerich Company |
| Sector: Financials | |
| SubSector: REIT - Retail | |
| MarketCap: 1172.54 Millions | |
| Recent Price: 15.54 Smart Investing & Trading Score: 17 | |
| Day Percent Change: -3.30% Day Change: -0.53 | |
| Week Change: 1.7% Year-to-date Change: 0.7% | |
| MAC Links: Profile News Message Board | |
| Charts:- Daily , Weekly | |
| Add MAC to Watchlist: View: Get Complete MAC Trend Analysis ➞ | |
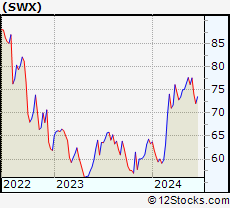 | SWX Southwest Gas Holdings, Inc. |
| Sector: Utilities | |
| SubSector: Gas Utilities | |
| MarketCap: 3427.87 Millions | |
| Recent Price: 77.68 Smart Investing & Trading Score: 95 | |
| Day Percent Change: 0.40% Day Change: 0.31 | |
| Week Change: 1.7% Year-to-date Change: 22.6% | |
| SWX Links: Profile News Message Board | |
| Charts:- Daily , Weekly | |
| Add SWX to Watchlist: View: Get Complete SWX Trend Analysis ➞ | |
| Too many stocks? View smallcap stocks filtered by marketcap & sector |
| Marketcap: All SmallCap Stocks (default-no microcap), Large, Mid-Range, Small & MicroCap |
| Sector: Tech, Finance, Energy, Staples, Retail, Industrial, Materials, Utilities & Medical |
|
Best Stocks Today 12Stocks.com |
© 2024 12Stocks.com Terms & Conditions Privacy Contact Us
All Information Provided Only For Education And Not To Be Used For Investing or Trading. See Terms & Conditions


One More Thing ... Get Best Stocks Delivered Daily!
Never Ever Miss A Move With Our Top Ten Stocks Lists
Find Best Stocks In Any Market - Bull or Bear Market
Take A Peek At Our Top Ten Stocks Lists: Daily, Weekly, Year-to-Date & Top Trends
Find Best Stocks In Any Market - Bull or Bear Market
Take A Peek At Our Top Ten Stocks Lists: Daily, Weekly, Year-to-Date & Top Trends
Smallcap Stocks With Best Up Trends [0-bearish to 100-bullish]: CommScope Holding[100], Coeur Mining[100], Hecla Mining[100], MicroStrategy [100], Enovix [100], Rayonier Advanced[100], Nurix [100], Energy Fuels[100], NovaGold Resources[100], Piedmont Lithium[100], Wave Life[100]
Best Smallcap Stocks Year-to-Date:
CareMax [495.88%], Bakkt [413.9%], Janux [338.34%], Viking [260.02%], Alpine Immune[241.23%], Longboard [238.63%], Avidity Biosciences[226.33%], Super Micro[212.35%], Arcutis Bio[184.83%], Sweetgreen [180.97%], Novavax [171.04%] Best Smallcap Stocks This Week:
Vaxxinity [58.82%], Novavax [46.51%], Vicarious Surgical[45.62%], Harrow Health[44.48%], ProKidney [44.31%], Workhorse Group[36.06%], Maxeon Solar[35.94%], Fossil Group[35.44%], Humacyte [34.68%], MicroStrategy [34.23%], Cadiz [33.48%] Best Smallcap Stocks Daily:
Vaxxinity [45.95%], Presto Automation[31.90%], Vicarious Surgical[27.93%], Orchestra BioMed[12.77%], CommScope Holding[11.86%], Coeur Mining[11.57%], Hecla Mining[11.11%], MicroStrategy [10.04%], Tenaya [9.65%], Bakkt [9.25%], Enovix [9.25%]