
 Login Sign Up


| |||||
 |  | ||||

| 12Stocks.com Market Intelligence |
Best SmallCap Stocks
|
| In a hurry? Small Cap Stock Lists: Performance Trends Table, Stock Charts
Sort Small Cap stocks: Daily, Weekly, Year-to-Date, Market Cap & Trends. Filter Small Cap stocks list by sector: Show all, Tech, Finance, Energy, Staples, Retail, Industrial, Materials, Utilities and HealthCare Filter Small Cap stocks list by size: All Large Medium Small and MicroCap |
| 12Stocks.com Small Cap Stocks Performances & Trends Daily | |||||||||
|
|  The overall Smart Investing & Trading Score is 76 (0-bearish to 100-bullish) which puts Small Cap index in short term neutral to bullish trend. The Smart Investing & Trading Score from previous trading session is 90 and hence a deterioration of trend.
| ||||||||
Here are the Smart Investing & Trading Scores of the most requested small cap stocks at 12Stocks.com (click stock name for detailed review):
|


| 12Stocks.com: Investing in Smallcap Index with Stocks | |
|
The following table helps investors and traders sort through current performance and trends (as measured by Smart Investing & Trading Score) of various
stocks in the Smallcap Index. Quick View: Move mouse or cursor over stock symbol (ticker) to view short-term technical chart and over stock name to view long term chart. Click on  to add stock symbol to your watchlist and to add stock symbol to your watchlist and  to view watchlist. Click on any ticker or stock name for detailed market intelligence report for that stock. to view watchlist. Click on any ticker or stock name for detailed market intelligence report for that stock. |
12Stocks.com Performance of Stocks in Smallcap Index
| Ticker | Stock Name | Watchlist | Category | Recent Price | Smart Investing & Trading Score | Change % | Weekly Change% |
| BTMD | biote |   | Health Care | 5.75 | 25 | -1.54% | -6.05% |
| PEPG | PepGen | | Health Care | 13.16 | 32 | -3.59% | -6.07% |
| NEO | NeoGenomics | | Health Care | 14.80 | 25 | -1.27% | -6.15% |
| AVIR | Atea | | Health Care | 3.65 | 40 | -1.22% | -6.17% |
| SLRN | Acelyrin | | Health Care | 4.39 | 42 | -5.18% | -6.20% |
| CVGI | Commercial Vehicle | | Services & Goods | 5.28 | 25 | -1.49% | -6.22% |
| LE | Lands | | Services & Goods | 14.03 | 59 | -0.28% | -6.22% |
| GPMT | Granite Point | | Financials | 3.41 | 32 | 2.40% | -6.32% |
| LAW | CS Disco | | Technology | 6.37 | 5 | -8.61% | -6.32% |
| CHGG | Chegg | | Services & Goods | 4.38 | 10 | -4.78% | -6.41% |
| GRND | Grindr | | Technology | 9.48 | 26 | -1.25% | -6.51% |
| SNCY | Sun Country | | Industrials | 10.75 | 10 | -2.45% | -6.68% |
| RAPT | RAPT | | Health Care | 4.04 | 28 | -2.42% | -6.70% |
| SNDX | Syndax | | Health Care | 20.29 | 0 | -3.01% | -6.71% |
| NVTS | Navitas Semiconductor | | Technology | 3.82 | 10 | -2.30% | -6.83% |
| IIIV | i3 Verticals | | Technology | 19.55 | 10 | -1.76% | -6.86% |
| IOVA | Iovance Bio | | Health Care | 10.24 | 0 | -1.82% | -6.87% |
| SRRK | Scholar Rock | | Health Care | 12.49 | 0 | -12.78% | -7.07% |
| IRWD | Ironwood | | Health Care | 6.48 | 27 | -2.41% | -7.43% |
| DNUT | Krispy Kreme | | Consumer Staples | 12.04 | 32 | 1.01% | -7.46% |
| FWRD | Forward Air | | Transports | 14.28 | 27 | -7.27% | -7.51% |
| SHLS | Shoals | | Technology | 6.41 | 0 | -6.29% | -7.64% |
| LCTX | Lineage Cell | | Health Care | 1.08 | 41 | 1.89% | -7.69% |
| NL | NL Industries | | Services & Goods | 7.27 | 68 | 4.01% | -7.74% |
| JAMF | Jamf Holding | | Technology | 18.00 | 50 | 0.84% | -7.74% |


| Too many stocks? View smallcap stocks filtered by marketcap & sector |
| Marketcap: All SmallCap Stocks (default-no microcap), Large, Mid-Range, Small |
| Smallcap Sector: Tech, Finance, Energy, Staples, Retail, Industrial, Materials, & Medical |
|
Get the most comprehensive stock market coverage daily at 12Stocks.com ➞ Best Stocks Today ➞ Best Stocks Weekly ➞ Best Stocks Year-to-Date ➞ Best Stocks Trends ➞  Best Stocks Today 12Stocks.com Best Nasdaq Stocks ➞ Best S&P 500 Stocks ➞ Best Tech Stocks ➞ Best Biotech Stocks ➞ |
| Detailed Overview of SmallCap Stocks |
| SmallCap Technical Overview, Leaders & Laggards, Top SmallCap ETF Funds & Detailed SmallCap Stocks List, Charts, Trends & More |
| Smallcap: Technical Analysis, Trends & YTD Performance | |
| SmallCap segment as represented by
IWM, an exchange-traded fund [ETF], holds basket of thousands of smallcap stocks from across all major sectors of the US stock market. The smallcap index (contains stocks like Riverbed & Sotheby's) is up by 3.67% and is currently underperforming the overall market by -6.9% year-to-date. Below is a quick view of technical charts and trends: | |
 IWM Weekly Chart |
|
| Long Term Trend: Very Good | |
| Medium Term Trend: Very Good | |
 IWM Daily Chart |
|
| Short Term Trend: Good | |
| Overall Trend Score: 76 | |
| YTD Performance: 3.67% | |
| **Trend Scores & Views Are Only For Educational Purposes And Not For Investing | |
| 12Stocks.com: Top Performing Small Cap Index Stocks | ||||||||||||||||||||||||||||||||||||||||||||||||
 The top performing Small Cap Index stocks year to date are
Now, more recently, over last week, the top performing Small Cap Index stocks on the move are


|
||||||||||||||||||||||||||||||||||||||||||||||||
| 12Stocks.com: Investing in Smallcap Index using Exchange Traded Funds | |
|
The following table shows list of key exchange traded funds (ETF) that
help investors track Smallcap index. The following list also includes leveraged ETF funds that track twice or thrice the daily returns of Smallcap indices. Short or inverse ETF funds move in the opposite direction to the index they track and are useful during market pullbacks or during bear markets. Quick View: Move mouse or cursor over ETF symbol (ticker) to view short-term technical chart and over ETF name to view long term chart. Click on ticker or stock name for detailed view. Click on to add stock symbol to your watchlist and to view watchlist. |
12Stocks.com List of ETFs that track Smallcap Index
| Ticker | ETF Name | Watchlist | Recent Price | Smart Investing & Trading Score | Change % | Week % | Year-to-date % |
| IWM | iShares Russell 2000 | | 208.08 | 76 | 0.07 | 1.85 | 3.67% |
| VTWO | Vanguard Russell 2000 ETF | | 84.11 | 71 | 0.00 | 1.8 | 3.71% |
| IJR | iShares Core S&P Small-Cap | | 110.39 | 68 | -0.22 | 1.29 | 1.98% |
| IWN | iShares Russell 2000 Value | | 158.71 | 76 | -0.07 | 1.61 | 2.18% |
| IWO | iShares Russell 2000 Growth | | 265.15 | 63 | -0.75 | 2.01 | 5.13% |
| IJS | iShares S&P Small-Cap 600 Value | | 101.87 | 76 | -0.15 | 1.34 | -1.16% |
| IJT | iShares S&P Small-Cap 600 Growth | | 131.34 | 71 | 0.04 | 1.14 | 4.95% |
| XSLV | PowerShares S&P SmallCap Low Volatil ETF | | 44.48 | 83 | -0.01 | 0.55 | 0.74% |
| SAA | ProShares Ultra SmallCap600 | | 24.90 | 71 | 0.50 | 2.28 | -0.18% |
| SMLV | SPDR SSGA US Small Cap Low Volatil ETF | | 113.28 | 95 | 0.43 | 1.85 | 0.68% |
| SDD | ProShares UltraShort SmallCap600 | | 17.84 | 35 | 0.96 | -2.41 | -3.19% |
| SBB | ProShares Short SmallCap600 | | 15.77 | 25 | 0.41 | -1.14 | -0.98% |
| 12Stocks.com: Charts, Trends, Fundamental Data and Performances of SmallCap Stocks | |
|
We now take in-depth look at all SmallCap stocks including charts, multi-period performances and overall trends (as measured by Smart Investing & Trading Score). One can sort SmallCap stocks (click link to choose) by Daily, Weekly and by Year-to-Date performances. Also, one can sort by size of the company or by market capitalization. |
| Select Your Default Chart Type: | |||||
| |||||
| Click on stock symbol or name for detailed view. Click on to add stock symbol to your watchlist and to view watchlist. Quick View: Move mouse or cursor over "Daily" to quickly view daily technical stock chart and over "Weekly" to view weekly technical stock chart. | |||||

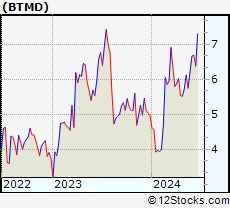 | BTMD biote Corp. |
| Sector: Health Care | |
| SubSector: Medical Care Facilities | |
| MarketCap: 468 Millions | |
| Recent Price: 5.75 Smart Investing & Trading Score: 25 | |
| Day Percent Change: -1.54% Day Change: -0.09 | |
| Week Change: -6.05% Year-to-date Change: 15.9% | |
| BTMD Links: Profile News Message Board | |
| Charts:- Daily , Weekly | |
| Add BTMD to Watchlist: View: Get Complete BTMD Trend Analysis ➞ | |
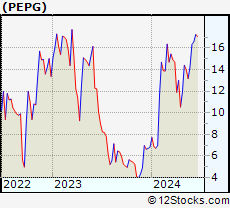 | PEPG PepGen Inc. |
| Sector: Health Care | |
| SubSector: Biotechnology | |
| MarketCap: 216 Millions | |
| Recent Price: 13.16 Smart Investing & Trading Score: 32 | |
| Day Percent Change: -3.59% Day Change: -0.49 | |
| Week Change: -6.07% Year-to-date Change: 92.4% | |
| PEPG Links: Profile News Message Board | |
| Charts:- Daily , Weekly | |
| Add PEPG to Watchlist: View: Get Complete PEPG Trend Analysis ➞ | |
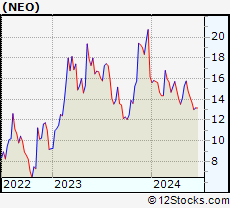 | NEO NeoGenomics, Inc. |
| Sector: Health Care | |
| SubSector: Medical Laboratories & Research | |
| MarketCap: 2763.8 Millions | |
| Recent Price: 14.80 Smart Investing & Trading Score: 25 | |
| Day Percent Change: -1.27% Day Change: -0.19 | |
| Week Change: -6.15% Year-to-date Change: -8.5% | |
| NEO Links: Profile News Message Board | |
| Charts:- Daily , Weekly | |
| Add NEO to Watchlist: View: Get Complete NEO Trend Analysis ➞ | |
 | AVIR Atea Pharmaceuticals, Inc. |
| Sector: Health Care | |
| SubSector: Biotechnology | |
| MarketCap: 22587 Millions | |
| Recent Price: 3.65 Smart Investing & Trading Score: 40 | |
| Day Percent Change: -1.22% Day Change: -0.04 | |
| Week Change: -6.17% Year-to-date Change: 19.7% | |
| AVIR Links: Profile News Message Board | |
| Charts:- Daily , Weekly | |
| Add AVIR to Watchlist: View: Get Complete AVIR Trend Analysis ➞ | |
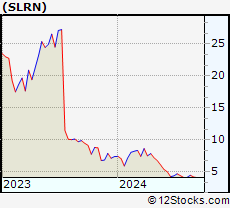 | SLRN Acelyrin, Inc. |
| Sector: Health Care | |
| SubSector: Biotechnology | |
| MarketCap: 2030 Millions | |
| Recent Price: 4.39 Smart Investing & Trading Score: 42 | |
| Day Percent Change: -5.18% Day Change: -0.24 | |
| Week Change: -6.2% Year-to-date Change: -40.4% | |
| SLRN Links: Profile News Message Board | |
| Charts:- Daily , Weekly | |
| Add SLRN to Watchlist: View: Get Complete SLRN Trend Analysis ➞ | |
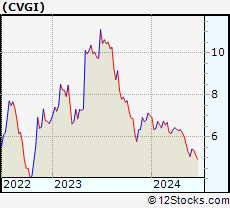 | CVGI Commercial Vehicle Group, Inc. |
| Sector: Services & Goods | |
| SubSector: Auto Parts Wholesale | |
| MarketCap: 56.6 Millions | |
| Recent Price: 5.28 Smart Investing & Trading Score: 25 | |
| Day Percent Change: -1.49% Day Change: -0.08 | |
| Week Change: -6.22% Year-to-date Change: -24.7% | |
| CVGI Links: Profile News Message Board | |
| Charts:- Daily , Weekly | |
| Add CVGI to Watchlist: View: Get Complete CVGI Trend Analysis ➞ | |
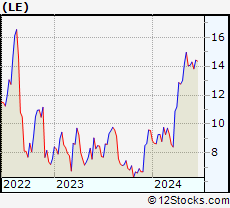 | LE Lands End, Inc. |
| Sector: Services & Goods | |
| SubSector: Catalog & Mail Order Houses | |
| MarketCap: 268.692 Millions | |
| Recent Price: 14.03 Smart Investing & Trading Score: 59 | |
| Day Percent Change: -0.28% Day Change: -0.04 | |
| Week Change: -6.22% Year-to-date Change: 46.8% | |
| LE Links: Profile News Message Board | |
| Charts:- Daily , Weekly | |
| Add LE to Watchlist: View: Get Complete LE Trend Analysis ➞ | |
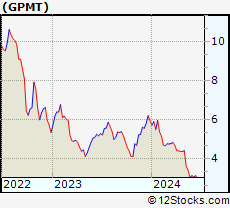 | GPMT Granite Point Mortgage Trust Inc. |
| Sector: Financials | |
| SubSector: Mortgage Investment | |
| MarketCap: 289.739 Millions | |
| Recent Price: 3.41 Smart Investing & Trading Score: 32 | |
| Day Percent Change: 2.40% Day Change: 0.08 | |
| Week Change: -6.32% Year-to-date Change: -42.6% | |
| GPMT Links: Profile News Message Board | |
| Charts:- Daily , Weekly | |
| Add GPMT to Watchlist: View: Get Complete GPMT Trend Analysis ➞ | |
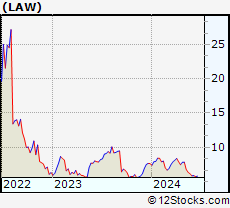 | LAW CS Disco, Inc. |
| Sector: Technology | |
| SubSector: Software - Application | |
| MarketCap: 505 Millions | |
| Recent Price: 6.37 Smart Investing & Trading Score: 5 | |
| Day Percent Change: -8.61% Day Change: -0.60 | |
| Week Change: -6.32% Year-to-date Change: -16.6% | |
| LAW Links: Profile News Message Board | |
| Charts:- Daily , Weekly | |
| Add LAW to Watchlist: View: Get Complete LAW Trend Analysis ➞ | |
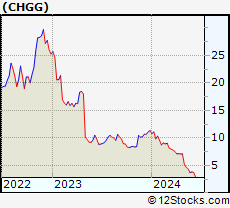 | CHGG Chegg, Inc. |
| Sector: Services & Goods | |
| SubSector: Education & Training Services | |
| MarketCap: 3606.86 Millions | |
| Recent Price: 4.38 Smart Investing & Trading Score: 10 | |
| Day Percent Change: -4.78% Day Change: -0.22 | |
| Week Change: -6.41% Year-to-date Change: -61.4% | |
| CHGG Links: Profile News Message Board | |
| Charts:- Daily , Weekly | |
| Add CHGG to Watchlist: View: Get Complete CHGG Trend Analysis ➞ | |
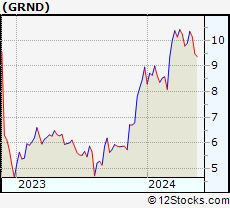 | GRND Grindr Inc. |
| Sector: Technology | |
| SubSector: Software - Application | |
| MarketCap: 929 Millions | |
| Recent Price: 9.48 Smart Investing & Trading Score: 26 | |
| Day Percent Change: -1.25% Day Change: -0.12 | |
| Week Change: -6.51% Year-to-date Change: 5.8% | |
| GRND Links: Profile News Message Board | |
| Charts:- Daily , Weekly | |
| Add GRND to Watchlist: View: Get Complete GRND Trend Analysis ➞ | |
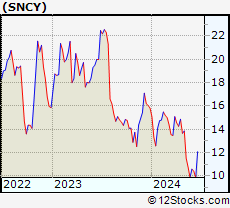 | SNCY Sun Country Airlines Holdings, Inc. |
| Sector: Industrials | |
| SubSector: Airlines | |
| MarketCap: 1230 Millions | |
| Recent Price: 10.75 Smart Investing & Trading Score: 10 | |
| Day Percent Change: -2.45% Day Change: -0.27 | |
| Week Change: -6.68% Year-to-date Change: -32.0% | |
| SNCY Links: Profile News Message Board | |
| Charts:- Daily , Weekly | |
| Add SNCY to Watchlist: View: Get Complete SNCY Trend Analysis ➞ | |
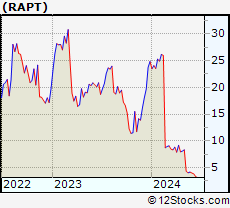 | RAPT RAPT Therapeutics, Inc. |
| Sector: Health Care | |
| SubSector: Biotechnology | |
| MarketCap: 368.785 Millions | |
| Recent Price: 4.04 Smart Investing & Trading Score: 28 | |
| Day Percent Change: -2.42% Day Change: -0.10 | |
| Week Change: -6.7% Year-to-date Change: -83.7% | |
| RAPT Links: Profile News Message Board | |
| Charts:- Daily , Weekly | |
| Add RAPT to Watchlist: View: Get Complete RAPT Trend Analysis ➞ | |
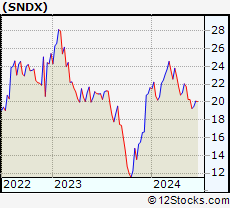 | SNDX Syndax Pharmaceuticals, Inc. |
| Sector: Health Care | |
| SubSector: Biotechnology | |
| MarketCap: 365.985 Millions | |
| Recent Price: 20.29 Smart Investing & Trading Score: 0 | |
| Day Percent Change: -3.01% Day Change: -0.63 | |
| Week Change: -6.71% Year-to-date Change: -6.1% | |
| SNDX Links: Profile News Message Board | |
| Charts:- Daily , Weekly | |
| Add SNDX to Watchlist: View: Get Complete SNDX Trend Analysis ➞ | |
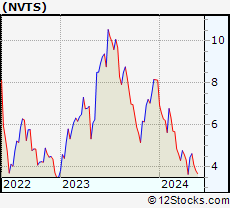 | NVTS Navitas Semiconductor Corporation |
| Sector: Technology | |
| SubSector: Semiconductors | |
| MarketCap: 1790 Millions | |
| Recent Price: 3.82 Smart Investing & Trading Score: 10 | |
| Day Percent Change: -2.30% Day Change: -0.09 | |
| Week Change: -6.83% Year-to-date Change: -53.0% | |
| NVTS Links: Profile News Message Board | |
| Charts:- Daily , Weekly | |
| Add NVTS to Watchlist: View: Get Complete NVTS Trend Analysis ➞ | |
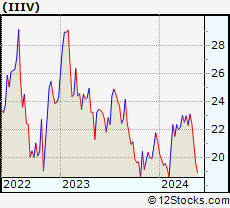 | IIIV i3 Verticals, Inc. |
| Sector: Technology | |
| SubSector: Business Software & Services | |
| MarketCap: 448.458 Millions | |
| Recent Price: 19.55 Smart Investing & Trading Score: 10 | |
| Day Percent Change: -1.76% Day Change: -0.35 | |
| Week Change: -6.86% Year-to-date Change: -7.7% | |
| IIIV Links: Profile News Message Board | |
| Charts:- Daily , Weekly | |
| Add IIIV to Watchlist: View: Get Complete IIIV Trend Analysis ➞ | |
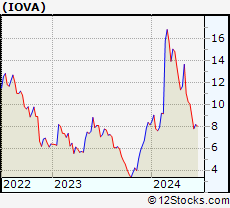 | IOVA Iovance Biotherapeutics, Inc. |
| Sector: Health Care | |
| SubSector: Biotechnology | |
| MarketCap: 3533.35 Millions | |
| Recent Price: 10.24 Smart Investing & Trading Score: 0 | |
| Day Percent Change: -1.82% Day Change: -0.19 | |
| Week Change: -6.87% Year-to-date Change: 26.0% | |
| IOVA Links: Profile News Message Board | |
| Charts:- Daily , Weekly | |
| Add IOVA to Watchlist: View: Get Complete IOVA Trend Analysis ➞ | |
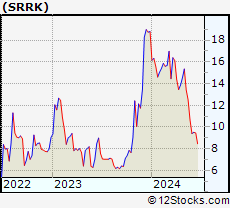 | SRRK Scholar Rock Holding Corporation |
| Sector: Health Care | |
| SubSector: Biotechnology | |
| MarketCap: 441.385 Millions | |
| Recent Price: 12.49 Smart Investing & Trading Score: 0 | |
| Day Percent Change: -12.78% Day Change: -1.83 | |
| Week Change: -7.07% Year-to-date Change: -33.6% | |
| SRRK Links: Profile News Message Board | |
| Charts:- Daily , Weekly | |
| Add SRRK to Watchlist: View: Get Complete SRRK Trend Analysis ➞ | |
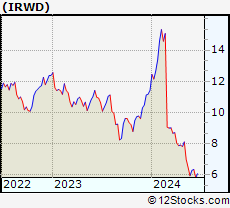 | IRWD Ironwood Pharmaceuticals, Inc. |
| Sector: Health Care | |
| SubSector: Drugs - Generic | |
| MarketCap: 1616.35 Millions | |
| Recent Price: 6.48 Smart Investing & Trading Score: 27 | |
| Day Percent Change: -2.41% Day Change: -0.16 | |
| Week Change: -7.43% Year-to-date Change: -43.4% | |
| IRWD Links: Profile News Message Board | |
| Charts:- Daily , Weekly | |
| Add IRWD to Watchlist: View: Get Complete IRWD Trend Analysis ➞ | |
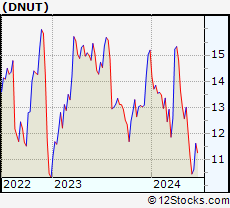 | DNUT Krispy Kreme, Inc. |
| Sector: Consumer Staples | |
| SubSector: Grocery Stores | |
| MarketCap: 2480 Millions | |
| Recent Price: 12.04 Smart Investing & Trading Score: 32 | |
| Day Percent Change: 1.01% Day Change: 0.12 | |
| Week Change: -7.46% Year-to-date Change: -20.8% | |
| DNUT Links: Profile News Message Board | |
| Charts:- Daily , Weekly | |
| Add DNUT to Watchlist: View: Get Complete DNUT Trend Analysis ➞ | |
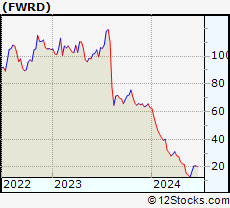 | FWRD Forward Air Corporation |
| Sector: Transports | |
| SubSector: Air Delivery & Freight Services | |
| MarketCap: 1278.88 Millions | |
| Recent Price: 14.28 Smart Investing & Trading Score: 27 | |
| Day Percent Change: -7.27% Day Change: -1.12 | |
| Week Change: -7.51% Year-to-date Change: -77.3% | |
| FWRD Links: Profile News Message Board | |
| Charts:- Daily , Weekly | |
| Add FWRD to Watchlist: View: Get Complete FWRD Trend Analysis ➞ | |
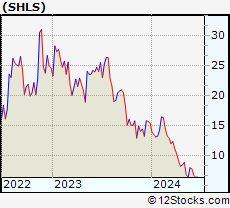 | SHLS Shoals Technologies Group, Inc. |
| Sector: Technology | |
| SubSector: Solar | |
| MarketCap: 4360 Millions | |
| Recent Price: 6.41 Smart Investing & Trading Score: 0 | |
| Day Percent Change: -6.29% Day Change: -0.43 | |
| Week Change: -7.64% Year-to-date Change: -58.7% | |
| SHLS Links: Profile News Message Board | |
| Charts:- Daily , Weekly | |
| Add SHLS to Watchlist: View: Get Complete SHLS Trend Analysis ➞ | |
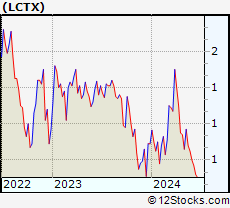 | LCTX Lineage Cell Therapeutics, Inc. |
| Sector: Health Care | |
| SubSector: Biotechnology | |
| MarketCap: 141.285 Millions | |
| Recent Price: 1.08 Smart Investing & Trading Score: 41 | |
| Day Percent Change: 1.89% Day Change: 0.02 | |
| Week Change: -7.69% Year-to-date Change: -0.9% | |
| LCTX Links: Profile News Message Board | |
| Charts:- Daily , Weekly | |
| Add LCTX to Watchlist: View: Get Complete LCTX Trend Analysis ➞ | |
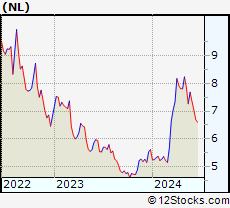 | NL NL Industries, Inc. |
| Sector: Services & Goods | |
| SubSector: Industrial Equipment Wholesale | |
| MarketCap: 126.258 Millions | |
| Recent Price: 7.27 Smart Investing & Trading Score: 68 | |
| Day Percent Change: 4.01% Day Change: 0.28 | |
| Week Change: -7.74% Year-to-date Change: 29.6% | |
| NL Links: Profile News Message Board | |
| Charts:- Daily , Weekly | |
| Add NL to Watchlist: View: Get Complete NL Trend Analysis ➞ | |
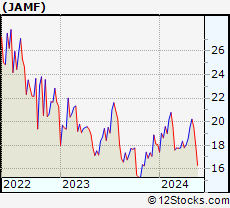 | JAMF Jamf Holding Corp. |
| Sector: Technology | |
| SubSector: Software Application | |
| MarketCap: 36987 Millions | |
| Recent Price: 18.00 Smart Investing & Trading Score: 50 | |
| Day Percent Change: 0.84% Day Change: 0.15 | |
| Week Change: -7.74% Year-to-date Change: -0.4% | |
| JAMF Links: Profile News Message Board | |
| Charts:- Daily , Weekly | |
| Add JAMF to Watchlist: View: Get Complete JAMF Trend Analysis ➞ | |
| Too many stocks? View smallcap stocks filtered by marketcap & sector |
| Marketcap: All SmallCap Stocks (default-no microcap), Large, Mid-Range, Small & MicroCap |
| Sector: Tech, Finance, Energy, Staples, Retail, Industrial, Materials, Utilities & Medical |
|
Best Stocks Today 12Stocks.com |
© 2024 12Stocks.com Terms & Conditions Privacy Contact Us
All Information Provided Only For Education And Not To Be Used For Investing or Trading. See Terms & Conditions


One More Thing ... Get Best Stocks Delivered Daily!
Never Ever Miss A Move With Our Top Ten Stocks Lists
Find Best Stocks In Any Market - Bull or Bear Market
Take A Peek At Our Top Ten Stocks Lists: Daily, Weekly, Year-to-Date & Top Trends
Find Best Stocks In Any Market - Bull or Bear Market
Take A Peek At Our Top Ten Stocks Lists: Daily, Weekly, Year-to-Date & Top Trends
Smallcap Stocks With Best Up Trends [0-bearish to 100-bullish]: CommScope Holding[100], Coeur Mining[100], Hecla Mining[100], MicroStrategy [100], Enovix [100], Rayonier Advanced[100], Nurix [100], Energy Fuels[100], NovaGold Resources[100], Piedmont Lithium[100], Wave Life[100]
Best Smallcap Stocks Year-to-Date:
CareMax [495.88%], Bakkt [413.9%], Janux [338.34%], Viking [260.02%], Alpine Immune[241.23%], Longboard [238.63%], Avidity Biosciences[226.33%], Super Micro[212.35%], Arcutis Bio[184.83%], Sweetgreen [180.97%], Novavax [171.04%] Best Smallcap Stocks This Week:
Vaxxinity [58.82%], Novavax [46.51%], Vicarious Surgical[45.62%], Harrow Health[44.48%], ProKidney [44.31%], Workhorse Group[36.06%], Maxeon Solar[35.94%], Fossil Group[35.44%], Humacyte [34.68%], MicroStrategy [34.23%], Cadiz [33.48%] Best Smallcap Stocks Daily:
Vaxxinity [45.95%], Presto Automation[31.90%], Vicarious Surgical[27.93%], Orchestra BioMed[12.77%], CommScope Holding[11.86%], Coeur Mining[11.57%], Hecla Mining[11.11%], MicroStrategy [10.04%], Tenaya [9.65%], Bakkt [9.25%], Enovix [9.25%]