
 Login Sign Up


| |||||
 |  | ||||

| 12Stocks.com Market Intelligence |
Best SmallCap Stocks
|
| In a hurry? Small Cap Stock Lists: Performance Trends Table, Stock Charts
Sort Small Cap stocks: Daily, Weekly, Year-to-Date, Market Cap & Trends. Filter Small Cap stocks list by sector: Show all, Tech, Finance, Energy, Staples, Retail, Industrial, Materials, Utilities and HealthCare Filter Small Cap stocks list by size: All Large Medium Small and MicroCap |
| 12Stocks.com Small Cap Stocks Performances & Trends Daily | |||||||||
|
|  The overall Smart Investing & Trading Score is 76 (0-bearish to 100-bullish) which puts Small Cap index in short term neutral to bullish trend. The Smart Investing & Trading Score from previous trading session is 90 and hence a deterioration of trend.
| ||||||||
Here are the Smart Investing & Trading Scores of the most requested small cap stocks at 12Stocks.com (click stock name for detailed review):
|


| 12Stocks.com: Investing in Smallcap Index with Stocks | |
|
The following table helps investors and traders sort through current performance and trends (as measured by Smart Investing & Trading Score) of various
stocks in the Smallcap Index. Quick View: Move mouse or cursor over stock symbol (ticker) to view short-term technical chart and over stock name to view long term chart. Click on  to add stock symbol to your watchlist and to add stock symbol to your watchlist and  to view watchlist. Click on any ticker or stock name for detailed market intelligence report for that stock. to view watchlist. Click on any ticker or stock name for detailed market intelligence report for that stock. |
12Stocks.com Performance of Stocks in Smallcap Index
| Ticker | Stock Name | Watchlist | Category | Recent Price | Smart Investing & Trading Score | Change % | Weekly Change% |
| IE | Ivanhoe Electric |   | Materials | 11.97 | 63 | -1.97% | -3.31% |
| BOOM | DMC Global | | Industrials | 13.10 | 25 | 0.61% | -3.32% |
| OPFI | OppFi | | Financials | 2.91 | 32 | 2.46% | -3.32% |
| CMAX | CareMax | | Health Care | 2.89 | 35 | 4.33% | -3.34% |
| PCYO | Pure Cycle | | Utilities | 9.48 | 15 | 2.05% | -3.36% |
| STRO | Sutro Biopharma | | Health Care | 4.01 | 44 | -3.37% | -3.37% |
| SAFT | Safety Insurance | | Financials | 80.26 | 35 | -0.88% | -3.38% |
| GBX | Greenbrier | | Transports | 51.42 | 25 | -2.69% | -3.38% |
| IRBT | iRobot | | Consumer Staples | 10.84 | 49 | -3.26% | -3.39% |
| CXW | CoreCivic | | Financials | 15.03 | 15 | -0.53% | -3.41% |
| ELF | e.l.f. Beauty | | Consumer Staples | 158.45 | 0 | -2.35% | -3.44% |
| RIGL | Rigel | | Health Care | 0.95 | 7 | -3.27% | -3.45% |
| WNC | Wabash National | | Consumer Staples | 22.47 | 0 | -3.23% | -3.48% |
| ADTN | ADTRAN | | Technology | 5.27 | 42 | -1.86% | -3.48% |
| DSGN | Design | | Health Care | 4.41 | 56 | -2.00% | -3.50% |
| HLLY | Holley | | Services & Goods | 3.85 | 0 | -1.53% | -3.51% |
| ANDE | Andersons | | Consumer Staples | 51.47 | 10 | -1.89% | -3.61% |
| EWCZ | European Wax | | Consumer Staples | 10.67 | 0 | -4.90% | -3.61% |
| MYE | Myers Industries | | Consumer Staples | 16.42 | 25 | -3.41% | -3.64% |
| ATEC | Alphatec | | Health Care | 11.10 | 25 | -3.73% | -3.65% |
| MYRG | MYR Group | | Industrials | 154.82 | 32 | 1.98% | -3.66% |
| HCI | HCI Group | | Financials | 99.98 | 36 | -0.97% | -3.66% |
| KROS | Keros | | Health Care | 52.28 | 0 | -3.17% | -3.67% |
| HRMY | Harmony Biosciences | | Health Care | 29.03 | 10 | -0.96% | -3.68% |
| JANX | Janux | | Health Care | 47.10 | 23 | -0.86% | -3.72% |


| Too many stocks? View smallcap stocks filtered by marketcap & sector |
| Marketcap: All SmallCap Stocks (default-no microcap), Large, Mid-Range, Small |
| Smallcap Sector: Tech, Finance, Energy, Staples, Retail, Industrial, Materials, & Medical |
|
Get the most comprehensive stock market coverage daily at 12Stocks.com ➞ Best Stocks Today ➞ Best Stocks Weekly ➞ Best Stocks Year-to-Date ➞ Best Stocks Trends ➞  Best Stocks Today 12Stocks.com Best Nasdaq Stocks ➞ Best S&P 500 Stocks ➞ Best Tech Stocks ➞ Best Biotech Stocks ➞ |
| Detailed Overview of SmallCap Stocks |
| SmallCap Technical Overview, Leaders & Laggards, Top SmallCap ETF Funds & Detailed SmallCap Stocks List, Charts, Trends & More |
| Smallcap: Technical Analysis, Trends & YTD Performance | |
| SmallCap segment as represented by
IWM, an exchange-traded fund [ETF], holds basket of thousands of smallcap stocks from across all major sectors of the US stock market. The smallcap index (contains stocks like Riverbed & Sotheby's) is up by 3.67% and is currently underperforming the overall market by -6.9% year-to-date. Below is a quick view of technical charts and trends: | |
 IWM Weekly Chart |
|
| Long Term Trend: Very Good | |
| Medium Term Trend: Very Good | |
 IWM Daily Chart |
|
| Short Term Trend: Good | |
| Overall Trend Score: 76 | |
| YTD Performance: 3.67% | |
| **Trend Scores & Views Are Only For Educational Purposes And Not For Investing | |
| 12Stocks.com: Top Performing Small Cap Index Stocks | ||||||||||||||||||||||||||||||||||||||||||||||||
 The top performing Small Cap Index stocks year to date are
Now, more recently, over last week, the top performing Small Cap Index stocks on the move are


|
||||||||||||||||||||||||||||||||||||||||||||||||
| 12Stocks.com: Investing in Smallcap Index using Exchange Traded Funds | |
|
The following table shows list of key exchange traded funds (ETF) that
help investors track Smallcap index. The following list also includes leveraged ETF funds that track twice or thrice the daily returns of Smallcap indices. Short or inverse ETF funds move in the opposite direction to the index they track and are useful during market pullbacks or during bear markets. Quick View: Move mouse or cursor over ETF symbol (ticker) to view short-term technical chart and over ETF name to view long term chart. Click on ticker or stock name for detailed view. Click on to add stock symbol to your watchlist and to view watchlist. |
12Stocks.com List of ETFs that track Smallcap Index
| Ticker | ETF Name | Watchlist | Recent Price | Smart Investing & Trading Score | Change % | Week % | Year-to-date % |
| IWM | iShares Russell 2000 | | 208.08 | 76 | 0.07 | 1.85 | 3.67% |
| VTWO | Vanguard Russell 2000 ETF | | 84.11 | 71 | 0.00 | 1.8 | 3.71% |
| IJR | iShares Core S&P Small-Cap | | 110.39 | 68 | -0.22 | 1.29 | 1.98% |
| IWN | iShares Russell 2000 Value | | 158.71 | 76 | -0.07 | 1.61 | 2.18% |
| IWO | iShares Russell 2000 Growth | | 265.15 | 63 | -0.75 | 2.01 | 5.13% |
| IJS | iShares S&P Small-Cap 600 Value | | 101.87 | 76 | -0.15 | 1.34 | -1.16% |
| IJT | iShares S&P Small-Cap 600 Growth | | 131.34 | 71 | 0.04 | 1.14 | 4.95% |
| XSLV | PowerShares S&P SmallCap Low Volatil ETF | | 44.48 | 83 | -0.01 | 0.55 | 0.74% |
| SAA | ProShares Ultra SmallCap600 | | 24.90 | 71 | 0.50 | 2.28 | -0.18% |
| SMLV | SPDR SSGA US Small Cap Low Volatil ETF | | 113.28 | 95 | 0.43 | 1.85 | 0.68% |
| SDD | ProShares UltraShort SmallCap600 | | 17.84 | 35 | 0.96 | -2.41 | -3.19% |
| SBB | ProShares Short SmallCap600 | | 15.77 | 25 | 0.41 | -1.14 | -0.98% |
| 12Stocks.com: Charts, Trends, Fundamental Data and Performances of SmallCap Stocks | |
|
We now take in-depth look at all SmallCap stocks including charts, multi-period performances and overall trends (as measured by Smart Investing & Trading Score). One can sort SmallCap stocks (click link to choose) by Daily, Weekly and by Year-to-Date performances. Also, one can sort by size of the company or by market capitalization. |
| Select Your Default Chart Type: | |||||
| |||||
| Click on stock symbol or name for detailed view. Click on to add stock symbol to your watchlist and to view watchlist. Quick View: Move mouse or cursor over "Daily" to quickly view daily technical stock chart and over "Weekly" to view weekly technical stock chart. | |||||

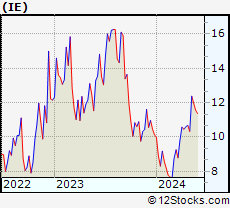 | IE Ivanhoe Electric Inc. |
| Sector: Materials | |
| SubSector: Copper | |
| MarketCap: 1200 Millions | |
| Recent Price: 11.97 Smart Investing & Trading Score: 63 | |
| Day Percent Change: -1.97% Day Change: -0.24 | |
| Week Change: -3.31% Year-to-date Change: 18.1% | |
| IE Links: Profile News Message Board | |
| Charts:- Daily , Weekly | |
| Add IE to Watchlist: View: Get Complete IE Trend Analysis ➞ | |
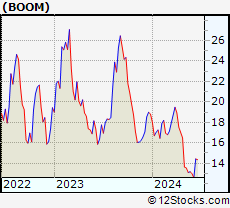 | BOOM DMC Global Inc. |
| Sector: Industrials | |
| SubSector: Metal Fabrication | |
| MarketCap: 359.15 Millions | |
| Recent Price: 13.10 Smart Investing & Trading Score: 25 | |
| Day Percent Change: 0.61% Day Change: 0.08 | |
| Week Change: -3.32% Year-to-date Change: -30.4% | |
| BOOM Links: Profile News Message Board | |
| Charts:- Daily , Weekly | |
| Add BOOM to Watchlist: View: Get Complete BOOM Trend Analysis ➞ | |
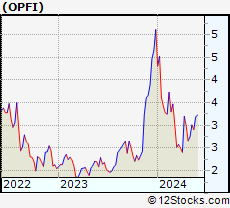 | OPFI OppFi Inc. |
| Sector: Financials | |
| SubSector: Credit Services | |
| MarketCap: 226 Millions | |
| Recent Price: 2.91 Smart Investing & Trading Score: 32 | |
| Day Percent Change: 2.46% Day Change: 0.07 | |
| Week Change: -3.32% Year-to-date Change: -43.1% | |
| OPFI Links: Profile News Message Board | |
| Charts:- Daily , Weekly | |
| Add OPFI to Watchlist: View: Get Complete OPFI Trend Analysis ➞ | |
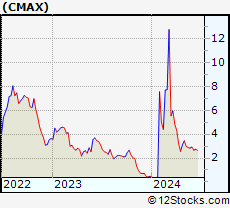 | CMAX CareMax, Inc. |
| Sector: Health Care | |
| SubSector: Health Information Services | |
| MarketCap: 371 Millions | |
| Recent Price: 2.89 Smart Investing & Trading Score: 35 | |
| Day Percent Change: 4.33% Day Change: 0.12 | |
| Week Change: -3.34% Year-to-date Change: 495.9% | |
| CMAX Links: Profile News Message Board | |
| Charts:- Daily , Weekly | |
| Add CMAX to Watchlist: View: Get Complete CMAX Trend Analysis ➞ | |
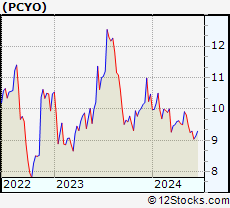 | PCYO Pure Cycle Corporation |
| Sector: Utilities | |
| SubSector: Water Utilities | |
| MarketCap: 247.102 Millions | |
| Recent Price: 9.48 Smart Investing & Trading Score: 15 | |
| Day Percent Change: 2.05% Day Change: 0.19 | |
| Week Change: -3.36% Year-to-date Change: -9.5% | |
| PCYO Links: Profile News Message Board | |
| Charts:- Daily , Weekly | |
| Add PCYO to Watchlist: View: Get Complete PCYO Trend Analysis ➞ | |
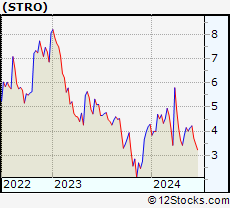 | STRO Sutro Biopharma, Inc. |
| Sector: Health Care | |
| SubSector: Biotechnology | |
| MarketCap: 196.485 Millions | |
| Recent Price: 4.01 Smart Investing & Trading Score: 44 | |
| Day Percent Change: -3.37% Day Change: -0.14 | |
| Week Change: -3.37% Year-to-date Change: -6.5% | |
| STRO Links: Profile News Message Board | |
| Charts:- Daily , Weekly | |
| Add STRO to Watchlist: View: Get Complete STRO Trend Analysis ➞ | |
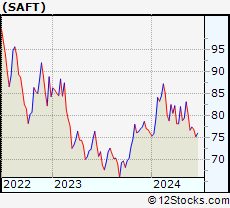 | SAFT Safety Insurance Group, Inc. |
| Sector: Financials | |
| SubSector: Property & Casualty Insurance | |
| MarketCap: 1145.12 Millions | |
| Recent Price: 80.26 Smart Investing & Trading Score: 35 | |
| Day Percent Change: -0.88% Day Change: -0.71 | |
| Week Change: -3.38% Year-to-date Change: 5.6% | |
| SAFT Links: Profile News Message Board | |
| Charts:- Daily , Weekly | |
| Add SAFT to Watchlist: View: Get Complete SAFT Trend Analysis ➞ | |
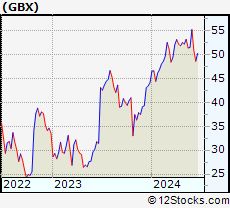 | GBX The Greenbrier Companies, Inc. |
| Sector: Transports | |
| SubSector: Railroads | |
| MarketCap: 511.022 Millions | |
| Recent Price: 51.42 Smart Investing & Trading Score: 25 | |
| Day Percent Change: -2.69% Day Change: -1.42 | |
| Week Change: -3.38% Year-to-date Change: 16.4% | |
| GBX Links: Profile News Message Board | |
| Charts:- Daily , Weekly | |
| Add GBX to Watchlist: View: Get Complete GBX Trend Analysis ➞ | |
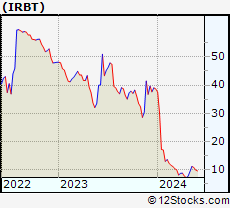 | IRBT iRobot Corporation |
| Sector: Consumer Staples | |
| SubSector: Appliances | |
| MarketCap: 1193.38 Millions | |
| Recent Price: 10.84 Smart Investing & Trading Score: 49 | |
| Day Percent Change: -3.26% Day Change: -0.37 | |
| Week Change: -3.39% Year-to-date Change: -72.0% | |
| IRBT Links: Profile News Message Board | |
| Charts:- Daily , Weekly | |
| Add IRBT to Watchlist: View: Get Complete IRBT Trend Analysis ➞ | |
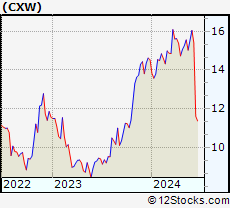 | CXW CoreCivic, Inc. |
| Sector: Financials | |
| SubSector: REIT - Diversified | |
| MarketCap: 1440.23 Millions | |
| Recent Price: 15.03 Smart Investing & Trading Score: 15 | |
| Day Percent Change: -0.53% Day Change: -0.08 | |
| Week Change: -3.41% Year-to-date Change: 3.4% | |
| CXW Links: Profile News Message Board | |
| Charts:- Daily , Weekly | |
| Add CXW to Watchlist: View: Get Complete CXW Trend Analysis ➞ | |
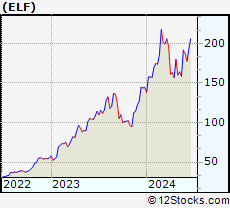 | ELF e.l.f. Beauty, Inc. |
| Sector: Consumer Staples | |
| SubSector: Personal Products | |
| MarketCap: 497.985 Millions | |
| Recent Price: 158.45 Smart Investing & Trading Score: 0 | |
| Day Percent Change: -2.35% Day Change: -3.81 | |
| Week Change: -3.44% Year-to-date Change: 9.8% | |
| ELF Links: Profile News Message Board | |
| Charts:- Daily , Weekly | |
| Add ELF to Watchlist: View: Get Complete ELF Trend Analysis ➞ | |
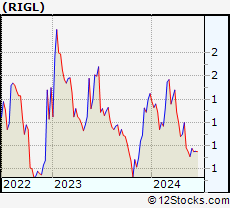 | RIGL Rigel Pharmaceuticals, Inc. |
| Sector: Health Care | |
| SubSector: Biotechnology | |
| MarketCap: 256.585 Millions | |
| Recent Price: 0.95 Smart Investing & Trading Score: 7 | |
| Day Percent Change: -3.27% Day Change: -0.03 | |
| Week Change: -3.45% Year-to-date Change: -34.5% | |
| RIGL Links: Profile News Message Board | |
| Charts:- Daily , Weekly | |
| Add RIGL to Watchlist: View: Get Complete RIGL Trend Analysis ➞ | |
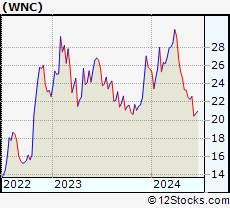 | WNC Wabash National Corporation |
| Sector: Consumer Staples | |
| SubSector: Trucks & Other Vehicles | |
| MarketCap: 482.597 Millions | |
| Recent Price: 22.47 Smart Investing & Trading Score: 0 | |
| Day Percent Change: -3.23% Day Change: -0.75 | |
| Week Change: -3.48% Year-to-date Change: -12.3% | |
| WNC Links: Profile News Message Board | |
| Charts:- Daily , Weekly | |
| Add WNC to Watchlist: View: Get Complete WNC Trend Analysis ➞ | |
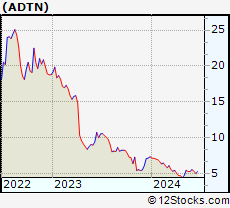 | ADTN ADTRAN, Inc. |
| Sector: Technology | |
| SubSector: Communication Equipment | |
| MarketCap: 303.539 Millions | |
| Recent Price: 5.27 Smart Investing & Trading Score: 42 | |
| Day Percent Change: -1.86% Day Change: -0.10 | |
| Week Change: -3.48% Year-to-date Change: -28.2% | |
| ADTN Links: Profile News Message Board | |
| Charts:- Daily , Weekly | |
| Add ADTN to Watchlist: View: Get Complete ADTN Trend Analysis ➞ | |
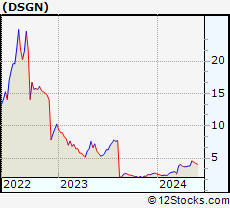 | DSGN Design Therapeutics, Inc. |
| Sector: Health Care | |
| SubSector: Biotechnology | |
| MarketCap: 367 Millions | |
| Recent Price: 4.41 Smart Investing & Trading Score: 56 | |
| Day Percent Change: -2.00% Day Change: -0.09 | |
| Week Change: -3.5% Year-to-date Change: 66.1% | |
| DSGN Links: Profile News Message Board | |
| Charts:- Daily , Weekly | |
| Add DSGN to Watchlist: View: Get Complete DSGN Trend Analysis ➞ | |
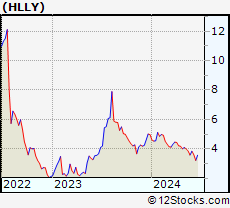 | HLLY Holley Inc. |
| Sector: Services & Goods | |
| SubSector: Auto Parts | |
| MarketCap: 469 Millions | |
| Recent Price: 3.85 Smart Investing & Trading Score: 0 | |
| Day Percent Change: -1.53% Day Change: -0.06 | |
| Week Change: -3.51% Year-to-date Change: -22.5% | |
| HLLY Links: Profile News Message Board | |
| Charts:- Daily , Weekly | |
| Add HLLY to Watchlist: View: Get Complete HLLY Trend Analysis ➞ | |
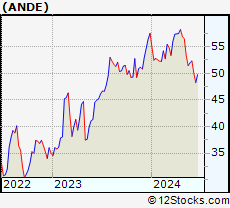 | ANDE The Andersons, Inc. |
| Sector: Consumer Staples | |
| SubSector: Farm Products | |
| MarketCap: 630.887 Millions | |
| Recent Price: 51.47 Smart Investing & Trading Score: 10 | |
| Day Percent Change: -1.89% Day Change: -0.99 | |
| Week Change: -3.61% Year-to-date Change: -10.6% | |
| ANDE Links: Profile News Message Board | |
| Charts:- Daily , Weekly | |
| Add ANDE to Watchlist: View: Get Complete ANDE Trend Analysis ➞ | |
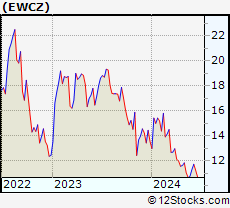 | EWCZ European Wax Center, Inc. |
| Sector: Consumer Staples | |
| SubSector: Household & Personal Products | |
| MarketCap: 1180 Millions | |
| Recent Price: 10.67 Smart Investing & Trading Score: 0 | |
| Day Percent Change: -4.90% Day Change: -0.55 | |
| Week Change: -3.61% Year-to-date Change: -21.2% | |
| EWCZ Links: Profile News Message Board | |
| Charts:- Daily , Weekly | |
| Add EWCZ to Watchlist: View: Get Complete EWCZ Trend Analysis ➞ | |
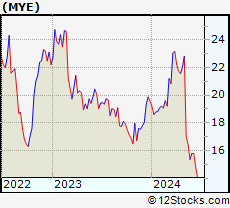 | MYE Myers Industries, Inc. |
| Sector: Consumer Staples | |
| SubSector: Rubber & Plastics | |
| MarketCap: 347.57 Millions | |
| Recent Price: 16.42 Smart Investing & Trading Score: 25 | |
| Day Percent Change: -3.41% Day Change: -0.58 | |
| Week Change: -3.64% Year-to-date Change: -16.0% | |
| MYE Links: Profile News Message Board | |
| Charts:- Daily , Weekly | |
| Add MYE to Watchlist: View: Get Complete MYE Trend Analysis ➞ | |
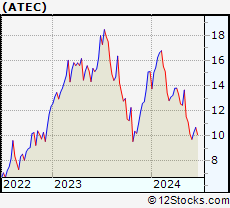 | ATEC Alphatec Holdings, Inc. |
| Sector: Health Care | |
| SubSector: Medical Instruments & Supplies | |
| MarketCap: 181.16 Millions | |
| Recent Price: 11.10 Smart Investing & Trading Score: 25 | |
| Day Percent Change: -3.73% Day Change: -0.43 | |
| Week Change: -3.65% Year-to-date Change: -26.5% | |
| ATEC Links: Profile News Message Board | |
| Charts:- Daily , Weekly | |
| Add ATEC to Watchlist: View: Get Complete ATEC Trend Analysis ➞ | |
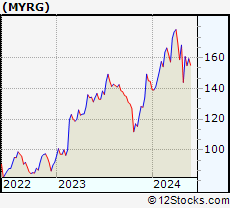 | MYRG MYR Group Inc. |
| Sector: Industrials | |
| SubSector: General Contractors | |
| MarketCap: 405.363 Millions | |
| Recent Price: 154.82 Smart Investing & Trading Score: 32 | |
| Day Percent Change: 1.98% Day Change: 3.00 | |
| Week Change: -3.66% Year-to-date Change: 7.1% | |
| MYRG Links: Profile News Message Board | |
| Charts:- Daily , Weekly | |
| Add MYRG to Watchlist: View: Get Complete MYRG Trend Analysis ➞ | |
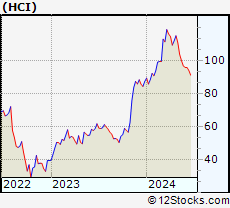 | HCI HCI Group, Inc. |
| Sector: Financials | |
| SubSector: Property & Casualty Insurance | |
| MarketCap: 297.412 Millions | |
| Recent Price: 99.98 Smart Investing & Trading Score: 36 | |
| Day Percent Change: -0.97% Day Change: -0.98 | |
| Week Change: -3.66% Year-to-date Change: 14.4% | |
| HCI Links: Profile News Message Board | |
| Charts:- Daily , Weekly | |
| Add HCI to Watchlist: View: Get Complete HCI Trend Analysis ➞ | |
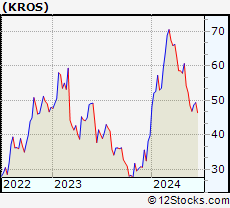 | KROS Keros Therapeutics, Inc. |
| Sector: Health Care | |
| SubSector: Biotechnology | |
| MarketCap: 17887 Millions | |
| Recent Price: 52.28 Smart Investing & Trading Score: 0 | |
| Day Percent Change: -3.17% Day Change: -1.71 | |
| Week Change: -3.67% Year-to-date Change: 31.2% | |
| KROS Links: Profile News Message Board | |
| Charts:- Daily , Weekly | |
| Add KROS to Watchlist: View: Get Complete KROS Trend Analysis ➞ | |
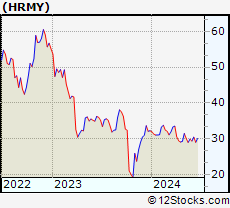 | HRMY Harmony Biosciences Holdings, Inc. |
| Sector: Health Care | |
| SubSector: Biotechnology | |
| MarketCap: 24487 Millions | |
| Recent Price: 29.03 Smart Investing & Trading Score: 10 | |
| Day Percent Change: -0.96% Day Change: -0.28 | |
| Week Change: -3.68% Year-to-date Change: -10.1% | |
| HRMY Links: Profile News Message Board | |
| Charts:- Daily , Weekly | |
| Add HRMY to Watchlist: View: Get Complete HRMY Trend Analysis ➞ | |
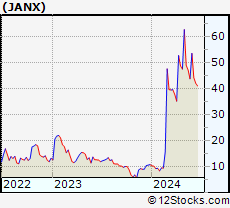 | JANX Janux Therapeutics, Inc. |
| Sector: Health Care | |
| SubSector: Biotechnology | |
| MarketCap: 496 Millions | |
| Recent Price: 47.10 Smart Investing & Trading Score: 23 | |
| Day Percent Change: -0.86% Day Change: -0.41 | |
| Week Change: -3.72% Year-to-date Change: 338.3% | |
| JANX Links: Profile News Message Board | |
| Charts:- Daily , Weekly | |
| Add JANX to Watchlist: View: Get Complete JANX Trend Analysis ➞ | |
| Too many stocks? View smallcap stocks filtered by marketcap & sector |
| Marketcap: All SmallCap Stocks (default-no microcap), Large, Mid-Range, Small & MicroCap |
| Sector: Tech, Finance, Energy, Staples, Retail, Industrial, Materials, Utilities & Medical |
|
Best Stocks Today 12Stocks.com |
© 2024 12Stocks.com Terms & Conditions Privacy Contact Us
All Information Provided Only For Education And Not To Be Used For Investing or Trading. See Terms & Conditions


One More Thing ... Get Best Stocks Delivered Daily!
Never Ever Miss A Move With Our Top Ten Stocks Lists
Find Best Stocks In Any Market - Bull or Bear Market
Take A Peek At Our Top Ten Stocks Lists: Daily, Weekly, Year-to-Date & Top Trends
Find Best Stocks In Any Market - Bull or Bear Market
Take A Peek At Our Top Ten Stocks Lists: Daily, Weekly, Year-to-Date & Top Trends
Smallcap Stocks With Best Up Trends [0-bearish to 100-bullish]: CommScope Holding[100], Coeur Mining[100], Hecla Mining[100], MicroStrategy [100], Enovix [100], Rayonier Advanced[100], Nurix [100], Energy Fuels[100], NovaGold Resources[100], Piedmont Lithium[100], Wave Life[100]
Best Smallcap Stocks Year-to-Date:
CareMax [495.88%], Bakkt [413.9%], Janux [338.34%], Viking [260.02%], Alpine Immune[241.23%], Longboard [238.63%], Avidity Biosciences[226.33%], Super Micro[212.35%], Arcutis Bio[184.83%], Sweetgreen [180.97%], Novavax [171.04%] Best Smallcap Stocks This Week:
Vaxxinity [58.82%], Novavax [46.51%], Vicarious Surgical[45.62%], Harrow Health[44.48%], ProKidney [44.31%], Workhorse Group[36.06%], Maxeon Solar[35.94%], Fossil Group[35.44%], Humacyte [34.68%], MicroStrategy [34.23%], Cadiz [33.48%] Best Smallcap Stocks Daily:
Vaxxinity [45.95%], Presto Automation[31.90%], Vicarious Surgical[27.93%], Orchestra BioMed[12.77%], CommScope Holding[11.86%], Coeur Mining[11.57%], Hecla Mining[11.11%], MicroStrategy [10.04%], Tenaya [9.65%], Bakkt [9.25%], Enovix [9.25%]