
 Login Sign Up


| |||||
 |  | ||||

| 12Stocks.com Market Intelligence |
Best SmallCap Stocks
|
| In a hurry? Small Cap Stock Lists: Performance Trends Table, Stock Charts
Sort Small Cap stocks: Daily, Weekly, Year-to-Date, Market Cap & Trends. Filter Small Cap stocks list by sector: Show all, Tech, Finance, Energy, Staples, Retail, Industrial, Materials, Utilities and HealthCare Filter Small Cap stocks list by size: All Large Medium Small and MicroCap |
| 12Stocks.com Small Cap Stocks Performances & Trends Daily | |||||||||
|
|  The overall Smart Investing & Trading Score is 76 (0-bearish to 100-bullish) which puts Small Cap index in short term neutral to bullish trend. The Smart Investing & Trading Score from previous trading session is 90 and hence a deterioration of trend.
| ||||||||
Here are the Smart Investing & Trading Scores of the most requested small cap stocks at 12Stocks.com (click stock name for detailed review):
|


| 12Stocks.com: Investing in Smallcap Index with Stocks | |
|
The following table helps investors and traders sort through current performance and trends (as measured by Smart Investing & Trading Score) of various
stocks in the Smallcap Index. Quick View: Move mouse or cursor over stock symbol (ticker) to view short-term technical chart and over stock name to view long term chart. Click on  to add stock symbol to your watchlist and to add stock symbol to your watchlist and  to view watchlist. Click on any ticker or stock name for detailed market intelligence report for that stock. to view watchlist. Click on any ticker or stock name for detailed market intelligence report for that stock. |
12Stocks.com Performance of Stocks in Smallcap Index
| Ticker | Stock Name | Watchlist | Category | Recent Price | Smart Investing & Trading Score | Change % | Weekly Change% |
| SAFE | Safehold |   | Financials | 20.69 | 88 | 1.47% | 7.62% |
| RXT | Rackspace | | Technology | 2.12 | 83 | -1.40% | 7.61% |
| OB | Outbrain | | Services & Goods | 4.84 | 100 | 3.20% | 7.56% |
| SGHC | Super Group | | Services & Goods | 3.60 | 100 | 2.86% | 7.46% |
| FFIC | Flushing Financial | | Financials | 13.27 | 100 | 2.47% | 7.45% |
| BMBL | Bumble | | Technology | 12.30 | 95 | 1.40% | 7.42% |
| BV | BrightView | | Industrials | 13.50 | 95 | 0.30% | 7.40% |
| SGH | SMART Global | | Technology | 20.24 | 64 | 1.96% | 7.37% |
| EGAN | eGain | | Technology | 6.21 | 65 | 1.55% | 7.34% |
| TSE | Trinseo S.A | | Materials | 3.53 | 67 | 3.22% | 7.29% |
| AMN | AMN Healthcare | | Industrials | 58.68 | 68 | -0.64% | 7.26% |
| ABG | Asbury Automotive | | Services & Goods | 241.13 | 75 | -1.13% | 7.25% |
| PRLD | Prelude | | Health Care | 4.00 | 39 | -6.54% | 7.24% |
| GPOR | Gulfport Energy | | Energy | 158.37 | 75 | 2.01% | 7.22% |
| GLUE | Monte Rosa | | Health Care | 5.20 | 30 | -0.38% | 7.22% |
| NTLA | Intellia | | Health Care | 26.22 | 57 | 0.19% | 7.20% |
| RYAM | Rayonier Advanced | | Materials | 4.92 | 100 | 8.61% | 7.19% |
| ONEW | OneWater Marine | | Services & Goods | 26.06 | 55 | 0.70% | 7.15% |
| NTGR | NETGEAR | | Technology | 12.90 | 42 | -1.23% | 7.14% |
| UONEK | Urban One | | Services & Goods | 1.80 | 62 | -1.10% | 7.14% |
| FTCI | FTC Solar | | Technology | 0.50 | 47 | 2.80% | 7.13% |
| KIND | Nextdoor | | Services & Goods | 2.41 | 68 | 0.42% | 7.11% |
| RLGT | Radiant Logistics | | Transports | 5.44 | 74 | 2.45% | 7.09% |
| ANAB | AnaptysBio | | Health Care | 25.07 | 50 | -1.57% | 7.09% |
| CRNX | Crinetics | | Health Care | 51.40 | 95 | -0.98% | 7.08% |


| Too many stocks? View smallcap stocks filtered by marketcap & sector |
| Marketcap: All SmallCap Stocks (default-no microcap), Large, Mid-Range, Small |
| Smallcap Sector: Tech, Finance, Energy, Staples, Retail, Industrial, Materials, & Medical |
|
Get the most comprehensive stock market coverage daily at 12Stocks.com ➞ Best Stocks Today ➞ Best Stocks Weekly ➞ Best Stocks Year-to-Date ➞ Best Stocks Trends ➞  Best Stocks Today 12Stocks.com Best Nasdaq Stocks ➞ Best S&P 500 Stocks ➞ Best Tech Stocks ➞ Best Biotech Stocks ➞ |
| Detailed Overview of SmallCap Stocks |
| SmallCap Technical Overview, Leaders & Laggards, Top SmallCap ETF Funds & Detailed SmallCap Stocks List, Charts, Trends & More |
| Smallcap: Technical Analysis, Trends & YTD Performance | |
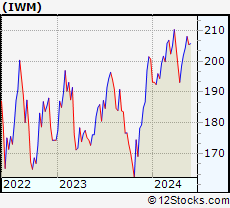
| SmallCap segment as represented by
IWM, an exchange-traded fund [ETF], holds basket of thousands of smallcap stocks from across all major sectors of the US stock market. The smallcap index (contains stocks like Riverbed & Sotheby's) is up by 3.67% and is currently underperforming the overall market by -6.9% year-to-date. Below is a quick view of technical charts and trends: | |
 IWM Weekly Chart |
|
| Long Term Trend: Very Good | |
| Medium Term Trend: Very Good | |
 IWM Daily Chart |
|
| Short Term Trend: Good | |
| Overall Trend Score: 76 | |
| YTD Performance: 3.67% | |
| **Trend Scores & Views Are Only For Educational Purposes And Not For Investing | |
| 12Stocks.com: Top Performing Small Cap Index Stocks | ||||||||||||||||||||||||||||||||||||||||||||||||
 The top performing Small Cap Index stocks year to date are
Now, more recently, over last week, the top performing Small Cap Index stocks on the move are


|
||||||||||||||||||||||||||||||||||||||||||||||||
| 12Stocks.com: Investing in Smallcap Index using Exchange Traded Funds | |
|
The following table shows list of key exchange traded funds (ETF) that
help investors track Smallcap index. The following list also includes leveraged ETF funds that track twice or thrice the daily returns of Smallcap indices. Short or inverse ETF funds move in the opposite direction to the index they track and are useful during market pullbacks or during bear markets. Quick View: Move mouse or cursor over ETF symbol (ticker) to view short-term technical chart and over ETF name to view long term chart. Click on ticker or stock name for detailed view. Click on to add stock symbol to your watchlist and to view watchlist. |
12Stocks.com List of ETFs that track Smallcap Index
| Ticker | ETF Name | Watchlist | Recent Price | Smart Investing & Trading Score | Change % | Week % | Year-to-date % |
| IWM | iShares Russell 2000 | | 208.08 | 76 | 0.07 | 1.85 | 3.67% |
| VTWO | Vanguard Russell 2000 ETF | | 84.11 | 71 | 0.00 | 1.8 | 3.71% |
| IJR | iShares Core S&P Small-Cap | | 110.39 | 68 | -0.22 | 1.29 | 1.98% |
| IWN | iShares Russell 2000 Value | | 158.71 | 76 | -0.07 | 1.61 | 2.18% |
| IWO | iShares Russell 2000 Growth | | 265.15 | 63 | -0.75 | 2.01 | 5.13% |
| IJS | iShares S&P Small-Cap 600 Value | | 101.87 | 76 | -0.15 | 1.34 | -1.16% |
| IJT | iShares S&P Small-Cap 600 Growth | | 131.34 | 71 | 0.04 | 1.14 | 4.95% |
| XSLV | PowerShares S&P SmallCap Low Volatil ETF | | 44.48 | 83 | -0.01 | 0.55 | 0.74% |
| SAA | ProShares Ultra SmallCap600 | | 24.90 | 71 | 0.50 | 2.28 | -0.18% |
| SMLV | SPDR SSGA US Small Cap Low Volatil ETF | | 113.28 | 95 | 0.43 | 1.85 | 0.68% |
| SDD | ProShares UltraShort SmallCap600 | | 17.84 | 35 | 0.96 | -2.41 | -3.19% |
| SBB | ProShares Short SmallCap600 | | 15.77 | 25 | 0.41 | -1.14 | -0.98% |
| 12Stocks.com: Charts, Trends, Fundamental Data and Performances of SmallCap Stocks | |
|
We now take in-depth look at all SmallCap stocks including charts, multi-period performances and overall trends (as measured by Smart Investing & Trading Score). One can sort SmallCap stocks (click link to choose) by Daily, Weekly and by Year-to-Date performances. Also, one can sort by size of the company or by market capitalization. |
| Select Your Default Chart Type: | |||||
| |||||
| Click on stock symbol or name for detailed view. Click on to add stock symbol to your watchlist and to view watchlist. Quick View: Move mouse or cursor over "Daily" to quickly view daily technical stock chart and over "Weekly" to view weekly technical stock chart. | |||||

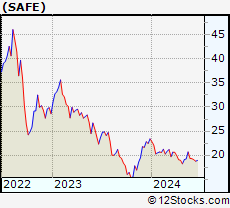 | SAFE Safehold Inc. |
| Sector: Financials | |
| SubSector: REIT - Diversified | |
| MarketCap: 2994.63 Millions | |
| Recent Price: 20.69 Smart Investing & Trading Score: 88 | |
| Day Percent Change: 1.47% Day Change: 0.30 | |
| Week Change: 7.62% Year-to-date Change: -11.6% | |
| SAFE Links: Profile News Message Board | |
| Charts:- Daily , Weekly | |
| Add SAFE to Watchlist: View: Get Complete SAFE Trend Analysis ➞ | |
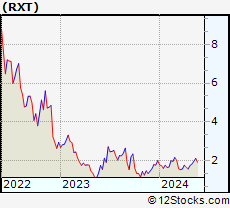 | RXT Rackspace Technology, Inc. |
| Sector: Technology | |
| SubSector: Software Infrastructure | |
| MarketCap: 40287 Millions | |
| Recent Price: 2.12 Smart Investing & Trading Score: 83 | |
| Day Percent Change: -1.40% Day Change: -0.03 | |
| Week Change: 7.61% Year-to-date Change: 5.7% | |
| RXT Links: Profile News Message Board | |
| Charts:- Daily , Weekly | |
| Add RXT to Watchlist: View: Get Complete RXT Trend Analysis ➞ | |
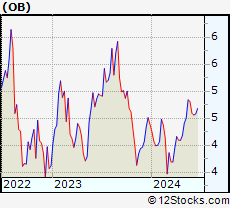 | OB Outbrain Inc. |
| Sector: Services & Goods | |
| SubSector: Internet Content & Information | |
| MarketCap: 250 Millions | |
| Recent Price: 4.84 Smart Investing & Trading Score: 100 | |
| Day Percent Change: 3.20% Day Change: 0.15 | |
| Week Change: 7.56% Year-to-date Change: 10.5% | |
| OB Links: Profile News Message Board | |
| Charts:- Daily , Weekly | |
| Add OB to Watchlist: View: Get Complete OB Trend Analysis ➞ | |
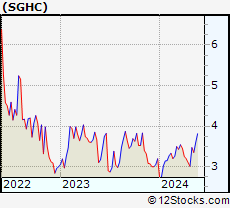 | SGHC Super Group (SGHC) Limited |
| Sector: Services & Goods | |
| SubSector: Gambling | |
| MarketCap: 1390 Millions | |
| Recent Price: 3.60 Smart Investing & Trading Score: 100 | |
| Day Percent Change: 2.86% Day Change: 0.10 | |
| Week Change: 7.46% Year-to-date Change: 12.7% | |
| SGHC Links: Profile News Message Board | |
| Charts:- Daily , Weekly | |
| Add SGHC to Watchlist: View: Get Complete SGHC Trend Analysis ➞ | |
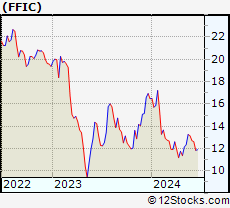 | FFIC Flushing Financial Corporation |
| Sector: Financials | |
| SubSector: Savings & Loans | |
| MarketCap: 336.43 Millions | |
| Recent Price: 13.27 Smart Investing & Trading Score: 100 | |
| Day Percent Change: 2.47% Day Change: 0.32 | |
| Week Change: 7.45% Year-to-date Change: -19.5% | |
| FFIC Links: Profile News Message Board | |
| Charts:- Daily , Weekly | |
| Add FFIC to Watchlist: View: Get Complete FFIC Trend Analysis ➞ | |
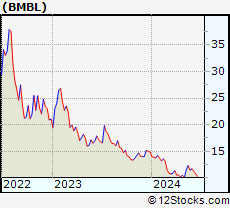 | BMBL Bumble Inc. |
| Sector: Technology | |
| SubSector: Software - Application | |
| MarketCap: 2290 Millions | |
| Recent Price: 12.30 Smart Investing & Trading Score: 95 | |
| Day Percent Change: 1.40% Day Change: 0.17 | |
| Week Change: 7.42% Year-to-date Change: -17.2% | |
| BMBL Links: Profile News Message Board | |
| Charts:- Daily , Weekly | |
| Add BMBL to Watchlist: View: Get Complete BMBL Trend Analysis ➞ | |
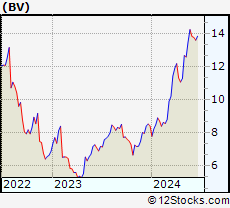 | BV BrightView Holdings, Inc. |
| Sector: Industrials | |
| SubSector: General Contractors | |
| MarketCap: 973.763 Millions | |
| Recent Price: 13.50 Smart Investing & Trading Score: 95 | |
| Day Percent Change: 0.30% Day Change: 0.04 | |
| Week Change: 7.4% Year-to-date Change: 60.3% | |
| BV Links: Profile News Message Board | |
| Charts:- Daily , Weekly | |
| Add BV to Watchlist: View: Get Complete BV Trend Analysis ➞ | |
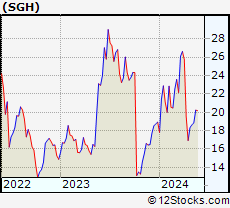 | SGH SMART Global Holdings, Inc. |
| Sector: Technology | |
| SubSector: Semiconductor- Memory Chips | |
| MarketCap: 657.8 Millions | |
| Recent Price: 20.24 Smart Investing & Trading Score: 64 | |
| Day Percent Change: 1.96% Day Change: 0.39 | |
| Week Change: 7.37% Year-to-date Change: 6.9% | |
| SGH Links: Profile News Message Board | |
| Charts:- Daily , Weekly | |
| Add SGH to Watchlist: View: Get Complete SGH Trend Analysis ➞ | |
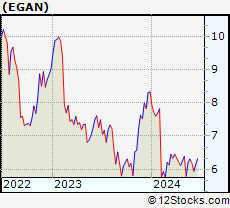 | EGAN eGain Corporation |
| Sector: Technology | |
| SubSector: Business Software & Services | |
| MarketCap: 201.458 Millions | |
| Recent Price: 6.21 Smart Investing & Trading Score: 65 | |
| Day Percent Change: 1.55% Day Change: 0.09 | |
| Week Change: 7.34% Year-to-date Change: -25.4% | |
| EGAN Links: Profile News Message Board | |
| Charts:- Daily , Weekly | |
| Add EGAN to Watchlist: View: Get Complete EGAN Trend Analysis ➞ | |
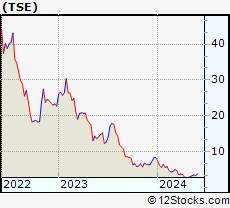 | TSE Trinseo S.A. |
| Sector: Materials | |
| SubSector: Specialty Chemicals | |
| MarketCap: 790.057 Millions | |
| Recent Price: 3.53 Smart Investing & Trading Score: 67 | |
| Day Percent Change: 3.22% Day Change: 0.11 | |
| Week Change: 7.29% Year-to-date Change: -57.8% | |
| TSE Links: Profile News Message Board | |
| Charts:- Daily , Weekly | |
| Add TSE to Watchlist: View: Get Complete TSE Trend Analysis ➞ | |
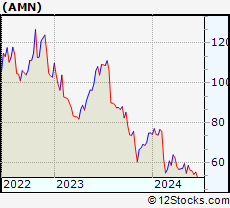 | AMN AMN Healthcare Services, Inc. |
| Sector: Industrials | |
| SubSector: General Building Materials | |
| MarketCap: 3064.03 Millions | |
| Recent Price: 58.68 Smart Investing & Trading Score: 68 | |
| Day Percent Change: -0.64% Day Change: -0.38 | |
| Week Change: 7.26% Year-to-date Change: -21.6% | |
| AMN Links: Profile News Message Board | |
| Charts:- Daily , Weekly | |
| Add AMN to Watchlist: View: Get Complete AMN Trend Analysis ➞ | |
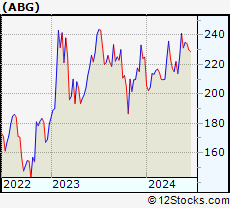 | ABG Asbury Automotive Group, Inc. |
| Sector: Services & Goods | |
| SubSector: Auto Dealerships | |
| MarketCap: 1203.21 Millions | |
| Recent Price: 241.13 Smart Investing & Trading Score: 75 | |
| Day Percent Change: -1.13% Day Change: -2.75 | |
| Week Change: 7.25% Year-to-date Change: 7.2% | |
| ABG Links: Profile News Message Board | |
| Charts:- Daily , Weekly | |
| Add ABG to Watchlist: View: Get Complete ABG Trend Analysis ➞ | |
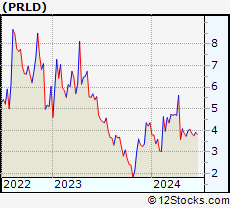 | PRLD Prelude Therapeutics Incorporated |
| Sector: Health Care | |
| SubSector: Biotechnology | |
| MarketCap: 26087 Millions | |
| Recent Price: 4.00 Smart Investing & Trading Score: 39 | |
| Day Percent Change: -6.54% Day Change: -0.28 | |
| Week Change: 7.24% Year-to-date Change: -8.1% | |
| PRLD Links: Profile News Message Board | |
| Charts:- Daily , Weekly | |
| Add PRLD to Watchlist: View: Get Complete PRLD Trend Analysis ➞ | |
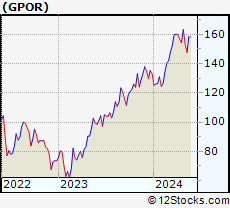 | GPOR Gulfport Energy Corporation |
| Sector: Energy | |
| SubSector: Oil & Gas E&P | |
| MarketCap: 1890 Millions | |
| Recent Price: 158.37 Smart Investing & Trading Score: 75 | |
| Day Percent Change: 2.01% Day Change: 3.12 | |
| Week Change: 7.22% Year-to-date Change: 18.9% | |
| GPOR Links: Profile News Message Board | |
| Charts:- Daily , Weekly | |
| Add GPOR to Watchlist: View: Get Complete GPOR Trend Analysis ➞ | |
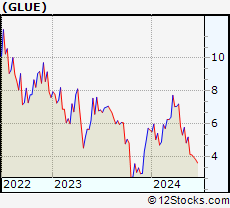 | GLUE Monte Rosa Therapeutics, Inc. |
| Sector: Health Care | |
| SubSector: Biotechnology | |
| MarketCap: 346 Millions | |
| Recent Price: 5.20 Smart Investing & Trading Score: 30 | |
| Day Percent Change: -0.38% Day Change: -0.02 | |
| Week Change: 7.22% Year-to-date Change: -7.6% | |
| GLUE Links: Profile News Message Board | |
| Charts:- Daily , Weekly | |
| Add GLUE to Watchlist: View: Get Complete GLUE Trend Analysis ➞ | |
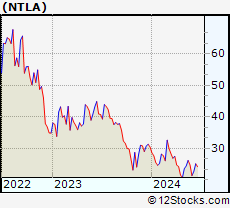 | NTLA Intellia Therapeutics, Inc. |
| Sector: Health Care | |
| SubSector: Biotechnology | |
| MarketCap: 707.185 Millions | |
| Recent Price: 26.22 Smart Investing & Trading Score: 57 | |
| Day Percent Change: 0.19% Day Change: 0.05 | |
| Week Change: 7.2% Year-to-date Change: -14.0% | |
| NTLA Links: Profile News Message Board | |
| Charts:- Daily , Weekly | |
| Add NTLA to Watchlist: View: Get Complete NTLA Trend Analysis ➞ | |
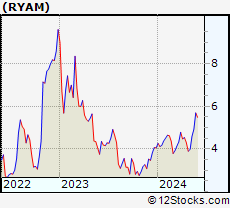 | RYAM Rayonier Advanced Materials Inc. |
| Sector: Materials | |
| SubSector: Chemicals - Major Diversified | |
| MarketCap: 116.736 Millions | |
| Recent Price: 4.92 Smart Investing & Trading Score: 100 | |
| Day Percent Change: 8.61% Day Change: 0.39 | |
| Week Change: 7.19% Year-to-date Change: 21.5% | |
| RYAM Links: Profile News Message Board | |
| Charts:- Daily , Weekly | |
| Add RYAM to Watchlist: View: Get Complete RYAM Trend Analysis ➞ | |
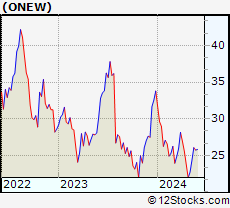 | ONEW OneWater Marine Inc. |
| Sector: Services & Goods | |
| SubSector: Recreational Vehicles | |
| MarketCap: 42027 Millions | |
| Recent Price: 26.06 Smart Investing & Trading Score: 55 | |
| Day Percent Change: 0.70% Day Change: 0.18 | |
| Week Change: 7.15% Year-to-date Change: -22.9% | |
| ONEW Links: Profile News Message Board | |
| Charts:- Daily , Weekly | |
| Add ONEW to Watchlist: View: Get Complete ONEW Trend Analysis ➞ | |
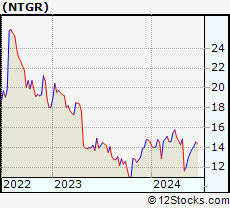 | NTGR NETGEAR, Inc. |
| Sector: Technology | |
| SubSector: Communication Equipment | |
| MarketCap: 558.839 Millions | |
| Recent Price: 12.90 Smart Investing & Trading Score: 42 | |
| Day Percent Change: -1.23% Day Change: -0.16 | |
| Week Change: 7.14% Year-to-date Change: -11.5% | |
| NTGR Links: Profile News Message Board | |
| Charts:- Daily , Weekly | |
| Add NTGR to Watchlist: View: Get Complete NTGR Trend Analysis ➞ | |
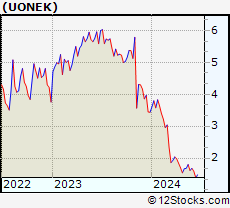 | UONEK Urban One, Inc. |
| Sector: Services & Goods | |
| SubSector: Broadcasting - Radio | |
| MarketCap: 601.795 Millions | |
| Recent Price: 1.80 Smart Investing & Trading Score: 62 | |
| Day Percent Change: -1.10% Day Change: -0.02 | |
| Week Change: 7.14% Year-to-date Change: -47.7% | |
| UONEK Links: Profile News Message Board | |
| Charts:- Daily , Weekly | |
| Add UONEK to Watchlist: View: Get Complete UONEK Trend Analysis ➞ | |
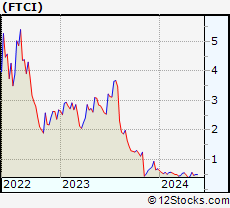 | FTCI FTC Solar, Inc. |
| Sector: Technology | |
| SubSector: Solar | |
| MarketCap: 345 Millions | |
| Recent Price: 0.50 Smart Investing & Trading Score: 47 | |
| Day Percent Change: 2.80% Day Change: 0.01 | |
| Week Change: 7.13% Year-to-date Change: -27.7% | |
| FTCI Links: Profile News Message Board | |
| Charts:- Daily , Weekly | |
| Add FTCI to Watchlist: View: Get Complete FTCI Trend Analysis ➞ | |
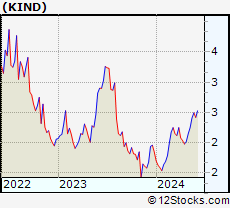 | KIND Nextdoor Holdings, Inc. |
| Sector: Services & Goods | |
| SubSector: Internet Content & Information | |
| MarketCap: 1170 Millions | |
| Recent Price: 2.41 Smart Investing & Trading Score: 68 | |
| Day Percent Change: 0.42% Day Change: 0.01 | |
| Week Change: 7.11% Year-to-date Change: 30.3% | |
| KIND Links: Profile News Message Board | |
| Charts:- Daily , Weekly | |
| Add KIND to Watchlist: View: Get Complete KIND Trend Analysis ➞ | |
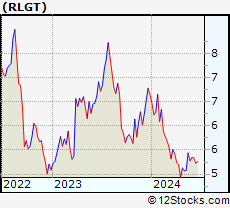 | RLGT Radiant Logistics, Inc. |
| Sector: Transports | |
| SubSector: Air Delivery & Freight Services | |
| MarketCap: 180.868 Millions | |
| Recent Price: 5.44 Smart Investing & Trading Score: 74 | |
| Day Percent Change: 2.45% Day Change: 0.13 | |
| Week Change: 7.09% Year-to-date Change: -18.1% | |
| RLGT Links: Profile News Message Board | |
| Charts:- Daily , Weekly | |
| Add RLGT to Watchlist: View: Get Complete RLGT Trend Analysis ➞ | |
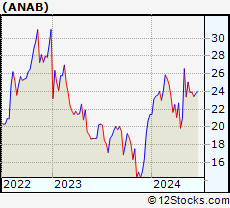 | ANAB AnaptysBio, Inc. |
| Sector: Health Care | |
| SubSector: Biotechnology | |
| MarketCap: 405.985 Millions | |
| Recent Price: 25.07 Smart Investing & Trading Score: 50 | |
| Day Percent Change: -1.57% Day Change: -0.40 | |
| Week Change: 7.09% Year-to-date Change: 17.0% | |
| ANAB Links: Profile News Message Board | |
| Charts:- Daily , Weekly | |
| Add ANAB to Watchlist: View: Get Complete ANAB Trend Analysis ➞ | |
 | CRNX Crinetics Pharmaceuticals, Inc. |
| Sector: Health Care | |
| SubSector: Biotechnology | |
| MarketCap: 381.085 Millions | |
| Recent Price: 51.40 Smart Investing & Trading Score: 95 | |
| Day Percent Change: -0.98% Day Change: -0.51 | |
| Week Change: 7.08% Year-to-date Change: 44.5% | |
| CRNX Links: Profile News Message Board | |
| Charts:- Daily , Weekly | |
| Add CRNX to Watchlist: View: Get Complete CRNX Trend Analysis ➞ | |
| Too many stocks? View smallcap stocks filtered by marketcap & sector |
| Marketcap: All SmallCap Stocks (default-no microcap), Large, Mid-Range, Small & MicroCap |
| Sector: Tech, Finance, Energy, Staples, Retail, Industrial, Materials, Utilities & Medical |
|
Best Stocks Today 12Stocks.com |
© 2024 12Stocks.com Terms & Conditions Privacy Contact Us
All Information Provided Only For Education And Not To Be Used For Investing or Trading. See Terms & Conditions


One More Thing ... Get Best Stocks Delivered Daily!
Never Ever Miss A Move With Our Top Ten Stocks Lists
Find Best Stocks In Any Market - Bull or Bear Market
Take A Peek At Our Top Ten Stocks Lists: Daily, Weekly, Year-to-Date & Top Trends
Find Best Stocks In Any Market - Bull or Bear Market
Take A Peek At Our Top Ten Stocks Lists: Daily, Weekly, Year-to-Date & Top Trends
Smallcap Stocks With Best Up Trends [0-bearish to 100-bullish]: CommScope Holding[100], Coeur Mining[100], Hecla Mining[100], MicroStrategy [100], Enovix [100], Rayonier Advanced[100], Nurix [100], Energy Fuels[100], NovaGold Resources[100], Piedmont Lithium[100], Wave Life[100]
Best Smallcap Stocks Year-to-Date:
CareMax [495.88%], Bakkt [413.9%], Janux [338.34%], Viking [260.02%], Alpine Immune[241.23%], Longboard [238.63%], Avidity Biosciences[226.33%], Super Micro[212.35%], Arcutis Bio[184.83%], Sweetgreen [180.97%], Novavax [171.04%] Best Smallcap Stocks This Week:
Vaxxinity [58.82%], Novavax [46.51%], Vicarious Surgical[45.62%], Harrow Health[44.48%], ProKidney [44.31%], Workhorse Group[36.06%], Maxeon Solar[35.94%], Fossil Group[35.44%], Humacyte [34.68%], MicroStrategy [34.23%], Cadiz [33.48%] Best Smallcap Stocks Daily:
Vaxxinity [45.95%], Presto Automation[31.90%], Vicarious Surgical[27.93%], Orchestra BioMed[12.77%], CommScope Holding[11.86%], Coeur Mining[11.57%], Hecla Mining[11.11%], MicroStrategy [10.04%], Tenaya [9.65%], Bakkt [9.25%], Enovix [9.25%]