
 Login Sign Up


| |||||
 |  | ||||

| 12Stocks.com Market Intelligence |
Best SmallCap Stocks
|
| In a hurry? Small Cap Stock Lists: Performance Trends Table, Stock Charts
Sort Small Cap stocks: Daily, Weekly, Year-to-Date, Market Cap & Trends. Filter Small Cap stocks list by sector: Show all, Tech, Finance, Energy, Staples, Retail, Industrial, Materials, Utilities and HealthCare Filter Small Cap stocks list by size: All Large Medium Small and MicroCap |
| 12Stocks.com Small Cap Stocks Performances & Trends Daily | |||||||||
|
|  The overall Smart Investing & Trading Score is 76 (0-bearish to 100-bullish) which puts Small Cap index in short term neutral to bullish trend. The Smart Investing & Trading Score from previous trading session is 90 and hence a deterioration of trend.
| ||||||||
Here are the Smart Investing & Trading Scores of the most requested small cap stocks at 12Stocks.com (click stock name for detailed review):
|


| 12Stocks.com: Investing in Smallcap Index with Stocks | |
|
The following table helps investors and traders sort through current performance and trends (as measured by Smart Investing & Trading Score) of various
stocks in the Smallcap Index. Quick View: Move mouse or cursor over stock symbol (ticker) to view short-term technical chart and over stock name to view long term chart. Click on  to add stock symbol to your watchlist and to add stock symbol to your watchlist and  to view watchlist. Click on any ticker or stock name for detailed market intelligence report for that stock. to view watchlist. Click on any ticker or stock name for detailed market intelligence report for that stock. |
12Stocks.com Performance of Stocks in Smallcap Index
| Ticker | Stock Name | Watchlist | Category | Recent Price | Smart Investing & Trading Score | Change % | Weekly Change% |
| BYND | Beyond Meat |   | Consumer Staples | 7.19 | 32 | -0.14% | -0.62% |
| FULT | Fulton Financial | | Financials | 17.36 | 76 | -0.63% | -0.63% |
| ALE | ALLETE | | Utilities | 62.80 | 71 | -0.30% | -0.63% |
| MCRI | Monarch Casino | | Services & Goods | 67.30 | 18 | 0.39% | -0.63% |
| TRN | Trinity Industries | | Transports | 31.04 | 83 | -0.13% | -0.64% |
| CVCO | Cavco Industries | | Industrials | 374.21 | 35 | 0.65% | -0.64% |
| FDP | Fresh Del | | Consumer Staples | 24.31 | 51 | -0.69% | -0.65% |
| HP | Helmerich & Payne | | Energy | 38.49 | 30 | 0.73% | -0.67% |
| OGS | ONE Gas | | Utilities | 63.72 | 51 | -1.77% | -0.67% |
| GHC | Graham | | Services & Goods | 761.87 | 76 | -0.40% | -0.68% |
| DLTH | Duluth | | Services & Goods | 4.29 | 27 | -3.60% | -0.69% |
| FC | Franklin Covey | | Services & Goods | 38.19 | 23 | -1.85% | -0.70% |
| MYGN | Myriad Genetics | | Services & Goods | 25.29 | 83 | 2.76% | -0.71% |
| UFCS | United Fire | | Financials | 23.53 | 90 | -0.21% | -0.72% |
| ODC | Oil-Dri | | Materials | 81.66 | 90 | 2.58% | -0.72% |
| PRDO | Perdoceo Education | | Services & Goods | 23.50 | 61 | -1.30% | -0.72% |
| AFCG | AFC Gamma | | Financials | 12.24 | 68 | -0.49% | -0.73% |
| CCOI | Cogent | | Technology | 59.15 | 42 | 2.19% | -0.74% |
| ATI | Allegheny | | Industrials | 60.27 | 76 | -0.54% | -0.76% |
| SVC | Service Properties | | Financials | 5.73 | 10 | -3.37% | -0.78% |
| FLR | Fluor | | Industrials | 38.35 | 36 | 0.24% | -0.78% |
| KAR | KAR Auction | | Services & Goods | 17.60 | 58 | -2.11% | -0.79% |
| SOUN | SoundHound AI | | Technology | 5.05 | 30 | -1.17% | -0.79% |
| ETNB | 89bio | | Health Care | 8.63 | 25 | -3.79% | -0.80% |
| DDD | 3D Systems | | Technology | 3.67 | 42 | -2.39% | -0.81% |


| Too many stocks? View smallcap stocks filtered by marketcap & sector |
| Marketcap: All SmallCap Stocks (default-no microcap), Large, Mid-Range, Small |
| Smallcap Sector: Tech, Finance, Energy, Staples, Retail, Industrial, Materials, & Medical |
|
Get the most comprehensive stock market coverage daily at 12Stocks.com ➞ Best Stocks Today ➞ Best Stocks Weekly ➞ Best Stocks Year-to-Date ➞ Best Stocks Trends ➞  Best Stocks Today 12Stocks.com Best Nasdaq Stocks ➞ Best S&P 500 Stocks ➞ Best Tech Stocks ➞ Best Biotech Stocks ➞ |
| Detailed Overview of SmallCap Stocks |
| SmallCap Technical Overview, Leaders & Laggards, Top SmallCap ETF Funds & Detailed SmallCap Stocks List, Charts, Trends & More |
| Smallcap: Technical Analysis, Trends & YTD Performance | |
| SmallCap segment as represented by
IWM, an exchange-traded fund [ETF], holds basket of thousands of smallcap stocks from across all major sectors of the US stock market. The smallcap index (contains stocks like Riverbed & Sotheby's) is up by 3.67% and is currently underperforming the overall market by -6.9% year-to-date. Below is a quick view of technical charts and trends: | |
 IWM Weekly Chart |
|
| Long Term Trend: Very Good | |
| Medium Term Trend: Very Good | |
 IWM Daily Chart |
|
| Short Term Trend: Good | |
| Overall Trend Score: 76 | |
| YTD Performance: 3.67% | |
| **Trend Scores & Views Are Only For Educational Purposes And Not For Investing | |
| 12Stocks.com: Top Performing Small Cap Index Stocks | ||||||||||||||||||||||||||||||||||||||||||||||||
 The top performing Small Cap Index stocks year to date are
Now, more recently, over last week, the top performing Small Cap Index stocks on the move are


|
||||||||||||||||||||||||||||||||||||||||||||||||
| 12Stocks.com: Investing in Smallcap Index using Exchange Traded Funds | |
|
The following table shows list of key exchange traded funds (ETF) that
help investors track Smallcap index. The following list also includes leveraged ETF funds that track twice or thrice the daily returns of Smallcap indices. Short or inverse ETF funds move in the opposite direction to the index they track and are useful during market pullbacks or during bear markets. Quick View: Move mouse or cursor over ETF symbol (ticker) to view short-term technical chart and over ETF name to view long term chart. Click on ticker or stock name for detailed view. Click on to add stock symbol to your watchlist and to view watchlist. |
12Stocks.com List of ETFs that track Smallcap Index
| Ticker | ETF Name | Watchlist | Recent Price | Smart Investing & Trading Score | Change % | Week % | Year-to-date % |
| IWM | iShares Russell 2000 | | 208.08 | 76 | 0.07 | 1.85 | 3.67% |
| VTWO | Vanguard Russell 2000 ETF | | 84.11 | 71 | 0.00 | 1.8 | 3.71% |
| IJR | iShares Core S&P Small-Cap | | 110.39 | 68 | -0.22 | 1.29 | 1.98% |
| IWN | iShares Russell 2000 Value | | 158.71 | 76 | -0.07 | 1.61 | 2.18% |
| IWO | iShares Russell 2000 Growth | | 265.15 | 63 | -0.75 | 2.01 | 5.13% |
| IJS | iShares S&P Small-Cap 600 Value | | 101.87 | 76 | -0.15 | 1.34 | -1.16% |
| IJT | iShares S&P Small-Cap 600 Growth | | 131.34 | 71 | 0.04 | 1.14 | 4.95% |
| XSLV | PowerShares S&P SmallCap Low Volatil ETF | | 44.48 | 83 | -0.01 | 0.55 | 0.74% |
| SAA | ProShares Ultra SmallCap600 | | 24.90 | 71 | 0.50 | 2.28 | -0.18% |
| SMLV | SPDR SSGA US Small Cap Low Volatil ETF | | 113.28 | 95 | 0.43 | 1.85 | 0.68% |
| SDD | ProShares UltraShort SmallCap600 | | 17.84 | 35 | 0.96 | -2.41 | -3.19% |
| SBB | ProShares Short SmallCap600 | | 15.77 | 25 | 0.41 | -1.14 | -0.98% |
| 12Stocks.com: Charts, Trends, Fundamental Data and Performances of SmallCap Stocks | |
|
We now take in-depth look at all SmallCap stocks including charts, multi-period performances and overall trends (as measured by Smart Investing & Trading Score). One can sort SmallCap stocks (click link to choose) by Daily, Weekly and by Year-to-Date performances. Also, one can sort by size of the company or by market capitalization. |
| Select Your Default Chart Type: | |||||
| |||||
| Click on stock symbol or name for detailed view. Click on to add stock symbol to your watchlist and to view watchlist. Quick View: Move mouse or cursor over "Daily" to quickly view daily technical stock chart and over "Weekly" to view weekly technical stock chart. | |||||

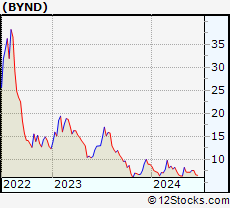 | BYND Beyond Meat, Inc. |
| Sector: Consumer Staples | |
| SubSector: Processed & Packaged Goods | |
| MarketCap: 3987.98 Millions | |
| Recent Price: 7.19 Smart Investing & Trading Score: 32 | |
| Day Percent Change: -0.14% Day Change: -0.01 | |
| Week Change: -0.62% Year-to-date Change: -19.2% | |
| BYND Links: Profile News Message Board | |
| Charts:- Daily , Weekly | |
| Add BYND to Watchlist: View: Get Complete BYND Trend Analysis ➞ | |
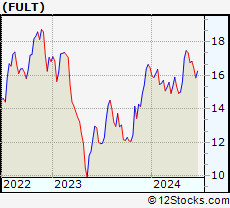 | FULT Fulton Financial Corporation |
| Sector: Financials | |
| SubSector: Regional - Northeast Banks | |
| MarketCap: 2030.89 Millions | |
| Recent Price: 17.36 Smart Investing & Trading Score: 76 | |
| Day Percent Change: -0.63% Day Change: -0.11 | |
| Week Change: -0.63% Year-to-date Change: 5.5% | |
| FULT Links: Profile News Message Board | |
| Charts:- Daily , Weekly | |
| Add FULT to Watchlist: View: Get Complete FULT Trend Analysis ➞ | |
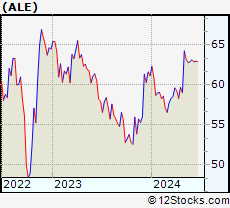 | ALE ALLETE, Inc. |
| Sector: Utilities | |
| SubSector: Diversified Utilities | |
| MarketCap: 3145.4 Millions | |
| Recent Price: 62.80 Smart Investing & Trading Score: 71 | |
| Day Percent Change: -0.30% Day Change: -0.19 | |
| Week Change: -0.63% Year-to-date Change: 2.7% | |
| ALE Links: Profile News Message Board | |
| Charts:- Daily , Weekly | |
| Add ALE to Watchlist: View: Get Complete ALE Trend Analysis ➞ | |
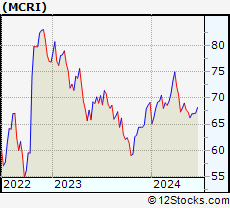 | MCRI Monarch Casino & Resort, Inc. |
| Sector: Services & Goods | |
| SubSector: Resorts & Casinos | |
| MarketCap: 352.894 Millions | |
| Recent Price: 67.30 Smart Investing & Trading Score: 18 | |
| Day Percent Change: 0.39% Day Change: 0.26 | |
| Week Change: -0.63% Year-to-date Change: -2.7% | |
| MCRI Links: Profile News Message Board | |
| Charts:- Daily , Weekly | |
| Add MCRI to Watchlist: View: Get Complete MCRI Trend Analysis ➞ | |
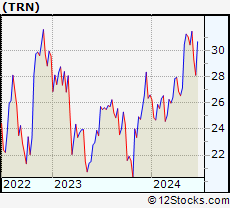 | TRN Trinity Industries, Inc. |
| Sector: Transports | |
| SubSector: Railroads | |
| MarketCap: 2058.22 Millions | |
| Recent Price: 31.04 Smart Investing & Trading Score: 83 | |
| Day Percent Change: -0.13% Day Change: -0.04 | |
| Week Change: -0.64% Year-to-date Change: 16.7% | |
| TRN Links: Profile News Message Board | |
| Charts:- Daily , Weekly | |
| Add TRN to Watchlist: View: Get Complete TRN Trend Analysis ➞ | |
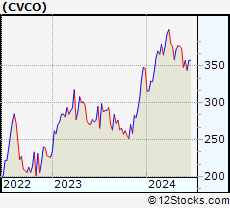 | CVCO Cavco Industries, Inc. |
| Sector: Industrials | |
| SubSector: Residential Construction | |
| MarketCap: 1375.86 Millions | |
| Recent Price: 374.21 Smart Investing & Trading Score: 35 | |
| Day Percent Change: 0.65% Day Change: 2.42 | |
| Week Change: -0.64% Year-to-date Change: 8.0% | |
| CVCO Links: Profile News Message Board | |
| Charts:- Daily , Weekly | |
| Add CVCO to Watchlist: View: Get Complete CVCO Trend Analysis ➞ | |
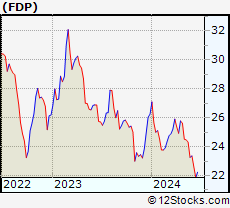 | FDP Fresh Del Monte Produce Inc. |
| Sector: Consumer Staples | |
| SubSector: Farm Products | |
| MarketCap: 1862.37 Millions | |
| Recent Price: 24.31 Smart Investing & Trading Score: 51 | |
| Day Percent Change: -0.69% Day Change: -0.17 | |
| Week Change: -0.65% Year-to-date Change: -7.4% | |
| FDP Links: Profile News Message Board | |
| Charts:- Daily , Weekly | |
| Add FDP to Watchlist: View: Get Complete FDP Trend Analysis ➞ | |
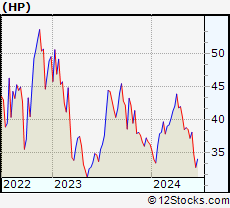 | HP Helmerich & Payne, Inc. |
| Sector: Energy | |
| SubSector: Oil & Gas Drilling & Exploration | |
| MarketCap: 1796.39 Millions | |
| Recent Price: 38.49 Smart Investing & Trading Score: 30 | |
| Day Percent Change: 0.73% Day Change: 0.28 | |
| Week Change: -0.67% Year-to-date Change: 6.3% | |
| HP Links: Profile News Message Board | |
| Charts:- Daily , Weekly | |
| Add HP to Watchlist: View: Get Complete HP Trend Analysis ➞ | |
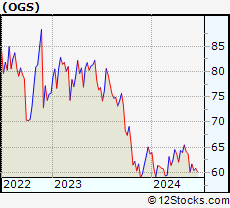 | OGS ONE Gas, Inc. |
| Sector: Utilities | |
| SubSector: Gas Utilities | |
| MarketCap: 4051.17 Millions | |
| Recent Price: 63.72 Smart Investing & Trading Score: 51 | |
| Day Percent Change: -1.77% Day Change: -1.15 | |
| Week Change: -0.67% Year-to-date Change: 0.0% | |
| OGS Links: Profile News Message Board | |
| Charts:- Daily , Weekly | |
| Add OGS to Watchlist: View: Get Complete OGS Trend Analysis ➞ | |
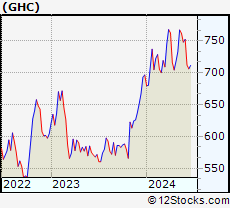 | GHC Graham Holdings Company |
| Sector: Services & Goods | |
| SubSector: Education & Training Services | |
| MarketCap: 1871.06 Millions | |
| Recent Price: 761.87 Smart Investing & Trading Score: 76 | |
| Day Percent Change: -0.40% Day Change: -3.07 | |
| Week Change: -0.68% Year-to-date Change: 9.4% | |
| GHC Links: Profile News Message Board | |
| Charts:- Daily , Weekly | |
| Add GHC to Watchlist: View: Get Complete GHC Trend Analysis ➞ | |
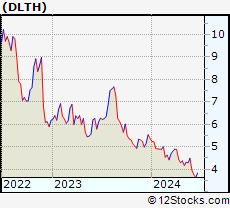 | DLTH Duluth Holdings Inc. |
| Sector: Services & Goods | |
| SubSector: Apparel Stores | |
| MarketCap: 180.008 Millions | |
| Recent Price: 4.29 Smart Investing & Trading Score: 27 | |
| Day Percent Change: -3.60% Day Change: -0.16 | |
| Week Change: -0.69% Year-to-date Change: -20.3% | |
| DLTH Links: Profile News Message Board | |
| Charts:- Daily , Weekly | |
| Add DLTH to Watchlist: View: Get Complete DLTH Trend Analysis ➞ | |
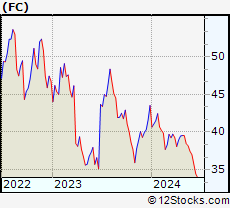 | FC Franklin Covey Co. |
| Sector: Services & Goods | |
| SubSector: Education & Training Services | |
| MarketCap: 243.306 Millions | |
| Recent Price: 38.19 Smart Investing & Trading Score: 23 | |
| Day Percent Change: -1.85% Day Change: -0.72 | |
| Week Change: -0.7% Year-to-date Change: -12.3% | |
| FC Links: Profile News Message Board | |
| Charts:- Daily , Weekly | |
| Add FC to Watchlist: View: Get Complete FC Trend Analysis ➞ | |
 | MYGN Myriad Genetics, Inc. |
| Sector: Services & Goods | |
| SubSector: Research Services | |
| MarketCap: 1051.94 Millions | |
| Recent Price: 25.29 Smart Investing & Trading Score: 83 | |
| Day Percent Change: 2.76% Day Change: 0.68 | |
| Week Change: -0.71% Year-to-date Change: 32.1% | |
| MYGN Links: Profile News Message Board | |
| Charts:- Daily , Weekly | |
| Add MYGN to Watchlist: View: Get Complete MYGN Trend Analysis ➞ | |
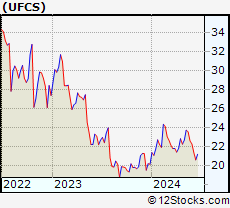 | UFCS United Fire Group, Inc. |
| Sector: Financials | |
| SubSector: Property & Casualty Insurance | |
| MarketCap: 862.812 Millions | |
| Recent Price: 23.53 Smart Investing & Trading Score: 90 | |
| Day Percent Change: -0.21% Day Change: -0.05 | |
| Week Change: -0.72% Year-to-date Change: 17.0% | |
| UFCS Links: Profile News Message Board | |
| Charts:- Daily , Weekly | |
| Add UFCS to Watchlist: View: Get Complete UFCS Trend Analysis ➞ | |
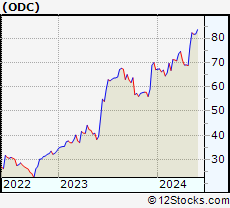 | ODC Oil-Dri Corporation of America |
| Sector: Materials | |
| SubSector: Specialty Chemicals | |
| MarketCap: 249.857 Millions | |
| Recent Price: 81.66 Smart Investing & Trading Score: 90 | |
| Day Percent Change: 2.58% Day Change: 2.05 | |
| Week Change: -0.72% Year-to-date Change: 21.7% | |
| ODC Links: Profile News Message Board | |
| Charts:- Daily , Weekly | |
| Add ODC to Watchlist: View: Get Complete ODC Trend Analysis ➞ | |
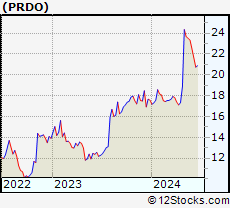 | PRDO Perdoceo Education Corporation |
| Sector: Services & Goods | |
| SubSector: Education & Training Services | |
| MarketCap: 631.006 Millions | |
| Recent Price: 23.50 Smart Investing & Trading Score: 61 | |
| Day Percent Change: -1.30% Day Change: -0.31 | |
| Week Change: -0.72% Year-to-date Change: 33.8% | |
| PRDO Links: Profile News Message Board | |
| Charts:- Daily , Weekly | |
| Add PRDO to Watchlist: View: Get Complete PRDO Trend Analysis ➞ | |
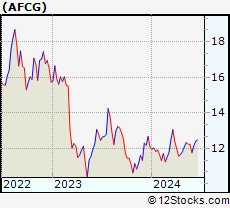 | AFCG AFC Gamma, Inc. |
| Sector: Financials | |
| SubSector: REIT - Specialty | |
| MarketCap: 269 Millions | |
| Recent Price: 12.24 Smart Investing & Trading Score: 68 | |
| Day Percent Change: -0.49% Day Change: -0.06 | |
| Week Change: -0.73% Year-to-date Change: 1.6% | |
| AFCG Links: Profile News Message Board | |
| Charts:- Daily , Weekly | |
| Add AFCG to Watchlist: View: Get Complete AFCG Trend Analysis ➞ | |
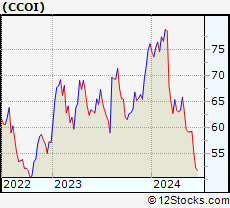 | CCOI Cogent Communications Holdings, Inc. |
| Sector: Technology | |
| SubSector: Diversified Communication Services | |
| MarketCap: 3868.14 Millions | |
| Recent Price: 59.15 Smart Investing & Trading Score: 42 | |
| Day Percent Change: 2.19% Day Change: 1.27 | |
| Week Change: -0.74% Year-to-date Change: -22.2% | |
| CCOI Links: Profile News Message Board | |
| Charts:- Daily , Weekly | |
| Add CCOI to Watchlist: View: Get Complete CCOI Trend Analysis ➞ | |
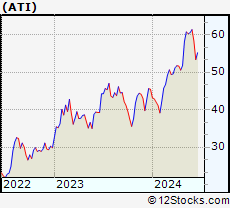 | ATI Allegheny Technologies Incorporated |
| Sector: Industrials | |
| SubSector: Metal Fabrication | |
| MarketCap: 913.35 Millions | |
| Recent Price: 60.27 Smart Investing & Trading Score: 76 | |
| Day Percent Change: -0.54% Day Change: -0.33 | |
| Week Change: -0.76% Year-to-date Change: 32.6% | |
| ATI Links: Profile News Message Board | |
| Charts:- Daily , Weekly | |
| Add ATI to Watchlist: View: Get Complete ATI Trend Analysis ➞ | |
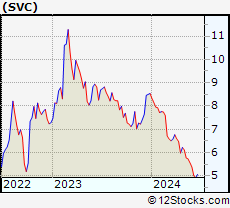 | SVC Service Properties Trust |
| Sector: Financials | |
| SubSector: REIT - Hotel/Motel | |
| MarketCap: 1067.74 Millions | |
| Recent Price: 5.73 Smart Investing & Trading Score: 10 | |
| Day Percent Change: -3.37% Day Change: -0.20 | |
| Week Change: -0.78% Year-to-date Change: -32.9% | |
| SVC Links: Profile News Message Board | |
| Charts:- Daily , Weekly | |
| Add SVC to Watchlist: View: Get Complete SVC Trend Analysis ➞ | |
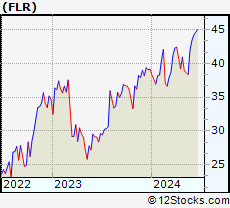 | FLR Fluor Corporation |
| Sector: Industrials | |
| SubSector: Heavy Construction | |
| MarketCap: 891.495 Millions | |
| Recent Price: 38.35 Smart Investing & Trading Score: 36 | |
| Day Percent Change: 0.24% Day Change: 0.09 | |
| Week Change: -0.78% Year-to-date Change: -2.1% | |
| FLR Links: Profile News Message Board | |
| Charts:- Daily , Weekly | |
| Add FLR to Watchlist: View: Get Complete FLR Trend Analysis ➞ | |
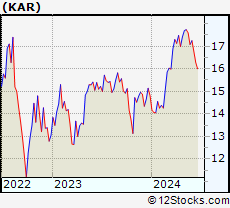 | KAR KAR Auction Services, Inc. |
| Sector: Services & Goods | |
| SubSector: Specialty Retail, Other | |
| MarketCap: 1709.54 Millions | |
| Recent Price: 17.60 Smart Investing & Trading Score: 58 | |
| Day Percent Change: -2.11% Day Change: -0.38 | |
| Week Change: -0.79% Year-to-date Change: 18.8% | |
| KAR Links: Profile News Message Board | |
| Charts:- Daily , Weekly | |
| Add KAR to Watchlist: View: Get Complete KAR Trend Analysis ➞ | |
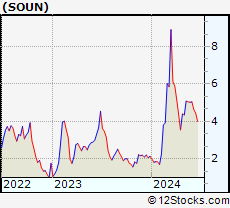 | SOUN SoundHound AI, Inc. |
| Sector: Technology | |
| SubSector: Software - Application | |
| MarketCap: 1040 Millions | |
| Recent Price: 5.05 Smart Investing & Trading Score: 30 | |
| Day Percent Change: -1.17% Day Change: -0.06 | |
| Week Change: -0.79% Year-to-date Change: 136.0% | |
| SOUN Links: Profile News Message Board | |
| Charts:- Daily , Weekly | |
| Add SOUN to Watchlist: View: Get Complete SOUN Trend Analysis ➞ | |
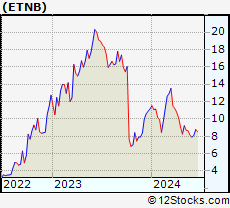 | ETNB 89bio, Inc. |
| Sector: Health Care | |
| SubSector: Biotechnology | |
| MarketCap: 517.485 Millions | |
| Recent Price: 8.63 Smart Investing & Trading Score: 25 | |
| Day Percent Change: -3.79% Day Change: -0.34 | |
| Week Change: -0.8% Year-to-date Change: -22.7% | |
| ETNB Links: Profile News Message Board | |
| Charts:- Daily , Weekly | |
| Add ETNB to Watchlist: View: Get Complete ETNB Trend Analysis ➞ | |
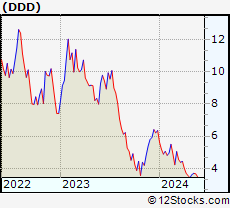 | DDD 3D Systems Corporation |
| Sector: Technology | |
| SubSector: Computer Peripherals | |
| MarketCap: 842.989 Millions | |
| Recent Price: 3.67 Smart Investing & Trading Score: 42 | |
| Day Percent Change: -2.39% Day Change: -0.09 | |
| Week Change: -0.81% Year-to-date Change: -42.2% | |
| DDD Links: Profile News Message Board | |
| Charts:- Daily , Weekly | |
| Add DDD to Watchlist: View: Get Complete DDD Trend Analysis ➞ | |
| Too many stocks? View smallcap stocks filtered by marketcap & sector |
| Marketcap: All SmallCap Stocks (default-no microcap), Large, Mid-Range, Small & MicroCap |
| Sector: Tech, Finance, Energy, Staples, Retail, Industrial, Materials, Utilities & Medical |
|
Best Stocks Today 12Stocks.com |
© 2024 12Stocks.com Terms & Conditions Privacy Contact Us
All Information Provided Only For Education And Not To Be Used For Investing or Trading. See Terms & Conditions


One More Thing ... Get Best Stocks Delivered Daily!
Never Ever Miss A Move With Our Top Ten Stocks Lists
Find Best Stocks In Any Market - Bull or Bear Market
Take A Peek At Our Top Ten Stocks Lists: Daily, Weekly, Year-to-Date & Top Trends
Find Best Stocks In Any Market - Bull or Bear Market
Take A Peek At Our Top Ten Stocks Lists: Daily, Weekly, Year-to-Date & Top Trends
Smallcap Stocks With Best Up Trends [0-bearish to 100-bullish]: CommScope Holding[100], Coeur Mining[100], Hecla Mining[100], MicroStrategy [100], Enovix [100], Rayonier Advanced[100], Nurix [100], Energy Fuels[100], NovaGold Resources[100], Piedmont Lithium[100], Wave Life[100]
Best Smallcap Stocks Year-to-Date:
CareMax [495.88%], Bakkt [413.9%], Janux [338.34%], Viking [260.02%], Alpine Immune[241.23%], Longboard [238.63%], Avidity Biosciences[226.33%], Super Micro[212.35%], Arcutis Bio[184.83%], Sweetgreen [180.97%], Novavax [171.04%] Best Smallcap Stocks This Week:
Vaxxinity [58.82%], Novavax [46.51%], Vicarious Surgical[45.62%], Harrow Health[44.48%], ProKidney [44.31%], Workhorse Group[36.06%], Maxeon Solar[35.94%], Fossil Group[35.44%], Humacyte [34.68%], MicroStrategy [34.23%], Cadiz [33.48%] Best Smallcap Stocks Daily:
Vaxxinity [45.95%], Presto Automation[31.90%], Vicarious Surgical[27.93%], Orchestra BioMed[12.77%], CommScope Holding[11.86%], Coeur Mining[11.57%], Hecla Mining[11.11%], MicroStrategy [10.04%], Tenaya [9.65%], Bakkt [9.25%], Enovix [9.25%]