
 Login Sign Up


| |||||
 |  | ||||

| 12Stocks.com Market Intelligence |
Best SmallCap Stocks
|
| In a hurry? Small Cap Stock Lists: Performance Trends Table, Stock Charts
Sort Small Cap stocks: Daily, Weekly, Year-to-Date, Market Cap & Trends. Filter Small Cap stocks list by sector: Show all, Tech, Finance, Energy, Staples, Retail, Industrial, Materials, Utilities and HealthCare Filter Small Cap stocks list by size: All Large Medium Small and MicroCap |
| 12Stocks.com Small Cap Stocks Performances & Trends Daily | |||||||||
|
|  The overall Smart Investing & Trading Score is 76 (0-bearish to 100-bullish) which puts Small Cap index in short term neutral to bullish trend. The Smart Investing & Trading Score from previous trading session is 90 and hence a deterioration of trend.
| ||||||||
Here are the Smart Investing & Trading Scores of the most requested small cap stocks at 12Stocks.com (click stock name for detailed review):
|


| 12Stocks.com: Investing in Smallcap Index with Stocks | |
|
The following table helps investors and traders sort through current performance and trends (as measured by Smart Investing & Trading Score) of various
stocks in the Smallcap Index. Quick View: Move mouse or cursor over stock symbol (ticker) to view short-term technical chart and over stock name to view long term chart. Click on  to add stock symbol to your watchlist and to add stock symbol to your watchlist and  to view watchlist. Click on any ticker or stock name for detailed market intelligence report for that stock. to view watchlist. Click on any ticker or stock name for detailed market intelligence report for that stock. |
12Stocks.com Performance of Stocks in Smallcap Index
| Ticker | Stock Name | Watchlist | Category | Recent Price | Smart Investing & Trading Score | Change % | Weekly Change% |
| GDYN | Grid Dynamics |   | Technology | 10.22 | 25 | -2.48% | -0.10% |
| CLDT | Chatham Lodging | | Financials | 9.02 | 22 | -0.44% | -0.11% |
| WIRE | Encore Wire | | Technology | 280.57 | 54 | -0.51% | -0.12% |
| VYGR | Voyager | | Health Care | 8.43 | 66 | -2.32% | -0.12% |
| ASIX | AdvanSix | | Materials | 24.85 | 44 | 0.12% | -0.12% |
| CVLY | Codorus Valley | | Financials | 22.47 | 25 | 0.31% | -0.13% |
| REFI | Chicago Atlantic | | Financials | 15.71 | 25 | 0.77% | -0.13% |
| HAE | Haemonetics | | Health Care | 95.73 | 63 | 0.98% | -0.14% |
| AIT | Applied Industrial | | Services & Goods | 196.99 | 66 | 0.07% | -0.17% |
| ANGO | AngioDynamics | | Health Care | 6.04 | 58 | -5.92% | -0.17% |
| HTLD | Heartland Express | | Transports | 11.46 | 50 | -0.61% | -0.17% |
| YORW | York Water | | Utilities | 38.38 | 83 | -0.52% | -0.18% |
| THRM | Gentherm | | Consumer Staples | 50.44 | 18 | -0.55% | -0.18% |
| TCI | Transcontinental Realty | | Financials | 28.30 | 23 | -0.53% | -0.18% |
| RDN | Radian Group | | Financials | 31.58 | 85 | -0.44% | -0.19% |
| GOOD | Gladstone Commercial | | Financials | 14.73 | 76 | -1.27% | -0.20% |
| GVA | Granite Construction | | Industrials | 62.21 | 68 | 1.01% | -0.21% |
| WINA | Winmark | | Services & Goods | 371.90 | 39 | -0.53% | -0.21% |
| CERE | Cerevel | | Health Care | 42.10 | 34 | -0.59% | -0.21% |
| CSTL | Castle Biosciences | | Health Care | 24.24 | 76 | 0.08% | -0.21% |
| VC | Visteon | | Consumer Staples | 114.19 | 68 | -1.37% | -0.22% |
| WWW | Wolverine World | | Consumer Staples | 13.46 | 68 | -0.66% | -0.22% |
| PSTL | Postal Realty | | Financials | 13.73 | 28 | -0.44% | -0.22% |
| SPXC | SPX | | Industrials | 140.12 | 76 | 0.75% | -0.24% |
| ECPG | Encore Capital | | Financials | 46.99 | 50 | 0.84% | -0.25% |


| Too many stocks? View smallcap stocks filtered by marketcap & sector |
| Marketcap: All SmallCap Stocks (default-no microcap), Large, Mid-Range, Small |
| Smallcap Sector: Tech, Finance, Energy, Staples, Retail, Industrial, Materials, & Medical |
|
Get the most comprehensive stock market coverage daily at 12Stocks.com ➞ Best Stocks Today ➞ Best Stocks Weekly ➞ Best Stocks Year-to-Date ➞ Best Stocks Trends ➞  Best Stocks Today 12Stocks.com Best Nasdaq Stocks ➞ Best S&P 500 Stocks ➞ Best Tech Stocks ➞ Best Biotech Stocks ➞ |
| Detailed Overview of SmallCap Stocks |
| SmallCap Technical Overview, Leaders & Laggards, Top SmallCap ETF Funds & Detailed SmallCap Stocks List, Charts, Trends & More |
| Smallcap: Technical Analysis, Trends & YTD Performance | |
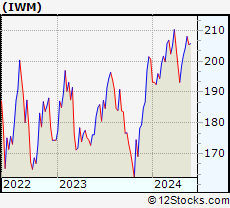
| SmallCap segment as represented by
IWM, an exchange-traded fund [ETF], holds basket of thousands of smallcap stocks from across all major sectors of the US stock market. The smallcap index (contains stocks like Riverbed & Sotheby's) is up by 3.67% and is currently underperforming the overall market by -6.9% year-to-date. Below is a quick view of technical charts and trends: | |
 IWM Weekly Chart |
|
| Long Term Trend: Very Good | |
| Medium Term Trend: Very Good | |
 IWM Daily Chart |
|
| Short Term Trend: Good | |
| Overall Trend Score: 76 | |
| YTD Performance: 3.67% | |
| **Trend Scores & Views Are Only For Educational Purposes And Not For Investing | |
| 12Stocks.com: Top Performing Small Cap Index Stocks | ||||||||||||||||||||||||||||||||||||||||||||||||
 The top performing Small Cap Index stocks year to date are
Now, more recently, over last week, the top performing Small Cap Index stocks on the move are


|
||||||||||||||||||||||||||||||||||||||||||||||||
| 12Stocks.com: Investing in Smallcap Index using Exchange Traded Funds | |
|
The following table shows list of key exchange traded funds (ETF) that
help investors track Smallcap index. The following list also includes leveraged ETF funds that track twice or thrice the daily returns of Smallcap indices. Short or inverse ETF funds move in the opposite direction to the index they track and are useful during market pullbacks or during bear markets. Quick View: Move mouse or cursor over ETF symbol (ticker) to view short-term technical chart and over ETF name to view long term chart. Click on ticker or stock name for detailed view. Click on to add stock symbol to your watchlist and to view watchlist. |
12Stocks.com List of ETFs that track Smallcap Index
| Ticker | ETF Name | Watchlist | Recent Price | Smart Investing & Trading Score | Change % | Week % | Year-to-date % |
| IWM | iShares Russell 2000 | | 208.08 | 76 | 0.07 | 1.85 | 3.67% |
| VTWO | Vanguard Russell 2000 ETF | | 84.11 | 71 | 0.00 | 1.8 | 3.71% |
| IJR | iShares Core S&P Small-Cap | | 110.39 | 68 | -0.22 | 1.29 | 1.98% |
| IWN | iShares Russell 2000 Value | | 158.71 | 76 | -0.07 | 1.61 | 2.18% |
| IWO | iShares Russell 2000 Growth | | 265.15 | 63 | -0.75 | 2.01 | 5.13% |
| IJS | iShares S&P Small-Cap 600 Value | | 101.87 | 76 | -0.15 | 1.34 | -1.16% |
| IJT | iShares S&P Small-Cap 600 Growth | | 131.34 | 71 | 0.04 | 1.14 | 4.95% |
| XSLV | PowerShares S&P SmallCap Low Volatil ETF | | 44.48 | 83 | -0.01 | 0.55 | 0.74% |
| SAA | ProShares Ultra SmallCap600 | | 24.90 | 71 | 0.50 | 2.28 | -0.18% |
| SMLV | SPDR SSGA US Small Cap Low Volatil ETF | | 113.28 | 95 | 0.43 | 1.85 | 0.68% |
| SDD | ProShares UltraShort SmallCap600 | | 17.84 | 35 | 0.96 | -2.41 | -3.19% |
| SBB | ProShares Short SmallCap600 | | 15.77 | 25 | 0.41 | -1.14 | -0.98% |
| 12Stocks.com: Charts, Trends, Fundamental Data and Performances of SmallCap Stocks | |
|
We now take in-depth look at all SmallCap stocks including charts, multi-period performances and overall trends (as measured by Smart Investing & Trading Score). One can sort SmallCap stocks (click link to choose) by Daily, Weekly and by Year-to-Date performances. Also, one can sort by size of the company or by market capitalization. |
| Select Your Default Chart Type: | |||||
| |||||
| Click on stock symbol or name for detailed view. Click on to add stock symbol to your watchlist and to view watchlist. Quick View: Move mouse or cursor over "Daily" to quickly view daily technical stock chart and over "Weekly" to view weekly technical stock chart. | |||||

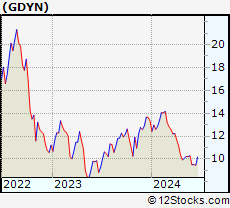 | GDYN Grid Dynamics Holdings, Inc. |
| Sector: Technology | |
| SubSector: Information Technology Services | |
| MarketCap: 318.968 Millions | |
| Recent Price: 10.22 Smart Investing & Trading Score: 25 | |
| Day Percent Change: -2.48% Day Change: -0.26 | |
| Week Change: -0.1% Year-to-date Change: -23.3% | |
| GDYN Links: Profile News Message Board | |
| Charts:- Daily , Weekly | |
| Add GDYN to Watchlist: View: Get Complete GDYN Trend Analysis ➞ | |
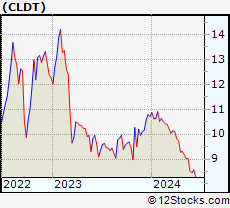 | CLDT Chatham Lodging Trust |
| Sector: Financials | |
| SubSector: REIT - Hotel/Motel | |
| MarketCap: 274.734 Millions | |
| Recent Price: 9.02 Smart Investing & Trading Score: 22 | |
| Day Percent Change: -0.44% Day Change: -0.04 | |
| Week Change: -0.11% Year-to-date Change: -15.9% | |
| CLDT Links: Profile News Message Board | |
| Charts:- Daily , Weekly | |
| Add CLDT to Watchlist: View: Get Complete CLDT Trend Analysis ➞ | |
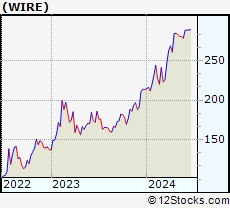 | WIRE Encore Wire Corporation |
| Sector: Technology | |
| SubSector: Diversified Electronics | |
| MarketCap: 898.896 Millions | |
| Recent Price: 280.57 Smart Investing & Trading Score: 54 | |
| Day Percent Change: -0.51% Day Change: -1.43 | |
| Week Change: -0.12% Year-to-date Change: 31.4% | |
| WIRE Links: Profile News Message Board | |
| Charts:- Daily , Weekly | |
| Add WIRE to Watchlist: View: Get Complete WIRE Trend Analysis ➞ | |
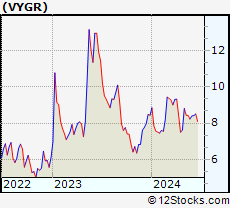 | VYGR Voyager Therapeutics, Inc. |
| Sector: Health Care | |
| SubSector: Biotechnology | |
| MarketCap: 321.085 Millions | |
| Recent Price: 8.43 Smart Investing & Trading Score: 66 | |
| Day Percent Change: -2.32% Day Change: -0.20 | |
| Week Change: -0.12% Year-to-date Change: -0.1% | |
| VYGR Links: Profile News Message Board | |
| Charts:- Daily , Weekly | |
| Add VYGR to Watchlist: View: Get Complete VYGR Trend Analysis ➞ | |
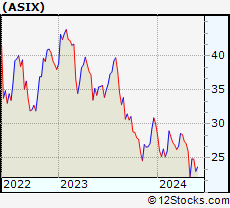 | ASIX AdvanSix Inc. |
| Sector: Materials | |
| SubSector: Chemicals - Major Diversified | |
| MarketCap: 394.136 Millions | |
| Recent Price: 24.85 Smart Investing & Trading Score: 44 | |
| Day Percent Change: 0.12% Day Change: 0.03 | |
| Week Change: -0.12% Year-to-date Change: -17.1% | |
| ASIX Links: Profile News Message Board | |
| Charts:- Daily , Weekly | |
| Add ASIX to Watchlist: View: Get Complete ASIX Trend Analysis ➞ | |
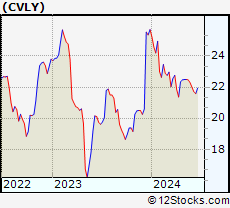 | CVLY Codorus Valley Bancorp, Inc. |
| Sector: Financials | |
| SubSector: Regional - Northeast Banks | |
| MarketCap: 173.799 Millions | |
| Recent Price: 22.47 Smart Investing & Trading Score: 25 | |
| Day Percent Change: 0.31% Day Change: 0.07 | |
| Week Change: -0.13% Year-to-date Change: -12.6% | |
| CVLY Links: Profile News Message Board | |
| Charts:- Daily , Weekly | |
| Add CVLY to Watchlist: View: Get Complete CVLY Trend Analysis ➞ | |
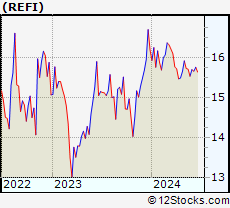 | REFI Chicago Atlantic Financials Finance, Inc. |
| Sector: Financials | |
| SubSector: REIT - Mortgage | |
| MarketCap: 285 Millions | |
| Recent Price: 15.71 Smart Investing & Trading Score: 25 | |
| Day Percent Change: 0.77% Day Change: 0.12 | |
| Week Change: -0.13% Year-to-date Change: -3.0% | |
| REFI Links: Profile News Message Board | |
| Charts:- Daily , Weekly | |
| Add REFI to Watchlist: View: Get Complete REFI Trend Analysis ➞ | |
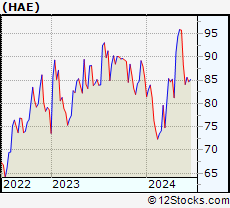 | HAE Haemonetics Corporation |
| Sector: Health Care | |
| SubSector: Medical Instruments & Supplies | |
| MarketCap: 4500.7 Millions | |
| Recent Price: 95.73 Smart Investing & Trading Score: 63 | |
| Day Percent Change: 0.98% Day Change: 0.93 | |
| Week Change: -0.14% Year-to-date Change: 12.0% | |
| HAE Links: Profile News Message Board | |
| Charts:- Daily , Weekly | |
| Add HAE to Watchlist: View: Get Complete HAE Trend Analysis ➞ | |
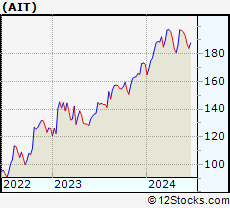 | AIT Applied Industrial Technologies, Inc. |
| Sector: Services & Goods | |
| SubSector: Industrial Equipment Wholesale | |
| MarketCap: 1531.58 Millions | |
| Recent Price: 196.99 Smart Investing & Trading Score: 66 | |
| Day Percent Change: 0.07% Day Change: 0.13 | |
| Week Change: -0.17% Year-to-date Change: 14.1% | |
| AIT Links: Profile News Message Board | |
| Charts:- Daily , Weekly | |
| Add AIT to Watchlist: View: Get Complete AIT Trend Analysis ➞ | |
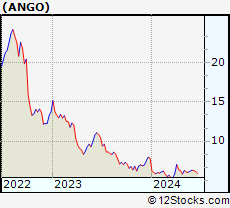 | ANGO AngioDynamics, Inc. |
| Sector: Health Care | |
| SubSector: Medical Instruments & Supplies | |
| MarketCap: 370.86 Millions | |
| Recent Price: 6.04 Smart Investing & Trading Score: 58 | |
| Day Percent Change: -5.92% Day Change: -0.38 | |
| Week Change: -0.17% Year-to-date Change: -23.0% | |
| ANGO Links: Profile News Message Board | |
| Charts:- Daily , Weekly | |
| Add ANGO to Watchlist: View: Get Complete ANGO Trend Analysis ➞ | |
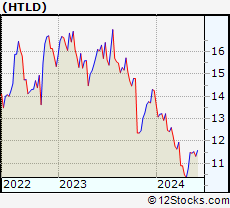 | HTLD Heartland Express, Inc. |
| Sector: Transports | |
| SubSector: Trucking | |
| MarketCap: 1461.25 Millions | |
| Recent Price: 11.46 Smart Investing & Trading Score: 50 | |
| Day Percent Change: -0.61% Day Change: -0.07 | |
| Week Change: -0.17% Year-to-date Change: -19.6% | |
| HTLD Links: Profile News Message Board | |
| Charts:- Daily , Weekly | |
| Add HTLD to Watchlist: View: Get Complete HTLD Trend Analysis ➞ | |
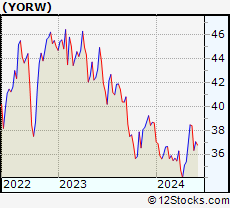 | YORW The York Water Company |
| Sector: Utilities | |
| SubSector: Water Utilities | |
| MarketCap: 539.502 Millions | |
| Recent Price: 38.38 Smart Investing & Trading Score: 83 | |
| Day Percent Change: -0.52% Day Change: -0.20 | |
| Week Change: -0.18% Year-to-date Change: -0.6% | |
| YORW Links: Profile News Message Board | |
| Charts:- Daily , Weekly | |
| Add YORW to Watchlist: View: Get Complete YORW Trend Analysis ➞ | |
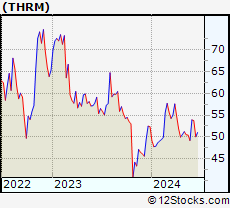 | THRM Gentherm Incorporated |
| Sector: Consumer Staples | |
| SubSector: Auto Parts | |
| MarketCap: 1032.59 Millions | |
| Recent Price: 50.44 Smart Investing & Trading Score: 18 | |
| Day Percent Change: -0.55% Day Change: -0.28 | |
| Week Change: -0.18% Year-to-date Change: -3.7% | |
| THRM Links: Profile News Message Board | |
| Charts:- Daily , Weekly | |
| Add THRM to Watchlist: View: Get Complete THRM Trend Analysis ➞ | |
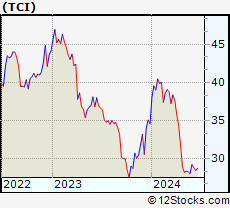 | TCI Transcontinental Realty Investors, Inc. |
| Sector: Financials | |
| SubSector: REIT - Diversified | |
| MarketCap: 158.653 Millions | |
| Recent Price: 28.30 Smart Investing & Trading Score: 23 | |
| Day Percent Change: -0.53% Day Change: -0.15 | |
| Week Change: -0.18% Year-to-date Change: -18.1% | |
| TCI Links: Profile News Message Board | |
| Charts:- Daily , Weekly | |
| Add TCI to Watchlist: View: Get Complete TCI Trend Analysis ➞ | |
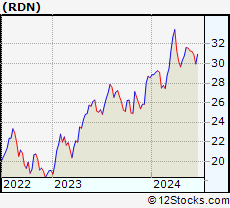 | RDN Radian Group Inc. |
| Sector: Financials | |
| SubSector: Property & Casualty Insurance | |
| MarketCap: 2950.12 Millions | |
| Recent Price: 31.58 Smart Investing & Trading Score: 85 | |
| Day Percent Change: -0.44% Day Change: -0.14 | |
| Week Change: -0.19% Year-to-date Change: 10.6% | |
| RDN Links: Profile News Message Board | |
| Charts:- Daily , Weekly | |
| Add RDN to Watchlist: View: Get Complete RDN Trend Analysis ➞ | |
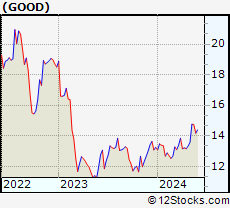 | GOOD Gladstone Commercial Corporation |
| Sector: Financials | |
| SubSector: REIT - Diversified | |
| MarketCap: 425.253 Millions | |
| Recent Price: 14.73 Smart Investing & Trading Score: 76 | |
| Day Percent Change: -1.27% Day Change: -0.19 | |
| Week Change: -0.2% Year-to-date Change: 11.3% | |
| GOOD Links: Profile News Message Board | |
| Charts:- Daily , Weekly | |
| Add GOOD to Watchlist: View: Get Complete GOOD Trend Analysis ➞ | |
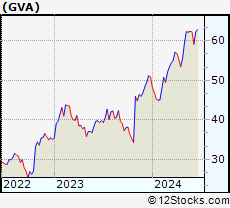 | GVA Granite Construction Incorporated |
| Sector: Industrials | |
| SubSector: Heavy Construction | |
| MarketCap: 725.895 Millions | |
| Recent Price: 62.21 Smart Investing & Trading Score: 68 | |
| Day Percent Change: 1.01% Day Change: 0.62 | |
| Week Change: -0.21% Year-to-date Change: 22.3% | |
| GVA Links: Profile News Message Board | |
| Charts:- Daily , Weekly | |
| Add GVA to Watchlist: View: Get Complete GVA Trend Analysis ➞ | |
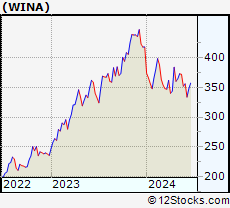 | WINA Winmark Corporation |
| Sector: Services & Goods | |
| SubSector: Specialty Retail, Other | |
| MarketCap: 520.444 Millions | |
| Recent Price: 371.90 Smart Investing & Trading Score: 39 | |
| Day Percent Change: -0.53% Day Change: -2.00 | |
| Week Change: -0.21% Year-to-date Change: -10.9% | |
| WINA Links: Profile News Message Board | |
| Charts:- Daily , Weekly | |
| Add WINA to Watchlist: View: Get Complete WINA Trend Analysis ➞ | |
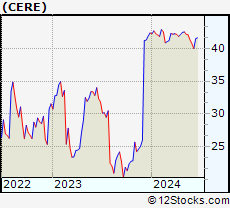 | CERE Cerevel Therapeutics Holdings, Inc. |
| Sector: Health Care | |
| SubSector: Biotechnology | |
| MarketCap: 21587 Millions | |
| Recent Price: 42.10 Smart Investing & Trading Score: 34 | |
| Day Percent Change: -0.59% Day Change: -0.25 | |
| Week Change: -0.21% Year-to-date Change: -0.7% | |
| CERE Links: Profile News Message Board | |
| Charts:- Daily , Weekly | |
| Add CERE to Watchlist: View: Get Complete CERE Trend Analysis ➞ | |
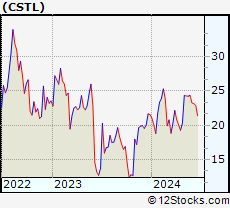 | CSTL Castle Biosciences, Inc. |
| Sector: Health Care | |
| SubSector: Medical Laboratories & Research | |
| MarketCap: 545 Millions | |
| Recent Price: 24.24 Smart Investing & Trading Score: 76 | |
| Day Percent Change: 0.08% Day Change: 0.02 | |
| Week Change: -0.21% Year-to-date Change: 12.3% | |
| CSTL Links: Profile News Message Board | |
| Charts:- Daily , Weekly | |
| Add CSTL to Watchlist: View: Get Complete CSTL Trend Analysis ➞ | |
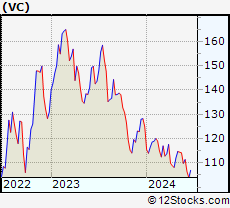 | VC Visteon Corporation |
| Sector: Consumer Staples | |
| SubSector: Auto Parts | |
| MarketCap: 1441.49 Millions | |
| Recent Price: 114.19 Smart Investing & Trading Score: 68 | |
| Day Percent Change: -1.37% Day Change: -1.59 | |
| Week Change: -0.22% Year-to-date Change: -8.6% | |
| VC Links: Profile News Message Board | |
| Charts:- Daily , Weekly | |
| Add VC to Watchlist: View: Get Complete VC Trend Analysis ➞ | |
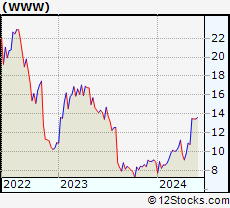 | WWW Wolverine World Wide, Inc. |
| Sector: Consumer Staples | |
| SubSector: Textile - Apparel Footwear & Accessories | |
| MarketCap: 1390.7 Millions | |
| Recent Price: 13.46 Smart Investing & Trading Score: 68 | |
| Day Percent Change: -0.66% Day Change: -0.09 | |
| Week Change: -0.22% Year-to-date Change: 51.4% | |
| WWW Links: Profile News Message Board | |
| Charts:- Daily , Weekly | |
| Add WWW to Watchlist: View: Get Complete WWW Trend Analysis ➞ | |
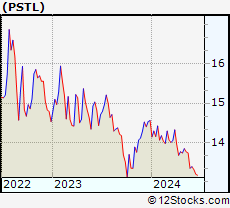 | PSTL Postal Realty Trust, Inc. |
| Sector: Financials | |
| SubSector: REIT - Office | |
| MarketCap: 82.9866 Millions | |
| Recent Price: 13.73 Smart Investing & Trading Score: 28 | |
| Day Percent Change: -0.44% Day Change: -0.06 | |
| Week Change: -0.22% Year-to-date Change: -5.7% | |
| PSTL Links: Profile News Message Board | |
| Charts:- Daily , Weekly | |
| Add PSTL to Watchlist: View: Get Complete PSTL Trend Analysis ➞ | |
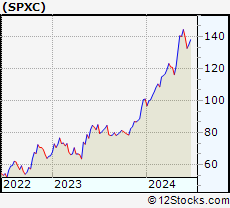 | SPXC SPX Corporation |
| Sector: Industrials | |
| SubSector: Diversified Machinery | |
| MarketCap: 1415.56 Millions | |
| Recent Price: 140.12 Smart Investing & Trading Score: 76 | |
| Day Percent Change: 0.75% Day Change: 1.04 | |
| Week Change: -0.24% Year-to-date Change: 38.7% | |
| SPXC Links: Profile News Message Board | |
| Charts:- Daily , Weekly | |
| Add SPXC to Watchlist: View: Get Complete SPXC Trend Analysis ➞ | |
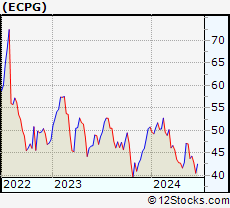 | ECPG Encore Capital Group, Inc. |
| Sector: Financials | |
| SubSector: Asset Management | |
| MarketCap: 661.503 Millions | |
| Recent Price: 46.99 Smart Investing & Trading Score: 50 | |
| Day Percent Change: 0.84% Day Change: 0.39 | |
| Week Change: -0.25% Year-to-date Change: -7.4% | |
| ECPG Links: Profile News Message Board | |
| Charts:- Daily , Weekly | |
| Add ECPG to Watchlist: View: Get Complete ECPG Trend Analysis ➞ | |
| Too many stocks? View smallcap stocks filtered by marketcap & sector |
| Marketcap: All SmallCap Stocks (default-no microcap), Large, Mid-Range, Small & MicroCap |
| Sector: Tech, Finance, Energy, Staples, Retail, Industrial, Materials, Utilities & Medical |
|
Best Stocks Today 12Stocks.com |
© 2024 12Stocks.com Terms & Conditions Privacy Contact Us
All Information Provided Only For Education And Not To Be Used For Investing or Trading. See Terms & Conditions


One More Thing ... Get Best Stocks Delivered Daily!
Never Ever Miss A Move With Our Top Ten Stocks Lists
Find Best Stocks In Any Market - Bull or Bear Market
Take A Peek At Our Top Ten Stocks Lists: Daily, Weekly, Year-to-Date & Top Trends
Find Best Stocks In Any Market - Bull or Bear Market
Take A Peek At Our Top Ten Stocks Lists: Daily, Weekly, Year-to-Date & Top Trends
Smallcap Stocks With Best Up Trends [0-bearish to 100-bullish]: CommScope Holding[100], Coeur Mining[100], Hecla Mining[100], MicroStrategy [100], Enovix [100], Rayonier Advanced[100], Nurix [100], Energy Fuels[100], NovaGold Resources[100], Piedmont Lithium[100], Wave Life[100]
Best Smallcap Stocks Year-to-Date:
CareMax [495.88%], Bakkt [413.9%], Janux [338.34%], Viking [260.02%], Alpine Immune[241.23%], Longboard [238.63%], Avidity Biosciences[226.33%], Super Micro[212.35%], Arcutis Bio[184.83%], Sweetgreen [180.97%], Novavax [171.04%] Best Smallcap Stocks This Week:
Vaxxinity [58.82%], Novavax [46.51%], Vicarious Surgical[45.62%], Harrow Health[44.48%], ProKidney [44.31%], Workhorse Group[36.06%], Maxeon Solar[35.94%], Fossil Group[35.44%], Humacyte [34.68%], MicroStrategy [34.23%], Cadiz [33.48%] Best Smallcap Stocks Daily:
Vaxxinity [45.95%], Presto Automation[31.90%], Vicarious Surgical[27.93%], Orchestra BioMed[12.77%], CommScope Holding[11.86%], Coeur Mining[11.57%], Hecla Mining[11.11%], MicroStrategy [10.04%], Tenaya [9.65%], Bakkt [9.25%], Enovix [9.25%]