
 Login Sign Up


| |||||
 |  | ||||

| 12Stocks.com Market Intelligence |
Best SmallCap Stocks
|
| In a hurry? Small Cap Stock Lists: Performance Trends Table, Stock Charts
Sort Small Cap stocks: Daily, Weekly, Year-to-Date, Market Cap & Trends. Filter Small Cap stocks list by sector: Show all, Tech, Finance, Energy, Staples, Retail, Industrial, Materials, Utilities and HealthCare Filter Small Cap stocks list by size: All Large Medium Small and MicroCap |
| 12Stocks.com Small Cap Stocks Performances & Trends Daily | |||||||||
|
|  The overall Smart Investing & Trading Score is 76 (0-bearish to 100-bullish) which puts Small Cap index in short term neutral to bullish trend. The Smart Investing & Trading Score from previous trading session is 90 and hence a deterioration of trend.
| ||||||||
Here are the Smart Investing & Trading Scores of the most requested small cap stocks at 12Stocks.com (click stock name for detailed review):
|


| 12Stocks.com: Investing in Smallcap Index with Stocks | |
|
The following table helps investors and traders sort through current performance and trends (as measured by Smart Investing & Trading Score) of various
stocks in the Smallcap Index. Quick View: Move mouse or cursor over stock symbol (ticker) to view short-term technical chart and over stock name to view long term chart. Click on  to add stock symbol to your watchlist and to add stock symbol to your watchlist and  to view watchlist. Click on any ticker or stock name for detailed market intelligence report for that stock. to view watchlist. Click on any ticker or stock name for detailed market intelligence report for that stock. |
12Stocks.com Performance of Stocks in Smallcap Index
| Ticker | Stock Name | Watchlist | Category | Recent Price | Smart Investing & Trading Score | Change % | Weekly Change% |
| RVMD | Revolution Medicines |   | Health Care | 39.41 | 81 | 1.08% | 5.07% |
| NKSH | National Bankshares | | Financials | 31.79 | 88 | 0.06% | 5.06% |
| AXGN | AxoGen | | Health Care | 6.04 | 42 | 1.17% | 5.04% |
| WAFD | Washington Federal | | Financials | 30.04 | 100 | 0.84% | 5.03% |
| MXL | MaxLinear | | Technology | 19.45 | 55 | 0.05% | 5.02% |
| TK | Teekay | | Transports | 9.23 | 95 | 0.76% | 5.01% |
| AXSM | Axsome | | Health Care | 76.13 | 25 | -1.69% | 5.01% |
| GSHD | Goosehead Insurance | | Financials | 63.38 | 52 | -0.14% | 5.01% |
| CNMD | CONMED | | Health Care | 74.72 | 69 | -1.03% | 5.00% |
| OVID | Ovid | | Health Care | 3.15 | 32 | -3.82% | 5.00% |
| HAIN | Hain Celestial | | Consumer Staples | 7.38 | 49 | -0.94% | 4.98% |
| STNG | Scorpio Tankers | | Transports | 81.69 | 95 | 0.79% | 4.97% |
| ALIT | Alight | | Technology | 8.05 | 32 | 0.88% | 4.95% |
| CARS | Cars.com | | Services & Goods | 18.47 | 76 | 0.00% | 4.94% |
| CRS | Carpenter | | Industrials | 109.83 | 90 | -0.14% | 4.93% |
| FEAM | 5E Advanced | | Materials | 1.50 | 54 | 4.17% | 4.90% |
| MTX | Minerals | | Materials | 83.80 | 100 | 2.37% | 4.88% |
| BELFB | Bel Fuse | | Technology | 65.11 | 83 | -1.78% | 4.88% |
| USNA | USANA Health | | Health Care | 48.99 | 95 | 0.97% | 4.88% |
| VIAV | Viavi Solutions | | Technology | 7.74 | 42 | 0.00% | 4.88% |
| PRM | Perimeter Solutions | | Materials | 7.97 | 83 | 2.71% | 4.87% |
| MCB | Metropolitan Bank | | Financials | 44.70 | 100 | 1.06% | 4.86% |
| EGRX | Eagle | | Health Care | 4.76 | 64 | 0.21% | 4.85% |
| PAHC | Phibro Animal | | Health Care | 18.40 | 90 | 2.34% | 4.84% |
| PLSE | Pulse Biosciences | | Health Care | 7.81 | 57 | -1.01% | 4.83% |


| Too many stocks? View smallcap stocks filtered by marketcap & sector |
| Marketcap: All SmallCap Stocks (default-no microcap), Large, Mid-Range, Small |
| Smallcap Sector: Tech, Finance, Energy, Staples, Retail, Industrial, Materials, & Medical |
|
Get the most comprehensive stock market coverage daily at 12Stocks.com ➞ Best Stocks Today ➞ Best Stocks Weekly ➞ Best Stocks Year-to-Date ➞ Best Stocks Trends ➞  Best Stocks Today 12Stocks.com Best Nasdaq Stocks ➞ Best S&P 500 Stocks ➞ Best Tech Stocks ➞ Best Biotech Stocks ➞ |
| Detailed Overview of SmallCap Stocks |
| SmallCap Technical Overview, Leaders & Laggards, Top SmallCap ETF Funds & Detailed SmallCap Stocks List, Charts, Trends & More |
| Smallcap: Technical Analysis, Trends & YTD Performance | |
| SmallCap segment as represented by
IWM, an exchange-traded fund [ETF], holds basket of thousands of smallcap stocks from across all major sectors of the US stock market. The smallcap index (contains stocks like Riverbed & Sotheby's) is up by 3.67% and is currently underperforming the overall market by -6.9% year-to-date. Below is a quick view of technical charts and trends: | |
 IWM Weekly Chart |
|
| Long Term Trend: Very Good | |
| Medium Term Trend: Very Good | |
 IWM Daily Chart |
|
| Short Term Trend: Good | |
| Overall Trend Score: 76 | |
| YTD Performance: 3.67% | |
| **Trend Scores & Views Are Only For Educational Purposes And Not For Investing | |
| 12Stocks.com: Top Performing Small Cap Index Stocks | ||||||||||||||||||||||||||||||||||||||||||||||||
 The top performing Small Cap Index stocks year to date are
Now, more recently, over last week, the top performing Small Cap Index stocks on the move are


|
||||||||||||||||||||||||||||||||||||||||||||||||
| 12Stocks.com: Investing in Smallcap Index using Exchange Traded Funds | |
|
The following table shows list of key exchange traded funds (ETF) that
help investors track Smallcap index. The following list also includes leveraged ETF funds that track twice or thrice the daily returns of Smallcap indices. Short or inverse ETF funds move in the opposite direction to the index they track and are useful during market pullbacks or during bear markets. Quick View: Move mouse or cursor over ETF symbol (ticker) to view short-term technical chart and over ETF name to view long term chart. Click on ticker or stock name for detailed view. Click on to add stock symbol to your watchlist and to view watchlist. |
12Stocks.com List of ETFs that track Smallcap Index
| Ticker | ETF Name | Watchlist | Recent Price | Smart Investing & Trading Score | Change % | Week % | Year-to-date % |
| IWM | iShares Russell 2000 | | 208.08 | 76 | 0.07 | 1.85 | 3.67% |
| VTWO | Vanguard Russell 2000 ETF | | 84.11 | 71 | 0.00 | 1.8 | 3.71% |
| IJR | iShares Core S&P Small-Cap | | 110.39 | 68 | -0.22 | 1.29 | 1.98% |
| IWN | iShares Russell 2000 Value | | 158.71 | 76 | -0.07 | 1.61 | 2.18% |
| IWO | iShares Russell 2000 Growth | | 265.15 | 63 | -0.75 | 2.01 | 5.13% |
| IJS | iShares S&P Small-Cap 600 Value | | 101.87 | 76 | -0.15 | 1.34 | -1.16% |
| IJT | iShares S&P Small-Cap 600 Growth | | 131.34 | 71 | 0.04 | 1.14 | 4.95% |
| XSLV | PowerShares S&P SmallCap Low Volatil ETF | | 44.48 | 83 | -0.01 | 0.55 | 0.74% |
| SAA | ProShares Ultra SmallCap600 | | 24.90 | 71 | 0.50 | 2.28 | -0.18% |
| SMLV | SPDR SSGA US Small Cap Low Volatil ETF | | 113.28 | 95 | 0.43 | 1.85 | 0.68% |
| SDD | ProShares UltraShort SmallCap600 | | 17.84 | 35 | 0.96 | -2.41 | -3.19% |
| SBB | ProShares Short SmallCap600 | | 15.77 | 25 | 0.41 | -1.14 | -0.98% |
| 12Stocks.com: Charts, Trends, Fundamental Data and Performances of SmallCap Stocks | |
|
We now take in-depth look at all SmallCap stocks including charts, multi-period performances and overall trends (as measured by Smart Investing & Trading Score). One can sort SmallCap stocks (click link to choose) by Daily, Weekly and by Year-to-Date performances. Also, one can sort by size of the company or by market capitalization. |
| Select Your Default Chart Type: | |||||
| |||||
| Click on stock symbol or name for detailed view. Click on to add stock symbol to your watchlist and to view watchlist. Quick View: Move mouse or cursor over "Daily" to quickly view daily technical stock chart and over "Weekly" to view weekly technical stock chart. | |||||

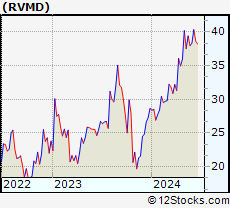 | RVMD Revolution Medicines, Inc. |
| Sector: Health Care | |
| SubSector: Biotechnology | |
| MarketCap: 28087 Millions | |
| Recent Price: 39.41 Smart Investing & Trading Score: 81 | |
| Day Percent Change: 1.08% Day Change: 0.42 | |
| Week Change: 5.07% Year-to-date Change: 37.4% | |
| RVMD Links: Profile News Message Board | |
| Charts:- Daily , Weekly | |
| Add RVMD to Watchlist: View: Get Complete RVMD Trend Analysis ➞ | |
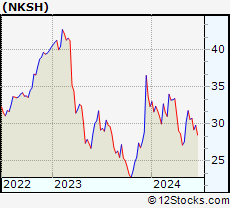 | NKSH National Bankshares, Inc. |
| Sector: Financials | |
| SubSector: Regional - Mid-Atlantic Banks | |
| MarketCap: 209.759 Millions | |
| Recent Price: 31.79 Smart Investing & Trading Score: 88 | |
| Day Percent Change: 0.06% Day Change: 0.02 | |
| Week Change: 5.06% Year-to-date Change: -1.7% | |
| NKSH Links: Profile News Message Board | |
| Charts:- Daily , Weekly | |
| Add NKSH to Watchlist: View: Get Complete NKSH Trend Analysis ➞ | |
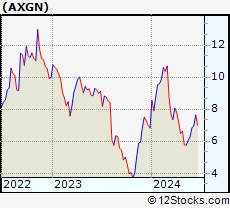 | AXGN AxoGen, Inc. |
| Sector: Health Care | |
| SubSector: Medical Appliances & Equipment | |
| MarketCap: 349.28 Millions | |
| Recent Price: 6.04 Smart Investing & Trading Score: 42 | |
| Day Percent Change: 1.17% Day Change: 0.07 | |
| Week Change: 5.04% Year-to-date Change: -11.6% | |
| AXGN Links: Profile News Message Board | |
| Charts:- Daily , Weekly | |
| Add AXGN to Watchlist: View: Get Complete AXGN Trend Analysis ➞ | |
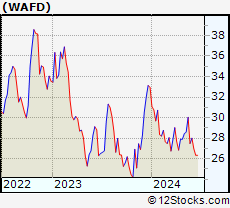 | WAFD Washington Federal, Inc. |
| Sector: Financials | |
| SubSector: Savings & Loans | |
| MarketCap: 2219.2 Millions | |
| Recent Price: 30.04 Smart Investing & Trading Score: 100 | |
| Day Percent Change: 0.84% Day Change: 0.25 | |
| Week Change: 5.03% Year-to-date Change: -8.9% | |
| WAFD Links: Profile News Message Board | |
| Charts:- Daily , Weekly | |
| Add WAFD to Watchlist: View: Get Complete WAFD Trend Analysis ➞ | |
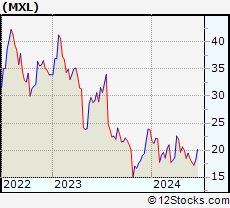 | MXL MaxLinear, Inc. |
| Sector: Technology | |
| SubSector: Semiconductor - Integrated Circuits | |
| MarketCap: 751.31 Millions | |
| Recent Price: 19.45 Smart Investing & Trading Score: 55 | |
| Day Percent Change: 0.05% Day Change: 0.01 | |
| Week Change: 5.02% Year-to-date Change: -18.2% | |
| MXL Links: Profile News Message Board | |
| Charts:- Daily , Weekly | |
| Add MXL to Watchlist: View: Get Complete MXL Trend Analysis ➞ | |
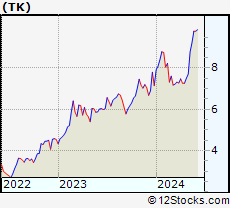 | TK Teekay Corporation |
| Sector: Transports | |
| SubSector: Shipping | |
| MarketCap: 257.914 Millions | |
| Recent Price: 9.23 Smart Investing & Trading Score: 95 | |
| Day Percent Change: 0.76% Day Change: 0.07 | |
| Week Change: 5.01% Year-to-date Change: 29.1% | |
| TK Links: Profile News Message Board | |
| Charts:- Daily , Weekly | |
| Add TK to Watchlist: View: Get Complete TK Trend Analysis ➞ | |
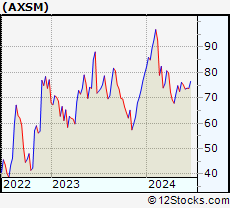 | AXSM Axsome Therapeutics, Inc. |
| Sector: Health Care | |
| SubSector: Biotechnology | |
| MarketCap: 2284.25 Millions | |
| Recent Price: 76.13 Smart Investing & Trading Score: 25 | |
| Day Percent Change: -1.69% Day Change: -1.31 | |
| Week Change: 5.01% Year-to-date Change: -4.4% | |
| AXSM Links: Profile News Message Board | |
| Charts:- Daily , Weekly | |
| Add AXSM to Watchlist: View: Get Complete AXSM Trend Analysis ➞ | |
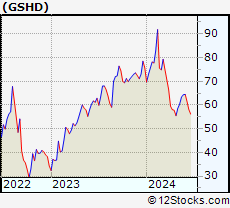 | GSHD Goosehead Insurance, Inc |
| Sector: Financials | |
| SubSector: Insurance Brokers | |
| MarketCap: 1863.57 Millions | |
| Recent Price: 63.38 Smart Investing & Trading Score: 52 | |
| Day Percent Change: -0.14% Day Change: -0.09 | |
| Week Change: 5.01% Year-to-date Change: -16.4% | |
| GSHD Links: Profile News Message Board | |
| Charts:- Daily , Weekly | |
| Add GSHD to Watchlist: View: Get Complete GSHD Trend Analysis ➞ | |
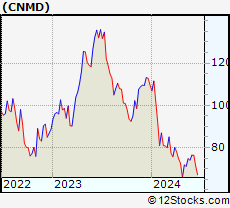 | CNMD CONMED Corporation |
| Sector: Health Care | |
| SubSector: Medical Appliances & Equipment | |
| MarketCap: 1589.2 Millions | |
| Recent Price: 74.72 Smart Investing & Trading Score: 69 | |
| Day Percent Change: -1.03% Day Change: -0.78 | |
| Week Change: 5% Year-to-date Change: -31.8% | |
| CNMD Links: Profile News Message Board | |
| Charts:- Daily , Weekly | |
| Add CNMD to Watchlist: View: Get Complete CNMD Trend Analysis ➞ | |
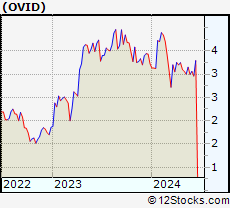 | OVID Ovid Therapeutics Inc. |
| Sector: Health Care | |
| SubSector: Biotechnology | |
| MarketCap: 130.385 Millions | |
| Recent Price: 3.15 Smart Investing & Trading Score: 32 | |
| Day Percent Change: -3.82% Day Change: -0.13 | |
| Week Change: 5% Year-to-date Change: -2.2% | |
| OVID Links: Profile News Message Board | |
| Charts:- Daily , Weekly | |
| Add OVID to Watchlist: View: Get Complete OVID Trend Analysis ➞ | |
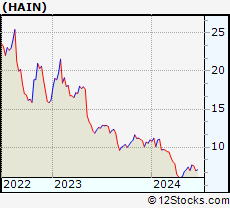 | HAIN The Hain Celestial Group, Inc. |
| Sector: Consumer Staples | |
| SubSector: Food Wholesale | |
| MarketCap: 2684.69 Millions | |
| Recent Price: 7.38 Smart Investing & Trading Score: 49 | |
| Day Percent Change: -0.94% Day Change: -0.07 | |
| Week Change: 4.98% Year-to-date Change: -32.6% | |
| HAIN Links: Profile News Message Board | |
| Charts:- Daily , Weekly | |
| Add HAIN to Watchlist: View: Get Complete HAIN Trend Analysis ➞ | |
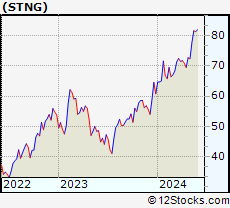 | STNG Scorpio Tankers Inc. |
| Sector: Transports | |
| SubSector: Shipping | |
| MarketCap: 813.214 Millions | |
| Recent Price: 81.69 Smart Investing & Trading Score: 95 | |
| Day Percent Change: 0.79% Day Change: 0.64 | |
| Week Change: 4.97% Year-to-date Change: 34.4% | |
| STNG Links: Profile News Message Board | |
| Charts:- Daily , Weekly | |
| Add STNG to Watchlist: View: Get Complete STNG Trend Analysis ➞ | |
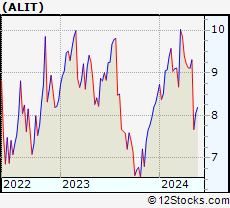 | ALIT Alight, Inc. |
| Sector: Technology | |
| SubSector: Software - Application | |
| MarketCap: 5130 Millions | |
| Recent Price: 8.05 Smart Investing & Trading Score: 32 | |
| Day Percent Change: 0.88% Day Change: 0.07 | |
| Week Change: 4.95% Year-to-date Change: -5.4% | |
| ALIT Links: Profile News Message Board | |
| Charts:- Daily , Weekly | |
| Add ALIT to Watchlist: View: Get Complete ALIT Trend Analysis ➞ | |
 | CARS Cars.com Inc. |
| Sector: Services & Goods | |
| SubSector: Auto Dealerships | |
| MarketCap: 290.321 Millions | |
| Recent Price: 18.47 Smart Investing & Trading Score: 76 | |
| Day Percent Change: 0.00% Day Change: 0.00 | |
| Week Change: 4.94% Year-to-date Change: -2.6% | |
| CARS Links: Profile News Message Board | |
| Charts:- Daily , Weekly | |
| Add CARS to Watchlist: View: Get Complete CARS Trend Analysis ➞ | |
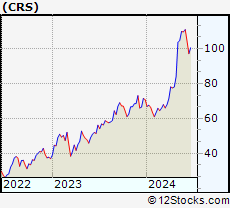 | CRS Carpenter Technology Corporation |
| Sector: Industrials | |
| SubSector: Metal Fabrication | |
| MarketCap: 853.35 Millions | |
| Recent Price: 109.83 Smart Investing & Trading Score: 90 | |
| Day Percent Change: -0.14% Day Change: -0.15 | |
| Week Change: 4.93% Year-to-date Change: 55.1% | |
| CRS Links: Profile News Message Board | |
| Charts:- Daily , Weekly | |
| Add CRS to Watchlist: View: Get Complete CRS Trend Analysis ➞ | |
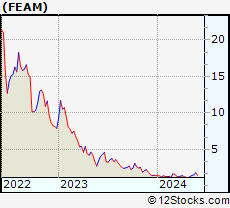 | FEAM 5E Advanced Materials Inc. |
| Sector: Materials | |
| SubSector: Specialty Chemicals | |
| MarketCap: 247 Millions | |
| Recent Price: 1.50 Smart Investing & Trading Score: 54 | |
| Day Percent Change: 4.17% Day Change: 0.06 | |
| Week Change: 4.9% Year-to-date Change: 6.4% | |
| FEAM Links: Profile News Message Board | |
| Charts:- Daily , Weekly | |
| Add FEAM to Watchlist: View: Get Complete FEAM Trend Analysis ➞ | |
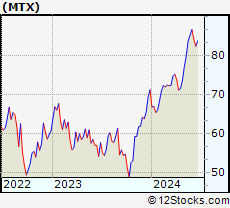 | MTX Minerals Technologies Inc. |
| Sector: Materials | |
| SubSector: Chemicals - Major Diversified | |
| MarketCap: 1155.36 Millions | |
| Recent Price: 83.80 Smart Investing & Trading Score: 100 | |
| Day Percent Change: 2.37% Day Change: 1.94 | |
| Week Change: 4.88% Year-to-date Change: 17.5% | |
| MTX Links: Profile News Message Board | |
| Charts:- Daily , Weekly | |
| Add MTX to Watchlist: View: Get Complete MTX Trend Analysis ➞ | |
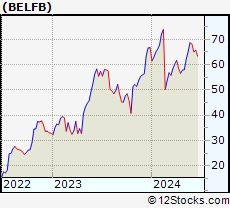 | BELFB Bel Fuse Inc. |
| Sector: Technology | |
| SubSector: Diversified Electronics | |
| MarketCap: 77.0396 Millions | |
| Recent Price: 65.11 Smart Investing & Trading Score: 83 | |
| Day Percent Change: -1.78% Day Change: -1.18 | |
| Week Change: 4.88% Year-to-date Change: -2.5% | |
| BELFB Links: Profile News Message Board | |
| Charts:- Daily , Weekly | |
| Add BELFB to Watchlist: View: Get Complete BELFB Trend Analysis ➞ | |
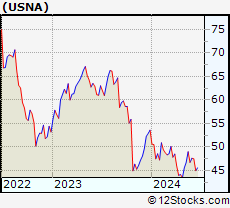 | USNA USANA Health Sciences, Inc. |
| Sector: Health Care | |
| SubSector: Drug Related Products | |
| MarketCap: 1185.13 Millions | |
| Recent Price: 48.99 Smart Investing & Trading Score: 95 | |
| Day Percent Change: 0.97% Day Change: 0.47 | |
| Week Change: 4.88% Year-to-date Change: -8.6% | |
| USNA Links: Profile News Message Board | |
| Charts:- Daily , Weekly | |
| Add USNA to Watchlist: View: Get Complete USNA Trend Analysis ➞ | |
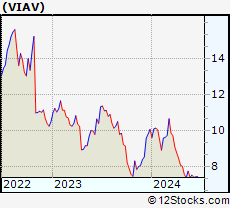 | VIAV Viavi Solutions Inc. |
| Sector: Technology | |
| SubSector: Communication Equipment | |
| MarketCap: 2653.29 Millions | |
| Recent Price: 7.74 Smart Investing & Trading Score: 42 | |
| Day Percent Change: 0.00% Day Change: 0.00 | |
| Week Change: 4.88% Year-to-date Change: -23.1% | |
| VIAV Links: Profile News Message Board | |
| Charts:- Daily , Weekly | |
| Add VIAV to Watchlist: View: Get Complete VIAV Trend Analysis ➞ | |
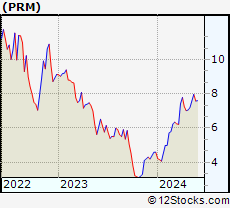 | PRM Perimeter Solutions, SA |
| Sector: Materials | |
| SubSector: Specialty Chemicals | |
| MarketCap: 930 Millions | |
| Recent Price: 7.97 Smart Investing & Trading Score: 83 | |
| Day Percent Change: 2.71% Day Change: 0.21 | |
| Week Change: 4.87% Year-to-date Change: 73.5% | |
| PRM Links: Profile News Message Board | |
| Charts:- Daily , Weekly | |
| Add PRM to Watchlist: View: Get Complete PRM Trend Analysis ➞ | |
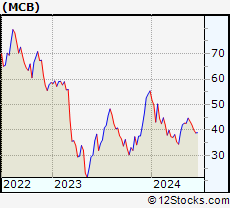 | MCB Metropolitan Bank Holding Corp. |
| Sector: Financials | |
| SubSector: Regional - Northeast Banks | |
| MarketCap: 212.999 Millions | |
| Recent Price: 44.70 Smart Investing & Trading Score: 100 | |
| Day Percent Change: 1.06% Day Change: 0.47 | |
| Week Change: 4.86% Year-to-date Change: -19.3% | |
| MCB Links: Profile News Message Board | |
| Charts:- Daily , Weekly | |
| Add MCB to Watchlist: View: Get Complete MCB Trend Analysis ➞ | |
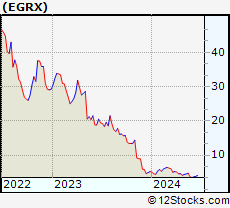 | EGRX Eagle Pharmaceuticals, Inc. |
| Sector: Health Care | |
| SubSector: Drugs - Generic | |
| MarketCap: 573.385 Millions | |
| Recent Price: 4.76 Smart Investing & Trading Score: 64 | |
| Day Percent Change: 0.21% Day Change: 0.01 | |
| Week Change: 4.85% Year-to-date Change: -9.0% | |
| EGRX Links: Profile News Message Board | |
| Charts:- Daily , Weekly | |
| Add EGRX to Watchlist: View: Get Complete EGRX Trend Analysis ➞ | |
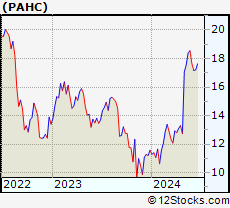 | PAHC Phibro Animal Health Corporation |
| Sector: Health Care | |
| SubSector: Specialized Health Services | |
| MarketCap: 852.956 Millions | |
| Recent Price: 18.40 Smart Investing & Trading Score: 90 | |
| Day Percent Change: 2.34% Day Change: 0.42 | |
| Week Change: 4.84% Year-to-date Change: 58.9% | |
| PAHC Links: Profile News Message Board | |
| Charts:- Daily , Weekly | |
| Add PAHC to Watchlist: View: Get Complete PAHC Trend Analysis ➞ | |
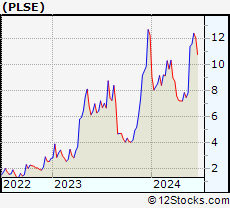 | PLSE Pulse Biosciences, Inc. |
| Sector: Health Care | |
| SubSector: Medical Instruments & Supplies | |
| MarketCap: 131.96 Millions | |
| Recent Price: 7.81 Smart Investing & Trading Score: 57 | |
| Day Percent Change: -1.01% Day Change: -0.08 | |
| Week Change: 4.83% Year-to-date Change: -36.2% | |
| PLSE Links: Profile News Message Board | |
| Charts:- Daily , Weekly | |
| Add PLSE to Watchlist: View: Get Complete PLSE Trend Analysis ➞ | |
| Too many stocks? View smallcap stocks filtered by marketcap & sector |
| Marketcap: All SmallCap Stocks (default-no microcap), Large, Mid-Range, Small & MicroCap |
| Sector: Tech, Finance, Energy, Staples, Retail, Industrial, Materials, Utilities & Medical |
|
Best Stocks Today 12Stocks.com |
© 2024 12Stocks.com Terms & Conditions Privacy Contact Us
All Information Provided Only For Education And Not To Be Used For Investing or Trading. See Terms & Conditions


One More Thing ... Get Best Stocks Delivered Daily!
Never Ever Miss A Move With Our Top Ten Stocks Lists
Find Best Stocks In Any Market - Bull or Bear Market
Take A Peek At Our Top Ten Stocks Lists: Daily, Weekly, Year-to-Date & Top Trends
Find Best Stocks In Any Market - Bull or Bear Market
Take A Peek At Our Top Ten Stocks Lists: Daily, Weekly, Year-to-Date & Top Trends
Smallcap Stocks With Best Up Trends [0-bearish to 100-bullish]: CommScope Holding[100], Coeur Mining[100], Hecla Mining[100], MicroStrategy [100], Enovix [100], Rayonier Advanced[100], Nurix [100], Energy Fuels[100], NovaGold Resources[100], Piedmont Lithium[100], Wave Life[100]
Best Smallcap Stocks Year-to-Date:
CareMax [495.88%], Bakkt [413.9%], Janux [338.34%], Viking [260.02%], Alpine Immune[241.23%], Longboard [238.63%], Avidity Biosciences[226.33%], Super Micro[212.35%], Arcutis Bio[184.83%], Sweetgreen [180.97%], Novavax [171.04%] Best Smallcap Stocks This Week:
Vaxxinity [58.82%], Novavax [46.51%], Vicarious Surgical[45.62%], Harrow Health[44.48%], ProKidney [44.31%], Workhorse Group[36.06%], Maxeon Solar[35.94%], Fossil Group[35.44%], Humacyte [34.68%], MicroStrategy [34.23%], Cadiz [33.48%] Best Smallcap Stocks Daily:
Vaxxinity [45.95%], Presto Automation[31.90%], Vicarious Surgical[27.93%], Orchestra BioMed[12.77%], CommScope Holding[11.86%], Coeur Mining[11.57%], Hecla Mining[11.11%], MicroStrategy [10.04%], Tenaya [9.65%], Bakkt [9.25%], Enovix [9.25%]