
 Login Sign Up


| |||||
 |  | ||||

| 12Stocks.com Market Intelligence |
Best SmallCap Stocks
|
| In a hurry? Small Cap Stock Lists: Performance Trends Table, Stock Charts
Sort Small Cap stocks: Daily, Weekly, Year-to-Date, Market Cap & Trends. Filter Small Cap stocks list by sector: Show all, Tech, Finance, Energy, Staples, Retail, Industrial, Materials, Utilities and HealthCare Filter Small Cap stocks list by size: All Large Medium Small and MicroCap |
| 12Stocks.com Small Cap Stocks Performances & Trends Daily | |||||||||
|
|  The overall Smart Investing & Trading Score is 76 (0-bearish to 100-bullish) which puts Small Cap index in short term neutral to bullish trend. The Smart Investing & Trading Score from previous trading session is 90 and hence a deterioration of trend.
| ||||||||
Here are the Smart Investing & Trading Scores of the most requested small cap stocks at 12Stocks.com (click stock name for detailed review):
|


| 12Stocks.com: Investing in Smallcap Index with Stocks | |
|
The following table helps investors and traders sort through current performance and trends (as measured by Smart Investing & Trading Score) of various
stocks in the Smallcap Index. Quick View: Move mouse or cursor over stock symbol (ticker) to view short-term technical chart and over stock name to view long term chart. Click on  to add stock symbol to your watchlist and to add stock symbol to your watchlist and  to view watchlist. Click on any ticker or stock name for detailed market intelligence report for that stock. to view watchlist. Click on any ticker or stock name for detailed market intelligence report for that stock. |
12Stocks.com Performance of Stocks in Smallcap Index
| Ticker | Stock Name | Watchlist | Category | Recent Price | Smart Investing & Trading Score | Change % | Weekly Change% |
| VAXX | Vaxxinity |   | Health Care | 0.08 | 42 | 45.95% | 58.82% |
| NVAX | Novavax | | Health Care | 13.01 | 75 | -9.65% | 46.51% |
| RBOT | Vicarious Surgical | | Health Care | 0.42 | 74 | 27.93% | 45.62% |
| HROW | Harrow Health | | Health Care | 16.76 | 100 | 3.71% | 44.48% |
| PROK | ProKidney | | Health Care | 4.05 | 80 | 6.99% | 44.31% |
| WKHS | Workhorse Group | | Consumer Staples | 0.24 | 62 | -2.16% | 36.06% |
| MAXN | Maxeon Solar | | Technology | 2.95 | 42 | -8.95% | 35.94% |
| FOSL | Fossil Group | | Consumer Staples | 1.31 | 100 | 5.22% | 35.44% |
| HUMA | Humacyte | | Health Care | 6.33 | 68 | -1.40% | 34.68% |
| MSTR | MicroStrategy | | Technology | 1584.50 | 100 | 10.04% | 34.23% |
| CDZI | Cadiz | | Utilities | 3.11 | 100 | 3.67% | 33.48% |
| MGNX | MacroGenics | | Health Care | 4.37 | 10 | -14.75% | 31.87% |
| PRST | Presto Automation | | Technology | 0.22 | 69 | 31.90% | 29.52% |
| ZURA | Zura Bio | | Health Care | 6.05 | 100 | 0.83% | 29.27% |
| BIRD | Allbirds | | Services & Goods | 0.73 | 49 | -3.80% | 28.40% |
| LPSN | LivePerson | | Technology | 0.73 | 42 | 1.58% | 27.75% |
| EBS | Emergent BioSolutions | | Health Care | 5.55 | 90 | 5.31% | 27.59% |
| PRME | Prime Medicine | | Health Care | 7.08 | 69 | 0.57% | 26.20% |
| COMM | CommScope Holding | | Technology | 1.32 | 100 | 11.86% | 25.71% |
| SPWR | SunPower | | Technology | 2.85 | 42 | -13.37% | 23.91% |
| OMGA | Omega | | Health Care | 2.41 | 69 | 1.26% | 22.96% |
| TELL | Tellurian | | Energy | 0.52 | 64 | -1.11% | 22.95% |
| NG | NovaGold Resources | | Materials | 3.49 | 100 | 6.73% | 22.89% |
| NRIX | Nurix | | Health Care | 16.59 | 100 | 7.73% | 22.80% |
| STOK | Stoke | | Health Care | 13.90 | 88 | -0.93% | 22.79% |


| Too many stocks? View smallcap stocks filtered by marketcap & sector |
| Marketcap: All SmallCap Stocks (default-no microcap), Large, Mid-Range, Small |
| Smallcap Sector: Tech, Finance, Energy, Staples, Retail, Industrial, Materials, & Medical |
|
Get the most comprehensive stock market coverage daily at 12Stocks.com ➞ Best Stocks Today ➞ Best Stocks Weekly ➞ Best Stocks Year-to-Date ➞ Best Stocks Trends ➞  Best Stocks Today 12Stocks.com Best Nasdaq Stocks ➞ Best S&P 500 Stocks ➞ Best Tech Stocks ➞ Best Biotech Stocks ➞ |
| Detailed Overview of SmallCap Stocks |
| SmallCap Technical Overview, Leaders & Laggards, Top SmallCap ETF Funds & Detailed SmallCap Stocks List, Charts, Trends & More |
| Smallcap: Technical Analysis, Trends & YTD Performance | |
| SmallCap segment as represented by
IWM, an exchange-traded fund [ETF], holds basket of thousands of smallcap stocks from across all major sectors of the US stock market. The smallcap index (contains stocks like Riverbed & Sotheby's) is up by 3.67% and is currently underperforming the overall market by -6.9% year-to-date. Below is a quick view of technical charts and trends: | |
 IWM Weekly Chart |
|
| Long Term Trend: Very Good | |
| Medium Term Trend: Very Good | |
 IWM Daily Chart |
|
| Short Term Trend: Good | |
| Overall Trend Score: 76 | |
| YTD Performance: 3.67% | |
| **Trend Scores & Views Are Only For Educational Purposes And Not For Investing | |
| 12Stocks.com: Top Performing Small Cap Index Stocks | ||||||||||||||||||||||||||||||||||||||||||||||||
 The top performing Small Cap Index stocks year to date are
Now, more recently, over last week, the top performing Small Cap Index stocks on the move are


|
||||||||||||||||||||||||||||||||||||||||||||||||
| 12Stocks.com: Investing in Smallcap Index using Exchange Traded Funds | |
|
The following table shows list of key exchange traded funds (ETF) that
help investors track Smallcap index. The following list also includes leveraged ETF funds that track twice or thrice the daily returns of Smallcap indices. Short or inverse ETF funds move in the opposite direction to the index they track and are useful during market pullbacks or during bear markets. Quick View: Move mouse or cursor over ETF symbol (ticker) to view short-term technical chart and over ETF name to view long term chart. Click on ticker or stock name for detailed view. Click on to add stock symbol to your watchlist and to view watchlist. |
12Stocks.com List of ETFs that track Smallcap Index
| Ticker | ETF Name | Watchlist | Recent Price | Smart Investing & Trading Score | Change % | Week % | Year-to-date % |
| IWM | iShares Russell 2000 | | 208.08 | 76 | 0.07 | 1.85 | 3.67% |
| VTWO | Vanguard Russell 2000 ETF | | 84.11 | 71 | 0.00 | 1.8 | 3.71% |
| IJR | iShares Core S&P Small-Cap | | 110.39 | 68 | -0.22 | 1.29 | 1.98% |
| IWN | iShares Russell 2000 Value | | 158.71 | 76 | -0.07 | 1.61 | 2.18% |
| IWO | iShares Russell 2000 Growth | | 265.15 | 63 | -0.75 | 2.01 | 5.13% |
| IJS | iShares S&P Small-Cap 600 Value | | 101.87 | 76 | -0.15 | 1.34 | -1.16% |
| IJT | iShares S&P Small-Cap 600 Growth | | 131.34 | 71 | 0.04 | 1.14 | 4.95% |
| XSLV | PowerShares S&P SmallCap Low Volatil ETF | | 44.48 | 83 | -0.01 | 0.55 | 0.74% |
| SAA | ProShares Ultra SmallCap600 | | 24.90 | 71 | 0.50 | 2.28 | -0.18% |
| SMLV | SPDR SSGA US Small Cap Low Volatil ETF | | 113.28 | 95 | 0.43 | 1.85 | 0.68% |
| SDD | ProShares UltraShort SmallCap600 | | 17.84 | 35 | 0.96 | -2.41 | -3.19% |
| SBB | ProShares Short SmallCap600 | | 15.77 | 25 | 0.41 | -1.14 | -0.98% |
| 12Stocks.com: Charts, Trends, Fundamental Data and Performances of SmallCap Stocks | |
|
We now take in-depth look at all SmallCap stocks including charts, multi-period performances and overall trends (as measured by Smart Investing & Trading Score). One can sort SmallCap stocks (click link to choose) by Daily, Weekly and by Year-to-Date performances. Also, one can sort by size of the company or by market capitalization. |
| Select Your Default Chart Type: | |||||
| |||||
| Click on stock symbol or name for detailed view. Click on to add stock symbol to your watchlist and to view watchlist. Quick View: Move mouse or cursor over "Daily" to quickly view daily technical stock chart and over "Weekly" to view weekly technical stock chart. | |||||

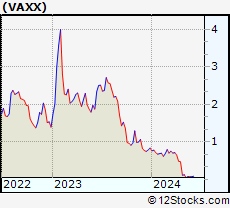 | VAXX Vaxxinity, Inc. |
| Sector: Health Care | |
| SubSector: Biotechnology | |
| MarketCap: 320 Millions | |
| Recent Price: 0.08 Smart Investing & Trading Score: 42 | |
| Day Percent Change: 45.95% Day Change: 0.03 | |
| Week Change: 58.82% Year-to-date Change: -90.4% | |
| VAXX Links: Profile News Message Board | |
| Charts:- Daily , Weekly | |
| Add VAXX to Watchlist: View: Get Complete VAXX Trend Analysis ➞ | |
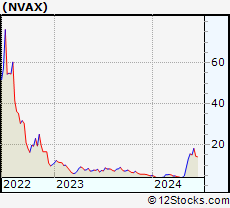 | NVAX Novavax, Inc. |
| Sector: Health Care | |
| SubSector: Biotechnology | |
| MarketCap: 376.185 Millions | |
| Recent Price: 13.01 Smart Investing & Trading Score: 75 | |
| Day Percent Change: -9.65% Day Change: -1.39 | |
| Week Change: 46.51% Year-to-date Change: 171.0% | |
| NVAX Links: Profile News Message Board | |
| Charts:- Daily , Weekly | |
| Add NVAX to Watchlist: View: Get Complete NVAX Trend Analysis ➞ | |
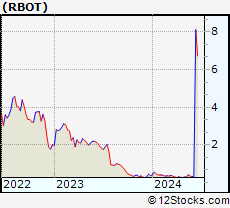 | RBOT Vicarious Surgical Inc. |
| Sector: Health Care | |
| SubSector: Medical Devices | |
| MarketCap: 241 Millions | |
| Recent Price: 0.42 Smart Investing & Trading Score: 74 | |
| Day Percent Change: 27.93% Day Change: 0.09 | |
| Week Change: 45.62% Year-to-date Change: 15.1% | |
| RBOT Links: Profile News Message Board | |
| Charts:- Daily , Weekly | |
| Add RBOT to Watchlist: View: Get Complete RBOT Trend Analysis ➞ | |
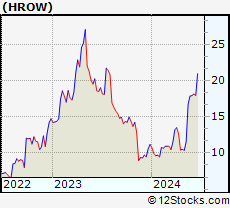 | HROW Harrow Health, Inc. |
| Sector: Health Care | |
| SubSector: Drug Manufacturers - Other | |
| MarketCap: 104.033 Millions | |
| Recent Price: 16.76 Smart Investing & Trading Score: 100 | |
| Day Percent Change: 3.71% Day Change: 0.60 | |
| Week Change: 44.48% Year-to-date Change: 49.6% | |
| HROW Links: Profile News Message Board | |
| Charts:- Daily , Weekly | |
| Add HROW to Watchlist: View: Get Complete HROW Trend Analysis ➞ | |
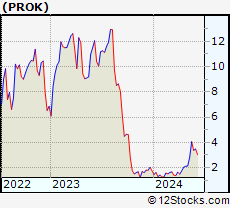 | PROK ProKidney Corp. |
| Sector: Health Care | |
| SubSector: Biotechnology | |
| MarketCap: 2470 Millions | |
| Recent Price: 4.05 Smart Investing & Trading Score: 80 | |
| Day Percent Change: 6.99% Day Change: 0.26 | |
| Week Change: 44.31% Year-to-date Change: 132.4% | |
| PROK Links: Profile News Message Board | |
| Charts:- Daily , Weekly | |
| Add PROK to Watchlist: View: Get Complete PROK Trend Analysis ➞ | |
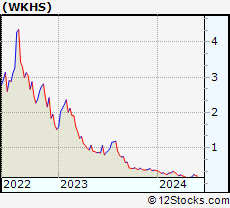 | WKHS Workhorse Group Inc. |
| Sector: Consumer Staples | |
| SubSector: Auto Parts | |
| MarketCap: 129.839 Millions | |
| Recent Price: 0.24 Smart Investing & Trading Score: 62 | |
| Day Percent Change: -2.16% Day Change: -0.01 | |
| Week Change: 36.06% Year-to-date Change: -32.0% | |
| WKHS Links: Profile News Message Board | |
| Charts:- Daily , Weekly | |
| Add WKHS to Watchlist: View: Get Complete WKHS Trend Analysis ➞ | |
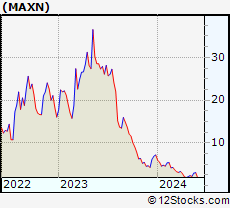 | MAXN Maxeon Solar Technologies, Ltd. |
| Sector: Technology | |
| SubSector: Solar | |
| MarketCap: 88787 Millions | |
| Recent Price: 2.95 Smart Investing & Trading Score: 42 | |
| Day Percent Change: -8.95% Day Change: -0.29 | |
| Week Change: 35.94% Year-to-date Change: -58.9% | |
| MAXN Links: Profile News Message Board | |
| Charts:- Daily , Weekly | |
| Add MAXN to Watchlist: View: Get Complete MAXN Trend Analysis ➞ | |
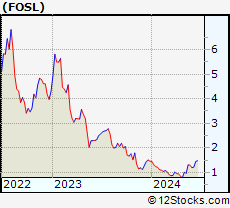 | FOSL Fossil Group, Inc. |
| Sector: Consumer Staples | |
| SubSector: Textile - Apparel Footwear & Accessories | |
| MarketCap: 215.87 Millions | |
| Recent Price: 1.31 Smart Investing & Trading Score: 100 | |
| Day Percent Change: 5.22% Day Change: 0.06 | |
| Week Change: 35.44% Year-to-date Change: -10.3% | |
| FOSL Links: Profile News Message Board | |
| Charts:- Daily , Weekly | |
| Add FOSL to Watchlist: View: Get Complete FOSL Trend Analysis ➞ | |
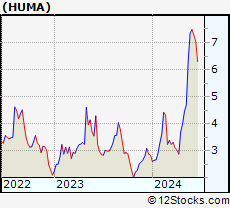 | HUMA Humacyte, Inc. |
| Sector: Health Care | |
| SubSector: Biotechnology | |
| MarketCap: 297 Millions | |
| Recent Price: 6.33 Smart Investing & Trading Score: 68 | |
| Day Percent Change: -1.40% Day Change: -0.09 | |
| Week Change: 34.68% Year-to-date Change: 122.9% | |
| HUMA Links: Profile News Message Board | |
| Charts:- Daily , Weekly | |
| Add HUMA to Watchlist: View: Get Complete HUMA Trend Analysis ➞ | |
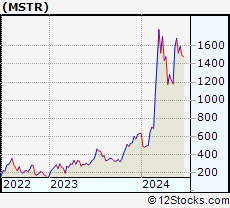 | MSTR MicroStrategy Incorporated |
| Sector: Technology | |
| SubSector: Application Software | |
| MarketCap: 1164.52 Millions | |
| Recent Price: 1584.50 Smart Investing & Trading Score: 100 | |
| Day Percent Change: 10.04% Day Change: 144.52 | |
| Week Change: 34.23% Year-to-date Change: 150.9% | |
| MSTR Links: Profile News Message Board | |
| Charts:- Daily , Weekly | |
| Add MSTR to Watchlist: View: Get Complete MSTR Trend Analysis ➞ | |
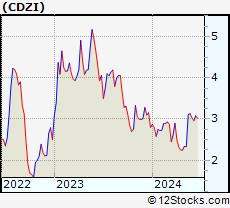 | CDZI Cadiz Inc. |
| Sector: Utilities | |
| SubSector: Water Utilities | |
| MarketCap: 265.502 Millions | |
| Recent Price: 3.11 Smart Investing & Trading Score: 100 | |
| Day Percent Change: 3.67% Day Change: 0.11 | |
| Week Change: 33.48% Year-to-date Change: 11.1% | |
| CDZI Links: Profile News Message Board | |
| Charts:- Daily , Weekly | |
| Add CDZI to Watchlist: View: Get Complete CDZI Trend Analysis ➞ | |
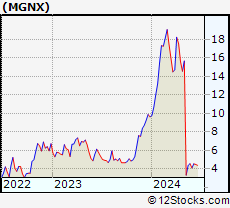 | MGNX MacroGenics, Inc. |
| Sector: Health Care | |
| SubSector: Biotechnology | |
| MarketCap: 262.785 Millions | |
| Recent Price: 4.37 Smart Investing & Trading Score: 10 | |
| Day Percent Change: -14.75% Day Change: -0.75 | |
| Week Change: 31.87% Year-to-date Change: -54.6% | |
| MGNX Links: Profile News Message Board | |
| Charts:- Daily , Weekly | |
| Add MGNX to Watchlist: View: Get Complete MGNX Trend Analysis ➞ | |
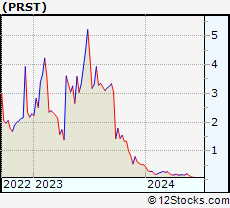 | PRST Presto Automation Inc. |
| Sector: Technology | |
| SubSector: Software - Application | |
| MarketCap: 238 Millions | |
| Recent Price: 0.22 Smart Investing & Trading Score: 69 | |
| Day Percent Change: 31.90% Day Change: 0.05 | |
| Week Change: 29.52% Year-to-date Change: -59.3% | |
| PRST Links: Profile News Message Board | |
| Charts:- Daily , Weekly | |
| Add PRST to Watchlist: View: Get Complete PRST Trend Analysis ➞ | |
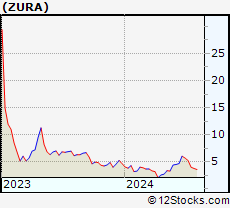 | ZURA Zura Bio Limited |
| Sector: Health Care | |
| SubSector: Biotechnology | |
| MarketCap: 242 Millions | |
| Recent Price: 6.05 Smart Investing & Trading Score: 100 | |
| Day Percent Change: 0.83% Day Change: 0.05 | |
| Week Change: 29.27% Year-to-date Change: 29.1% | |
| ZURA Links: Profile News Message Board | |
| Charts:- Daily , Weekly | |
| Add ZURA to Watchlist: View: Get Complete ZURA Trend Analysis ➞ | |
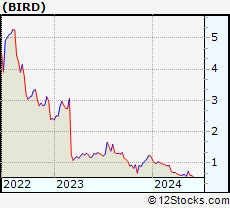 | BIRD Allbirds, Inc. |
| Sector: Services & Goods | |
| SubSector: Apparel Retail | |
| MarketCap: 184 Millions | |
| Recent Price: 0.73 Smart Investing & Trading Score: 49 | |
| Day Percent Change: -3.80% Day Change: -0.03 | |
| Week Change: 28.4% Year-to-date Change: -40.5% | |
| BIRD Links: Profile News Message Board | |
| Charts:- Daily , Weekly | |
| Add BIRD to Watchlist: View: Get Complete BIRD Trend Analysis ➞ | |
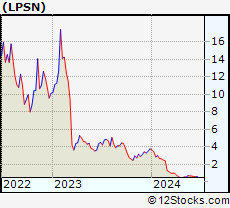 | LPSN LivePerson, Inc. |
| Sector: Technology | |
| SubSector: Business Software & Services | |
| MarketCap: 1070.58 Millions | |
| Recent Price: 0.73 Smart Investing & Trading Score: 42 | |
| Day Percent Change: 1.58% Day Change: 0.01 | |
| Week Change: 27.75% Year-to-date Change: -80.7% | |
| LPSN Links: Profile News Message Board | |
| Charts:- Daily , Weekly | |
| Add LPSN to Watchlist: View: Get Complete LPSN Trend Analysis ➞ | |
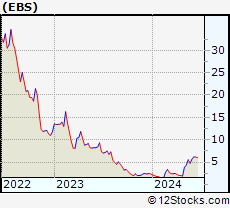 | EBS Emergent BioSolutions Inc. |
| Sector: Health Care | |
| SubSector: Biotechnology | |
| MarketCap: 2417.65 Millions | |
| Recent Price: 5.55 Smart Investing & Trading Score: 90 | |
| Day Percent Change: 5.31% Day Change: 0.28 | |
| Week Change: 27.59% Year-to-date Change: 131.3% | |
| EBS Links: Profile News Message Board | |
| Charts:- Daily , Weekly | |
| Add EBS to Watchlist: View: Get Complete EBS Trend Analysis ➞ | |
 | PRME Prime Medicine, Inc. |
| Sector: Health Care | |
| SubSector: Biotechnology | |
| MarketCap: 1440 Millions | |
| Recent Price: 7.08 Smart Investing & Trading Score: 69 | |
| Day Percent Change: 0.57% Day Change: 0.04 | |
| Week Change: 26.2% Year-to-date Change: -22.4% | |
| PRME Links: Profile News Message Board | |
| Charts:- Daily , Weekly | |
| Add PRME to Watchlist: View: Get Complete PRME Trend Analysis ➞ | |
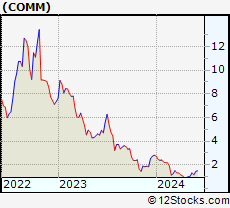 | COMM CommScope Holding Company, Inc. |
| Sector: Technology | |
| SubSector: Communication Equipment | |
| MarketCap: 1614.29 Millions | |
| Recent Price: 1.32 Smart Investing & Trading Score: 100 | |
| Day Percent Change: 11.86% Day Change: 0.14 | |
| Week Change: 25.71% Year-to-date Change: -53.2% | |
| COMM Links: Profile News Message Board | |
| Charts:- Daily , Weekly | |
| Add COMM to Watchlist: View: Get Complete COMM Trend Analysis ➞ | |
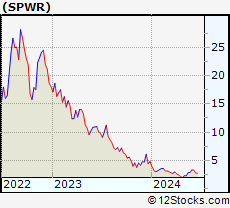 | SPWR SunPower Corporation |
| Sector: Technology | |
| SubSector: Semiconductor - Specialized | |
| MarketCap: 1202.6 Millions | |
| Recent Price: 2.85 Smart Investing & Trading Score: 42 | |
| Day Percent Change: -13.37% Day Change: -0.44 | |
| Week Change: 23.91% Year-to-date Change: -41.0% | |
| SPWR Links: Profile News Message Board | |
| Charts:- Daily , Weekly | |
| Add SPWR to Watchlist: View: Get Complete SPWR Trend Analysis ➞ | |
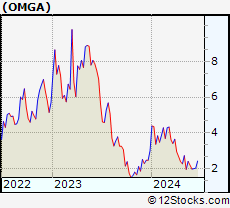 | OMGA Omega Therapeutics, Inc. |
| Sector: Health Care | |
| SubSector: Biotechnology | |
| MarketCap: 304 Millions | |
| Recent Price: 2.41 Smart Investing & Trading Score: 69 | |
| Day Percent Change: 1.26% Day Change: 0.03 | |
| Week Change: 22.96% Year-to-date Change: -19.9% | |
| OMGA Links: Profile News Message Board | |
| Charts:- Daily , Weekly | |
| Add OMGA to Watchlist: View: Get Complete OMGA Trend Analysis ➞ | |
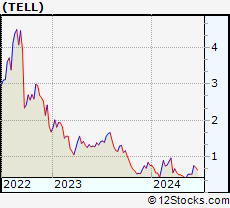 | TELL Tellurian Inc. |
| Sector: Energy | |
| SubSector: Oil & Gas Drilling & Exploration | |
| MarketCap: 245.339 Millions | |
| Recent Price: 0.52 Smart Investing & Trading Score: 64 | |
| Day Percent Change: -1.11% Day Change: -0.01 | |
| Week Change: 22.95% Year-to-date Change: -31.8% | |
| TELL Links: Profile News Message Board | |
| Charts:- Daily , Weekly | |
| Add TELL to Watchlist: View: Get Complete TELL Trend Analysis ➞ | |
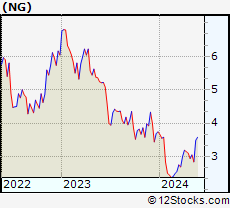 | NG NovaGold Resources Inc. |
| Sector: Materials | |
| SubSector: Gold | |
| MarketCap: 2499.49 Millions | |
| Recent Price: 3.49 Smart Investing & Trading Score: 100 | |
| Day Percent Change: 6.73% Day Change: 0.22 | |
| Week Change: 22.89% Year-to-date Change: -6.7% | |
| NG Links: Profile News Message Board | |
| Charts:- Daily , Weekly | |
| Add NG to Watchlist: View: Get Complete NG Trend Analysis ➞ | |
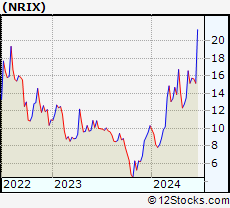 | NRIX Nurix Therapeutics, Inc. |
| Sector: Health Care | |
| SubSector: Biotechnology | |
| MarketCap: 16787 Millions | |
| Recent Price: 16.59 Smart Investing & Trading Score: 100 | |
| Day Percent Change: 7.73% Day Change: 1.19 | |
| Week Change: 22.8% Year-to-date Change: 60.6% | |
| NRIX Links: Profile News Message Board | |
| Charts:- Daily , Weekly | |
| Add NRIX to Watchlist: View: Get Complete NRIX Trend Analysis ➞ | |
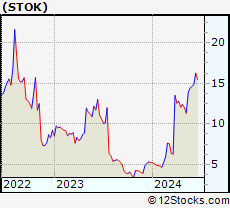 | STOK Stoke Therapeutics, Inc. |
| Sector: Health Care | |
| SubSector: Biotechnology | |
| MarketCap: 772.485 Millions | |
| Recent Price: 13.90 Smart Investing & Trading Score: 88 | |
| Day Percent Change: -0.93% Day Change: -0.13 | |
| Week Change: 22.79% Year-to-date Change: 164.3% | |
| STOK Links: Profile News Message Board | |
| Charts:- Daily , Weekly | |
| Add STOK to Watchlist: View: Get Complete STOK Trend Analysis ➞ | |
| Too many stocks? View smallcap stocks filtered by marketcap & sector |
| Marketcap: All SmallCap Stocks (default-no microcap), Large, Mid-Range, Small & MicroCap |
| Sector: Tech, Finance, Energy, Staples, Retail, Industrial, Materials, Utilities & Medical |
|
Best Stocks Today 12Stocks.com |
© 2024 12Stocks.com Terms & Conditions Privacy Contact Us
All Information Provided Only For Education And Not To Be Used For Investing or Trading. See Terms & Conditions


One More Thing ... Get Best Stocks Delivered Daily!
Never Ever Miss A Move With Our Top Ten Stocks Lists
Find Best Stocks In Any Market - Bull or Bear Market
Take A Peek At Our Top Ten Stocks Lists: Daily, Weekly, Year-to-Date & Top Trends
Find Best Stocks In Any Market - Bull or Bear Market
Take A Peek At Our Top Ten Stocks Lists: Daily, Weekly, Year-to-Date & Top Trends
Smallcap Stocks With Best Up Trends [0-bearish to 100-bullish]: CommScope Holding[100], Coeur Mining[100], Hecla Mining[100], MicroStrategy [100], Enovix [100], Rayonier Advanced[100], Nurix [100], Energy Fuels[100], NovaGold Resources[100], Piedmont Lithium[100], Wave Life[100]
Best Smallcap Stocks Year-to-Date:
CareMax [495.88%], Bakkt [413.9%], Janux [338.34%], Viking [260.02%], Alpine Immune[241.23%], Longboard [238.63%], Avidity Biosciences[226.33%], Super Micro[212.35%], Arcutis Bio[184.83%], Sweetgreen [180.97%], Novavax [171.04%] Best Smallcap Stocks This Week:
Vaxxinity [58.82%], Novavax [46.51%], Vicarious Surgical[45.62%], Harrow Health[44.48%], ProKidney [44.31%], Workhorse Group[36.06%], Maxeon Solar[35.94%], Fossil Group[35.44%], Humacyte [34.68%], MicroStrategy [34.23%], Cadiz [33.48%] Best Smallcap Stocks Daily:
Vaxxinity [45.95%], Presto Automation[31.90%], Vicarious Surgical[27.93%], Orchestra BioMed[12.77%], CommScope Holding[11.86%], Coeur Mining[11.57%], Hecla Mining[11.11%], MicroStrategy [10.04%], Tenaya [9.65%], Bakkt [9.25%], Enovix [9.25%]