12Stocks.com
Market
Intelligence

Stock Charts, Performance & Trend Analysis for PRF
PowerShares FTSE US 1000

PRF
Year-to-Date: 5.7%
This Week: 1.4%
PRF Stock Charts
See Daily ➞
See Weekly ➞
See Monthly ➞

PRF
Year-to-Date (YTD) Return: 5.68%
 
All about FANG Stocks ➞
Popular Trends!AAPL ➞ MSFT ➞ TSLA ➞
S&P 500 ➞ AMZN ➞ GOOGL ➞ FB ➞
Long Term Trend: Very Good
Medium Term Trend: Not Good
Short Term Trend: Very Good

Overall Trend Score:
68 Out Of 100
Bottomline: Neutral to Bullish Trend


Get YOUR Stock Review:

April 27, 2024 - The year-to-date (YTD) performance of 1000 (PRF) ETF is up 5.68% but is underperforming the overall stock market by -0.46%.

Recently, the weekly returns of 1000 (PRF) is up 1.39% but is underperforming the overall market by -1.28%.

New! 12Stocks.com introduces Big Monthly, Weekly & Daily Charts
View PRF Stock Charts      Daily    Weekly    Monthly

Although long term and short term trends for PowerShares FTSE US 1000 are good, the mid term i.e weekly trends are deteriorating.

The overall 12Stocks.com Smart Investing & Trading Score is 68 (measures stock trend from 0-bearish to 100-bullish) which puts PRF in short term neutral to bullish trend.

The Smart Investing & Trading Score from previous trading session is 61 and hence a minor improvement of trend. Scroll down for key technical charts, support & resistance levels and analysis for .

Stock Analysis for PRF
Name: PowerShares FTSE US 1000
Sector:
SubSector:
In A Glance
PRF Technical Trend Chart View

Daily PRF Technical Chart
Add PRF To Watch List   View List
12Stocks.com
Short Term Trend Analysis for
68 / 100
The current technical trend score is 68 in a scale where 0 is bearish and 100 is bullish.
The technical trend score from previous session is 61.
Trend score updated daily. Not to be used for investing.
Recent Price: 37.20    
MarketCap: Millions
Day Percent Change: 0.19%
Day Change: 0.07
Week Change: 1.39%
Year-to-date Change: 5.68%

Technical Levels: For the trading inclined, the following are the key levels of resistance (ceiling) and support (floor) for PRF. Ceiling and floor levels are stock prices at which the stock trend gets resistance or support respectively and traders have an eye on them. Long term levels are more important. Stocks that have broken thru their resistance or supports convincingly tend to have stronger trends (confirm with charts above visually).
Key Levels for PRF
 Short TermWeeklyLong Term
Resistance (Ceiling)37.237.3938.55
Support (Floor)36.836.3636.79

The table below shows stocks similar to PowerShares FTSE US 1000, i.e, from same subsector or sector along with year-to-date (YTD), weekly & daily performaces for comparison. Usually, stocks from similar sector tend to move together but companies that have innovative products, services or good management tend to outperform. Quick View: Move mouse or cursor over stock symbol (ticker) to view short-term technical chart and over stock name to view long term chart. Click on ticker or stock name for detailed view. Click on to add stock symbol to your watchlist and to view watchlist.
TickerStock NameWatchlistCategoryRecent PriceChange %Weekly Change%YTD Change%
GOOGAlphabet Inc. Tech Services173.699.9711.5423.25%
WMTWalmart Inc. Retail60.16-0.081.0614.48%
JNJJohnson & Johnson Drugs146.14-0.46-1.2-6.76%
JPMJPMorgan Chase & Co. Banks193.490.064.1413.75%
PGThe Procter & Gamble Company Staples161.29-0.781.9910.07%
VZVerizon Communications Inc. Telecom39.681.17-25.25%
TAT&T Inc. Telecom16.751.031.45-0.18%
INTCIntel Corporation Semiconductor31.88-9.20-6.78-36.56%
UNHUnitedHealth Group Incorporated Insurance495.350.30-1.15-5.91%
MRKMerck & Co., Inc. Drugs131.200.374.3120.34%
BACBank of America Corporation Banks37.83-0.212.3312.36%
HDThe Home Depot, Inc. Retail335.090.94-0.08-3.31%
DISThe Walt Disney Company Media112.73-0.040.1124.85%
PFEPfizer Inc. Drugs25.400.55-2.31-11.77%
CMCSAComcast Corporation Media38.571.85-4.15-12.04%
XOMExxon Mobil Corporation Big Oil117.96-2.78-1.617.98%
COSTCostco Wholesale Corporation Retail729.181.012.7710.47%
LLYEli Lilly and Company Drugs733.511.190.9925.83%
WFCWells Fargo & Company Banks59.91-0.03-0.7321.72%
ABTAbbott Laboratories Instrument107.530.630.23-2.31%
MCDMcDonald s Corporation Restaurants273.09-0.910.4-7.9%
CVXChevron Corporation Big Oil165.890.373.6811.22%
AMGNAmgen Inc. Biotechnology269.980.220.39-6.26%
NKENIKE, Inc. Retail94.120.19-0.43-13.31%
BMYBristol-Myers Squibb Company Drugs44.850.34-8.34-12.59%
You can find complete coverage in the following
Related Pages: 2024 Best Performing Stocks, 2024 Best Performing ETF Funds

Technical Levels: For the trading inclined, the following are the key levels of resistance (ceiling) and support (floor) for PRF. Ceiling and floor levels are stock prices at which the stock trend gets resistance or support respectively. Stocks & their trends tend to pause at these levels and hence traders have an eye on them.

Long term levels are more important. Stocks that have broken thru their resistance or support levels convincingly tend to have stronger trends (confirm with charts above visually).
Key Technical Levels for PRF
 Short TermWeeklyLong Term
Resistance (Ceiling)37.237.3938.55
Support (Floor)36.836.3636.79

        
RELATIVE PERFORMANCE OF
PowerShares FTSE US 1000
Vs
THE MARKET
Relative performance of PowerShares FTSE US 1000
How is PRF faring versus the market [S&P 500] ? Is it lagging or leading ? How is its relative performance ?
Symbol Day Change Week Change Year-to-Date Change
VTI 0.93% 2.67% 6.14%
PRF 0.19% 1.39% 5.68%

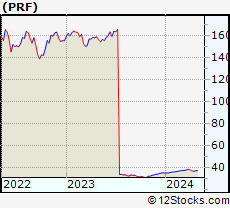
PRF Daily Chart

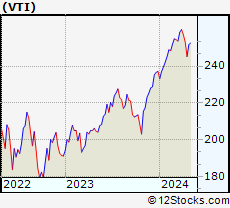
Total Market Daily Chart
Year to date returns PRF is underperforming the market by -0.46%
This week, PRF is underperforming the market by -1.28%


List Of ETF Funds Similar To PowerShares FTSE US 1000

The table below shows ETFs (Exchange Traded Funds) similar to PowerShares FTSE US 1000, i.e, from same sector along with year-to-date (YTD), weekly & daily performaces for comparison. Usually, ETFs and associated stocks from similar sector tend to move together but companies that have innovative products, services or good management tend to outperform. Move mouse or cursor over ETF symbol to view short-term technical chart and over ETF name to view long term chart. Click on to add ETF symbol to your watchlist and to view watchlist.
TickerStock NameWatchlistCategoryRecent PriceChange %Weekly Change%YTD Change%
DIADIAMONDS Dow  General382.310.360.661.44%
IWNiShares Russell 2000 Value Index General151.140.642.27-2.7%
IWSiShares Russell Midcap Value Index General119.990.171.993.18%
EFViShares Foreign LargeCap Value Global53.790.581.843.24%
VYMVanguard High Dividend General117.37-0.201.235.14%
IWMiShares Russell 2000 Index General198.390.972.72-1.16%
SRTYProShares Triple Short Russel 2000 General30.21-2.92-7.7-0.03%
TWMProShares UltraShort Russell 2000  General11.81-1.99-5.291.37%
URTYProShares UltraPro Russel2000 General41.612.927.94-10.27%
UWMProShares Ultra Russell 2000  General36.052.015.44-5.26%
SMDDProShares Triple Short Midcap General11.83-0.50-5.83-12.13%
MZZProShares Double Short MidCap400 General11.68-0.60-4.03-7.09%
MDYMidCap SPDRs General529.380.292.144.34%
UMDDProShares UltraPro Midcap General23.961.016.197.35%
QQQNASDAQ 100  General431.001.543.945.25%
SQQQProShares Triple Short Nasdaq 100 General11.43-4.75-10.98-15.02%
SDOWProShares Triple Short Dow 30 General17.87-1.16-1.81-2.83%
SPXUProShares Triple Short S&P 500 General35.50-2.79-7.38-17.44%
SDSProShares Double Short S&P 500 General26.53-1.89-4.91-11.33%
VXXS&P 500 VIX Short-Term Futures ETN General13.43-3.24-13.13-13.47%
Get the most comprehensive stock market coverage daily at 12Stocks.com ➞
Best Stocks Today ➞
Best Stocks Weekly ➞
Best Stocks Year-to-Date ➞
Best Stocks Trends ➞


Best Stocks Today
12Stocks.com


Best Nasdaq Stocks ➞
Best S&P 500 Stocks ➞
Best Tech Stocks ➞
Best Biotech Stocks ➞
 

© 2024 12Stocks.com       Terms & Conditions   Privacy   Contact Us
All Information Provided Only For Education And Not To Be Used For Investing or Trading. See Terms & Conditions

 WatchListmy12Stocks
Best Stocks Today