
 Login Sign Up


| |||||
 |  | ||||

| 12Stocks.com Market Intelligence |
Best Transport Stocks
| In a hurry? Transport Stocks Lists: Performance Trends Table, Stock Charts
Sort Transport stocks: Daily, Weekly, Year-to-Date, Market Cap & Trends. Filter Transport stocks list by size: All Transport Large Mid-Range Small |
| 12Stocks.com Transport Stocks Performances & Trends Daily | |||||||||
|
|  The overall Smart Investing & Trading Score is 32 (0-bearish to 100-bullish) which puts Transport sector in short term bearish to neutral trend. The Smart Investing & Trading Score from previous trading session is 25 and hence an improvement of trend.
| ||||||||
Here are the Smart Investing & Trading Scores of the most requested Transport stocks at 12Stocks.com (click stock name for detailed review):
|


| Consider signing up for our daily 12Stocks.com "Best Stocks Newsletter". You will never ever miss a big stock move again! |
| 12Stocks.com: Investing in Transport sector with Stocks | |
|
The following table helps investors and traders sort through current performance and trends (as measured by Smart Investing & Trading Score) of various
stocks in the Transport sector. Quick View: Move mouse or cursor over stock symbol (ticker) to view short-term Technical chart and over stock name to view long term chart. Click on  to add stock symbol to your watchlist and to add stock symbol to your watchlist and  to view watchlist. Click on any ticker or stock name for detailed market intelligence report for that stock. to view watchlist. Click on any ticker or stock name for detailed market intelligence report for that stock. |
12Stocks.com Performance of Stocks in Transport Sector
| Ticker | Stock Name | Watchlist | Category | Recent Price | Smart Investing & Trading Score | Change % | Weekly Change% |
| CHRW | C.H. Robinson |   | Air Delivery | 81.20 | 100 | 0.33% | 15.64% |
| CAR | Avis Budget | | Rental | 115.60 | 93 | 1.61% | 14.74% |
| WLFC | Willis Lease | | Rental | 55.99 | 100 | 7.06% | 14.15% |
| AZUL | Azul S.A | | Airlines | 6.42 | 49 | 8.63% | 13.03% |
| TRN | Trinity Industries | | Railroads | 30.44 | 100 | 1.30% | 12.16% |
| FTAI | Fortress ation | | Rental | 78.32 | 100 | 3.72% | 10.70% |
| KNOP | KNOT Offshore | | Shipping | 5.41 | 74 | 0.00% | 8.42% |
| HUBG | Hub | | Air Delivery | 42.54 | 87 | 0.61% | 6.54% |
| CMRE | Costamare | | Shipping | 12.48 | 95 | 0.97% | 5.94% |
| GOGL | Golden Ocean | | Shipping | 14.79 | 100 | 0.89% | 5.27% |
| OSG | Overseas Shipholding | | Shipping | 6.32 | 90 | -0.94% | 4.81% |
| SAVE | Spirit Airlines | | Airlines | 3.71 | 52 | 0.82% | 4.80% |
| WERN | Werner Enterprises | | Trucking | 36.31 | 59 | 1.59% | 4.52% |
| MATX | Matson | | Shipping | 113.36 | 70 | 3.90% | 4.06% |
| HTLD | Heartland Express | | Trucking | 10.77 | 59 | 1.70% | 3.96% |
| FRO | Frontline | | Shipping | 24.74 | 95 | 0.69% | 3.95% |
| GNK | Genco Shipping | | Shipping | 22.26 | 95 | 0.41% | 3.29% |
| DAL | Delta Air | | Airlines | 51.55 | 100 | 1.02% | 3.27% |
| ASC | Ardmore Shipping | | Shipping | 17.42 | 100 | 0.87% | 3.14% |
| SNDR | Schneider National | | Trucking | 22.02 | 74 | 2.32% | 3.14% |
| CAAP | Corporacion America | | Air , Other | 17.32 | 95 | 0.99% | 3.10% |
| UHAL | AMERCO | | Rental | 66.85 | 100 | 2.28% | 2.97% |
| MRTN | Marten | | Trucking | 17.44 | 74 | 1.28% | 2.95% |
| TK | Teekay | | Shipping | 7.71 | 90 | -0.13% | 2.80% |
| LPG | Dorian LPG | | Shipping | 42.89 | 90 | 0.59% | 2.66% |
| For chart view version of above stock list: Chart View ➞ 0 - 25 , 25 - 50 , 50 - 75 , 75 - 100 | ||
 | Click To Change The Sort Order: By Market Cap or Company Size Performance: Year-to-date, Week and Day |  |
|
Get the most comprehensive stock market coverage daily at 12Stocks.com ➞ Best Stocks Today ➞ Best Stocks Weekly ➞ Best Stocks Year-to-Date ➞ Best Stocks Trends ➞  Best Stocks Today 12Stocks.com Best Nasdaq Stocks ➞ Best S&P 500 Stocks ➞ Best Tech Stocks ➞ Best Biotech Stocks ➞ |
| Detailed Overview of Transport Stocks |
| Transport Technical Overview, Leaders & Laggards, Top Transport ETF Funds & Detailed Transport Stocks List, Charts, Trends & More |
| Transport Sector: Technical Analysis, Trends & YTD Performance | |
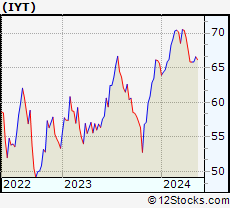
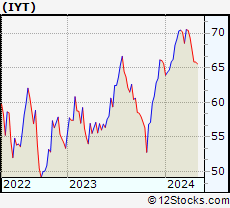
| Transport sector is composed of stocks
from air delivery, shipping, trucking, railroads
and airline subsectors. Transport sector, as represented by IYT, an exchange-traded fund [ETF] that holds basket of Transport stocks (e.g, FedEx, United Airlines) is up by 0.35% and is currently underperforming the overall market by -6.53% year-to-date. Below is a quick view of Technical charts and trends: |
|
 IYT Weekly Chart |
|
| Long Term Trend: Not Good | |
| Medium Term Trend: Not Good | |
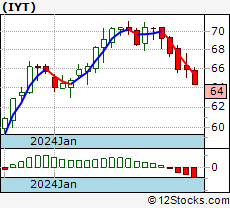
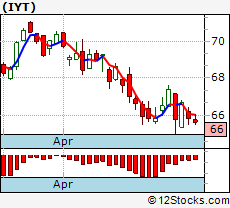 IYT Daily Chart |
|
| Short Term Trend: Very Good | |
| Overall Trend Score: 32 | |
| YTD Performance: 0.35% | |
| **Trend Scores & Views Are Only For Educational Purposes And Not For Investing | |
| 12Stocks.com: Top Performing Transport Sector Stocks | ||||||||||||||||||||||||||||||||||||||||||||||||
 The top performing Transport sector stocks year to date are
Now, more recently, over last week, the top performing Transport sector stocks on the move are


|
||||||||||||||||||||||||||||||||||||||||||||||||
| 12Stocks.com: Investing in Transport Sector using Exchange Traded Funds | |
|
The following table shows list of key exchange traded funds (ETF) that
help investors track Transport Index. For detailed view, check out our ETF Funds section of our website. Quick View: Move mouse or cursor over ETF symbol (ticker) to view short-term Technical chart and over ETF name to view long term chart. Click on ticker or stock name for detailed view. Click on to add stock symbol to your watchlist and to view watchlist. |
12Stocks.com List of ETFs that track Transport Index
| Ticker | ETF Name | Watchlist | Recent Price | Smart Investing & Trading Score | Change % | Week % | Year-to-date % |
| IYT | Transportation | | 65.84 | 32 | 0.63 | 0.03 | 0.35% |
| XTN | Transportation | | 78.31 | 17 | 0.85 | 1.35 | -6.2% |
| FTXR | Transportation | | 30.88 | 25 | 0.32 | -0.43 | 2.9% |
| JETS | Global Jets | | 20.46 | 53 | 0.00 | -0.05 | 7.51% |
| 12Stocks.com: Charts, Trends, Fundamental Data and Performances of Transport Stocks | |
|
We now take in-depth look at all Transport stocks including charts, multi-period performances and overall trends (as measured by Smart Investing & Trading Score). One can sort Transport stocks (click link to choose) by Daily, Weekly and by Year-to-Date performances. Also, one can sort by size of the company or by market capitalization. |
| Select Your Default Chart Type: | |||||
| |||||
| Click on stock symbol or name for detailed view. Click on to add stock symbol to your watchlist and to view watchlist. Quick View: Move mouse or cursor over "Daily" to quickly view daily Technical stock chart and over "Weekly" to view weekly Technical stock chart. | |||||
 | CHRW C.H. Robinson Worldwide, Inc. |
| Sector: Transports | |
| SubSector: Air Delivery & Freight Services | |
| MarketCap: 9194.78 Millions | |
| Recent Price: 81.20 Smart Investing & Trading Score: 100 | |
| Day Percent Change: 0.33% Day Change: 0.27 | |
| Week Change: 15.64% Year-to-date Change: -6.0% | |
| CHRW Links: Profile News Message Board | |
| Charts:- Daily , Weekly | |
| Add CHRW to Watchlist: View: Get Complete CHRW Trend Analysis ➞ | |
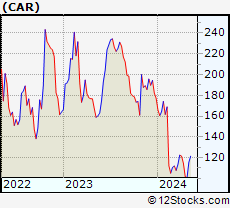 | CAR Avis Budget Group, Inc. |
| Sector: Transports | |
| SubSector: Rental & Leasing Services | |
| MarketCap: 1020.44 Millions | |
| Recent Price: 115.60 Smart Investing & Trading Score: 93 | |
| Day Percent Change: 1.61% Day Change: 1.83 | |
| Week Change: 14.74% Year-to-date Change: -34.8% | |
| CAR Links: Profile News Message Board | |
| Charts:- Daily , Weekly | |
| Add CAR to Watchlist: View: Get Complete CAR Trend Analysis ➞ | |
 | WLFC Willis Lease Finance Corporation |
| Sector: Transports | |
| SubSector: Rental & Leasing Services | |
| MarketCap: 122.044 Millions | |
| Recent Price: 55.99 Smart Investing & Trading Score: 100 | |
| Day Percent Change: 7.06% Day Change: 3.69 | |
| Week Change: 14.15% Year-to-date Change: 14.6% | |
| WLFC Links: Profile News Message Board | |
| Charts:- Daily , Weekly | |
| Add WLFC to Watchlist: View: Get Complete WLFC Trend Analysis ➞ | |
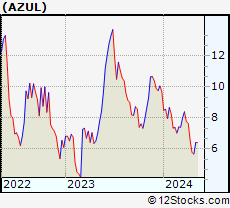 | AZUL Azul S.A. |
| Sector: Transports | |
| SubSector: Major Airlines | |
| MarketCap: 1289.85 Millions | |
| Recent Price: 6.42 Smart Investing & Trading Score: 49 | |
| Day Percent Change: 8.63% Day Change: 0.51 | |
| Week Change: 13.03% Year-to-date Change: -33.8% | |
| AZUL Links: Profile News Message Board | |
| Charts:- Daily , Weekly | |
| Add AZUL to Watchlist: View: Get Complete AZUL Trend Analysis ➞ | |
 | TRN Trinity Industries, Inc. |
| Sector: Transports | |
| SubSector: Railroads | |
| MarketCap: 2058.22 Millions | |
| Recent Price: 30.44 Smart Investing & Trading Score: 100 | |
| Day Percent Change: 1.30% Day Change: 0.39 | |
| Week Change: 12.16% Year-to-date Change: 14.5% | |
| TRN Links: Profile News Message Board | |
| Charts:- Daily , Weekly | |
| Add TRN to Watchlist: View: Get Complete TRN Trend Analysis ➞ | |
 | FTAI Fortress Transportation and Infrastructure Investors LLC |
| Sector: Transports | |
| SubSector: Rental & Leasing Services | |
| MarketCap: 758.344 Millions | |
| Recent Price: 78.32 Smart Investing & Trading Score: 100 | |
| Day Percent Change: 3.72% Day Change: 2.81 | |
| Week Change: 10.7% Year-to-date Change: 68.8% | |
| FTAI Links: Profile News Message Board | |
| Charts:- Daily , Weekly | |
| Add FTAI to Watchlist: View: Get Complete FTAI Trend Analysis ➞ | |
 | KNOP KNOT Offshore Partners LP |
| Sector: Transports | |
| SubSector: Shipping | |
| MarketCap: 349.214 Millions | |
| Recent Price: 5.41 Smart Investing & Trading Score: 74 | |
| Day Percent Change: 0.00% Day Change: 0.00 | |
| Week Change: 8.42% Year-to-date Change: -6.1% | |
| KNOP Links: Profile News Message Board | |
| Charts:- Daily , Weekly | |
| Add KNOP to Watchlist: View: Get Complete KNOP Trend Analysis ➞ | |
 | HUBG Hub Group, Inc. |
| Sector: Transports | |
| SubSector: Air Delivery & Freight Services | |
| MarketCap: 1503.88 Millions | |
| Recent Price: 42.54 Smart Investing & Trading Score: 87 | |
| Day Percent Change: 0.61% Day Change: 0.26 | |
| Week Change: 6.54% Year-to-date Change: -53.7% | |
| HUBG Links: Profile News Message Board | |
| Charts:- Daily , Weekly | |
| Add HUBG to Watchlist: View: Get Complete HUBG Trend Analysis ➞ | |
 | CMRE Costamare Inc. |
| Sector: Transports | |
| SubSector: Shipping | |
| MarketCap: 492.214 Millions | |
| Recent Price: 12.48 Smart Investing & Trading Score: 95 | |
| Day Percent Change: 0.97% Day Change: 0.12 | |
| Week Change: 5.94% Year-to-date Change: 19.9% | |
| CMRE Links: Profile News Message Board | |
| Charts:- Daily , Weekly | |
| Add CMRE to Watchlist: View: Get Complete CMRE Trend Analysis ➞ | |
 | GOGL Golden Ocean Group Limited |
| Sector: Transports | |
| SubSector: Shipping | |
| MarketCap: 446.614 Millions | |
| Recent Price: 14.79 Smart Investing & Trading Score: 100 | |
| Day Percent Change: 0.89% Day Change: 0.13 | |
| Week Change: 5.27% Year-to-date Change: 51.5% | |
| GOGL Links: Profile News Message Board | |
| Charts:- Daily , Weekly | |
| Add GOGL to Watchlist: View: Get Complete GOGL Trend Analysis ➞ | |
 | OSG Overseas Shipholding Group, Inc. |
| Sector: Transports | |
| SubSector: Shipping | |
| MarketCap: 184.814 Millions | |
| Recent Price: 6.32 Smart Investing & Trading Score: 90 | |
| Day Percent Change: -0.94% Day Change: -0.06 | |
| Week Change: 4.81% Year-to-date Change: 19.9% | |
| OSG Links: Profile News Message Board | |
| Charts:- Daily , Weekly | |
| Add OSG to Watchlist: View: Get Complete OSG Trend Analysis ➞ | |
 | SAVE Spirit Airlines, Inc. |
| Sector: Transports | |
| SubSector: Major Airlines | |
| MarketCap: 885 Millions | |
| Recent Price: 3.71 Smart Investing & Trading Score: 52 | |
| Day Percent Change: 0.82% Day Change: 0.03 | |
| Week Change: 4.8% Year-to-date Change: -77.4% | |
| SAVE Links: Profile News Message Board | |
| Charts:- Daily , Weekly | |
| Add SAVE to Watchlist: View: Get Complete SAVE Trend Analysis ➞ | |
 | WERN Werner Enterprises, Inc. |
| Sector: Transports | |
| SubSector: Trucking | |
| MarketCap: 2409.65 Millions | |
| Recent Price: 36.31 Smart Investing & Trading Score: 59 | |
| Day Percent Change: 1.59% Day Change: 0.57 | |
| Week Change: 4.52% Year-to-date Change: -14.3% | |
| WERN Links: Profile News Message Board | |
| Charts:- Daily , Weekly | |
| Add WERN to Watchlist: View: Get Complete WERN Trend Analysis ➞ | |
 | MATX Matson, Inc. |
| Sector: Transports | |
| SubSector: Shipping | |
| MarketCap: 1509.94 Millions | |
| Recent Price: 113.36 Smart Investing & Trading Score: 70 | |
| Day Percent Change: 3.90% Day Change: 4.25 | |
| Week Change: 4.06% Year-to-date Change: 3.4% | |
| MATX Links: Profile News Message Board | |
| Charts:- Daily , Weekly | |
| Add MATX to Watchlist: View: Get Complete MATX Trend Analysis ➞ | |
 | HTLD Heartland Express, Inc. |
| Sector: Transports | |
| SubSector: Trucking | |
| MarketCap: 1461.25 Millions | |
| Recent Price: 10.77 Smart Investing & Trading Score: 59 | |
| Day Percent Change: 1.70% Day Change: 0.18 | |
| Week Change: 3.96% Year-to-date Change: -24.5% | |
| HTLD Links: Profile News Message Board | |
| Charts:- Daily , Weekly | |
| Add HTLD to Watchlist: View: Get Complete HTLD Trend Analysis ➞ | |
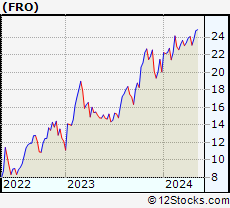 | FRO Frontline Ltd. |
| Sector: Transports | |
| SubSector: Shipping | |
| MarketCap: 1269.14 Millions | |
| Recent Price: 24.74 Smart Investing & Trading Score: 95 | |
| Day Percent Change: 0.69% Day Change: 0.17 | |
| Week Change: 3.95% Year-to-date Change: 23.4% | |
| FRO Links: Profile News Message Board | |
| Charts:- Daily , Weekly | |
| Add FRO to Watchlist: View: Get Complete FRO Trend Analysis ➞ | |
 | GNK Genco Shipping & Trading Limited |
| Sector: Transports | |
| SubSector: Shipping | |
| MarketCap: 251.614 Millions | |
| Recent Price: 22.26 Smart Investing & Trading Score: 95 | |
| Day Percent Change: 0.41% Day Change: 0.09 | |
| Week Change: 3.29% Year-to-date Change: 34.2% | |
| GNK Links: Profile News Message Board | |
| Charts:- Daily , Weekly | |
| Add GNK to Watchlist: View: Get Complete GNK Trend Analysis ➞ | |
 | DAL Delta Air Lines, Inc. |
| Sector: Transports | |
| SubSector: Major Airlines | |
| MarketCap: 17298.5 Millions | |
| Recent Price: 51.55 Smart Investing & Trading Score: 100 | |
| Day Percent Change: 1.02% Day Change: 0.52 | |
| Week Change: 3.27% Year-to-date Change: 28.1% | |
| DAL Links: Profile News Message Board | |
| Charts:- Daily , Weekly | |
| Add DAL to Watchlist: View: Get Complete DAL Trend Analysis ➞ | |
 | ASC Ardmore Shipping Corporation |
| Sector: Transports | |
| SubSector: Shipping | |
| MarketCap: 147.014 Millions | |
| Recent Price: 17.42 Smart Investing & Trading Score: 100 | |
| Day Percent Change: 0.87% Day Change: 0.15 | |
| Week Change: 3.14% Year-to-date Change: 23.6% | |
| ASC Links: Profile News Message Board | |
| Charts:- Daily , Weekly | |
| Add ASC to Watchlist: View: Get Complete ASC Trend Analysis ➞ | |
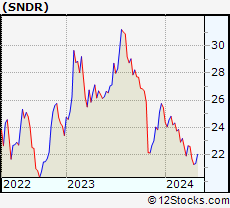 | SNDR Schneider National, Inc. |
| Sector: Transports | |
| SubSector: Trucking | |
| MarketCap: 3299.95 Millions | |
| Recent Price: 22.02 Smart Investing & Trading Score: 74 | |
| Day Percent Change: 2.32% Day Change: 0.50 | |
| Week Change: 3.14% Year-to-date Change: -13.5% | |
| SNDR Links: Profile News Message Board | |
| Charts:- Daily , Weekly | |
| Add SNDR to Watchlist: View: Get Complete SNDR Trend Analysis ➞ | |
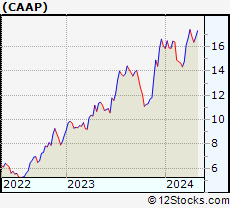 | CAAP Corporacion America Airports S.A. |
| Sector: Transports | |
| SubSector: Air Services, Other | |
| MarketCap: 359 Millions | |
| Recent Price: 17.32 Smart Investing & Trading Score: 95 | |
| Day Percent Change: 0.99% Day Change: 0.17 | |
| Week Change: 3.1% Year-to-date Change: 7.9% | |
| CAAP Links: Profile News Message Board | |
| Charts:- Daily , Weekly | |
| Add CAAP to Watchlist: View: Get Complete CAAP Trend Analysis ➞ | |
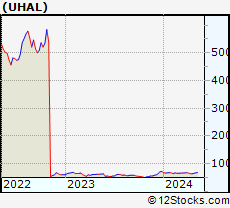 | UHAL AMERCO |
| Sector: Transports | |
| SubSector: Rental & Leasing Services | |
| MarketCap: 5271.94 Millions | |
| Recent Price: 66.85 Smart Investing & Trading Score: 100 | |
| Day Percent Change: 2.28% Day Change: 1.49 | |
| Week Change: 2.97% Year-to-date Change: -6.9% | |
| UHAL Links: Profile News Message Board | |
| Charts:- Daily , Weekly | |
| Add UHAL to Watchlist: View: Get Complete UHAL Trend Analysis ➞ | |
 | MRTN Marten Transport, Ltd. |
| Sector: Transports | |
| SubSector: Trucking | |
| MarketCap: 1012.15 Millions | |
| Recent Price: 17.44 Smart Investing & Trading Score: 74 | |
| Day Percent Change: 1.28% Day Change: 0.22 | |
| Week Change: 2.95% Year-to-date Change: -16.9% | |
| MRTN Links: Profile News Message Board | |
| Charts:- Daily , Weekly | |
| Add MRTN to Watchlist: View: Get Complete MRTN Trend Analysis ➞ | |
 | TK Teekay Corporation |
| Sector: Transports | |
| SubSector: Shipping | |
| MarketCap: 257.914 Millions | |
| Recent Price: 7.71 Smart Investing & Trading Score: 90 | |
| Day Percent Change: -0.13% Day Change: -0.01 | |
| Week Change: 2.8% Year-to-date Change: 7.8% | |
| TK Links: Profile News Message Board | |
| Charts:- Daily , Weekly | |
| Add TK to Watchlist: View: Get Complete TK Trend Analysis ➞ | |
 | LPG Dorian LPG Ltd. |
| Sector: Transports | |
| SubSector: Shipping | |
| MarketCap: 426.414 Millions | |
| Recent Price: 42.89 Smart Investing & Trading Score: 90 | |
| Day Percent Change: 0.59% Day Change: 0.25 | |
| Week Change: 2.66% Year-to-date Change: -2.2% | |
| LPG Links: Profile News Message Board | |
| Charts:- Daily , Weekly | |
| Add LPG to Watchlist: View: Get Complete LPG Trend Analysis ➞ | |
| For tabular summary view of above stock list: Summary View ➞ 0 - 25 , 25 - 50 , 50 - 75 , 75 - 100 | ||
| Click To Change The Sort Order: By Market Cap or Company Size Performance: Year-to-date, Week and Day | |
| Select Chart Type: | ||
|
Best Stocks Today 12Stocks.com |
© 2024 12Stocks.com Terms & Conditions Privacy Contact Us
All Information Provided Only For Education And Not To Be Used For Investing or Trading. See Terms & Conditions


One More Thing ... Get Best Stocks Delivered Daily!
Never Ever Miss A Move With Our Top Ten Stocks Lists
Find Best Stocks In Any Market - Bull or Bear Market
Take A Peek At Our Top Ten Stocks Lists: Daily, Weekly, Year-to-Date & Top Trends
Find Best Stocks In Any Market - Bull or Bear Market
Take A Peek At Our Top Ten Stocks Lists: Daily, Weekly, Year-to-Date & Top Trends
Transport Stocks With Best Up Trends [0-bearish to 100-bullish]: Willis Lease[100], Fortress ation[100], AMERCO [100], Safe Bulkers[100], Trinity Industries[100], Delta Air[100], Golden Ocean[100], Ardmore Shipping[100], C.H. Robinson[100], Corporacion America[95], Costamare [95]
Best Transport Stocks Year-to-Date:
Fortress ation[68.79%], Universal Logistics[51.78%], Golden Ocean[51.54%], SkyWest [44.31%], Kirby [40.83%], Genco Shipping[34.18%], Safe Bulkers[32.06%], XPO Logistics[28.51%], Delta Air[28.14%], Wabtec [27.83%], United Airlines[25.18%] Best Transport Stocks This Week:
C.H. Robinson[15.64%], Avis Budget[14.74%], Willis Lease[14.15%], Azul S.A[13.03%], Trinity Industries[12.16%], Fortress ation[10.7%], KNOT Offshore[8.42%], Hub [6.54%], Costamare [5.94%], Golden Ocean[5.27%], Overseas Shipholding[4.81%] Best Transport Stocks Daily:
Azul S.A[8.63%], Willis Lease[7.06%], Matson [3.90%], Fortress ation[3.72%], XPO Logistics[3.34%], Forward Air[3.13%], L.B. Foster[2.55%], Aaron s[2.36%], Allegiant Travel[2.32%], Schneider National[2.32%], AMERCO [2.28%]