
 Login Sign Up


| |||||
 |  | ||||

| 12Stocks.com Market Intelligence |
Best Transport Stocks
| In a hurry? Transport Stocks Lists: Performance Trends Table, Stock Charts
Sort Transport stocks: Daily, Weekly, Year-to-Date, Market Cap & Trends. Filter Transport stocks list by size: All Transport Large Mid-Range Small |
| 12Stocks.com Transport Stocks Performances & Trends Daily | |||||||||
|
|  The overall Smart Investing & Trading Score is 44 (0-bearish to 100-bullish) which puts Transport sector in short term neutral trend. The Smart Investing & Trading Score from previous trading session is 58 and a deterioration of trend continues.
| ||||||||
| Here are the Smart Investing & Trading Scores of the most requested Transport stocks at 12Stocks.com (click stock name for detailed review): |


| Consider signing up for our daily 12Stocks.com "Best Stocks Newsletter". You will never ever miss a big stock move again! |
| 12Stocks.com: Investing in Transport sector with Stocks | |
|
The following table helps investors and traders sort through current performance and trends (as measured by Smart Investing & Trading Score) of various
stocks in the Transport sector. Quick View: Move mouse or cursor over stock symbol (ticker) to view short-term Technical chart and over stock name to view long term chart. Click on  to add stock symbol to your watchlist and to add stock symbol to your watchlist and  to view watchlist. Click on any ticker or stock name for detailed market intelligence report for that stock. to view watchlist. Click on any ticker or stock name for detailed market intelligence report for that stock. |
12Stocks.com Performance of Stocks in Transport Sector
| Ticker | Stock Name | Watchlist | Category | Recent Price | Smart Investing & Trading Score | Change % | YTD Change% |
| PTSI | P.A.M. ation |   | Trucking | 17.15 | 49 | 17.95 | -17.47% |
| KEX | Kirby | | Shipping | 112.16 | 100 | 10.99 | 42.92% |
| URI | United Rentals | | Rental | 690.92 | 80 | 5.45 | 20.49% |
| OMAB | Grupo Aeroportuario | | Air , Other | 85.26 | 85 | 5.18 | 0.74% |
| UNP | Union Pacific | | Railroads | 243.55 | 70 | 4.99 | -0.84% |
| DAL | Delta Air | | Airlines | 49.88 | 86 | 4.05 | 23.99% |
| LSTR | Landstar System | | Trucking | 177.43 | 32 | 3.70 | -8.38% |
| FRO | Frontline | | Shipping | 23.44 | 31 | 3.17 | 16.91% |
| SAIA | Saia | | Trucking | 543.02 | 44 | 2.88 | 23.91% |
| TNK | Teekay Tankers | | Shipping | 58.13 | 25 | 2.70 | 16.33% |
| SKYW | SkyWest | | Airlines | 73.14 | 73 | 2.51 | 40.11% |
| TNP | Tsakos Energy | | Shipping | 25.35 | 38 | 2.26 | 14.09% |
| SB | Safe Bulkers | | Shipping | 5.04 | 61 | 2.23 | 28.24% |
| RLGT | Radiant Logistics | | Air Delivery | 5.04 | 17 | 2.23 | -24.10% |
| ASR | Grupo Aeroportuario | | Air , Other | 347.71 | 93 | 2.21 | 18.16% |
| PAC | Grupo Aeroportuario | | Air , Other | 179.97 | 100 | 2.17 | 2.71% |
| NSC | Norfolk Southern | | Railroads | 240.83 | 41 | 1.95 | 1.88% |
| SBLK | Star Bulk | | Shipping | 24.42 | 93 | 1.88 | 14.86% |
| NAT | Nordic American | | Shipping | 3.86 | 25 | 1.85 | -8.10% |
| TRMD | TORM | | Shipping | 33.98 | 39 | 1.83 | 11.74% |
| NVGS | Navigator | | Shipping | 15.18 | 17 | 1.81 | 4.33% |
| DHT | DHT | | Shipping | 11.48 | 51 | 1.77 | 17.02% |
| GATX | GATX | | Rental | 127.99 | 33 | 1.72 | 6.46% |
| GOGL | Golden Ocean | | Shipping | 13.82 | 90 | 1.69 | 41.60% |
| UAL | United Airlines | | Airlines | 53.51 | 68 | 1.59 | 29.69% |
| For chart view version of above stock list: Chart View ➞ 0 - 25 , 25 - 50 , 50 - 75 , 75 - 100 | ||
 | Click To Change The Sort Order: By Market Cap or Company Size Performance: Year-to-date, Week and Day |  |
|
Get the most comprehensive stock market coverage daily at 12Stocks.com ➞ Best Stocks Today ➞ Best Stocks Weekly ➞ Best Stocks Year-to-Date ➞ Best Stocks Trends ➞  Best Stocks Today 12Stocks.com Best Nasdaq Stocks ➞ Best S&P 500 Stocks ➞ Best Tech Stocks ➞ Best Biotech Stocks ➞ |
| Detailed Overview of Transport Stocks |
| Transport Technical Overview, Leaders & Laggards, Top Transport ETF Funds & Detailed Transport Stocks List, Charts, Trends & More |
| Transport Sector: Technical Analysis, Trends & YTD Performance | |
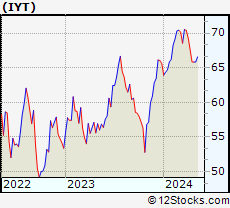
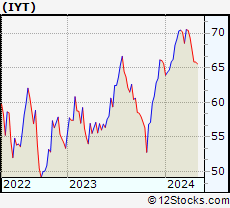
| Transport sector is composed of stocks
from air delivery, shipping, trucking, railroads
and airline subsectors. Transport sector, as represented by IYT, an exchange-traded fund [ETF] that holds basket of Transport stocks (e.g, FedEx, United Airlines) is up by 1.6% and is currently underperforming the overall market by -3.56% year-to-date. Below is a quick view of Technical charts and trends: |
|
 IYT Weekly Chart |
|
| Long Term Trend: Good | |
| Medium Term Trend: Not Good | |
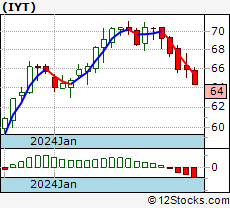
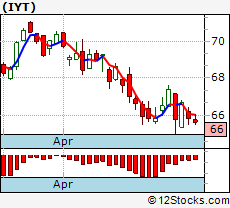 IYT Daily Chart |
|
| Short Term Trend: Very Good | |
| Overall Trend Score: 44 | |
| YTD Performance: 1.6% | |
| **Trend Scores & Views Are Only For Educational Purposes And Not For Investing | |
| 12Stocks.com: Top Performing Transport Sector Stocks | ||||||||||||||||||||||||||||||||||||||||||||||||
 The top performing Transport sector stocks year to date are
Now, more recently, over last week, the top performing Transport sector stocks on the move are


|
||||||||||||||||||||||||||||||||||||||||||||||||
| 12Stocks.com: Investing in Transport Sector using Exchange Traded Funds | |
|
The following table shows list of key exchange traded funds (ETF) that
help investors track Transport Index. For detailed view, check out our ETF Funds section of our website. Quick View: Move mouse or cursor over ETF symbol (ticker) to view short-term Technical chart and over ETF name to view long term chart. Click on ticker or stock name for detailed view. Click on to add stock symbol to your watchlist and to view watchlist. |
12Stocks.com List of ETFs that track Transport Index
| Ticker | ETF Name | Watchlist | Recent Price | Smart Investing & Trading Score | Change % | Week % | Year-to-date % |
| IYT | Transportation | | 66.66 | 44 | 1.29 | 1.21 | 1.6% |
| XTN | Transportation | | 78.25 | 36 | 0.46 | 0.37 | -6.28% |
| FTXR | Transportation | | 30.91 | 41 | 0.18 | 2.86 | 3% |
| JETS | Global Jets | | 20.48 | 66 | 0.24 | 0.1 | 7.62% |
| 12Stocks.com: Charts, Trends, Fundamental Data and Performances of Transport Stocks | |
|
We now take in-depth look at all Transport stocks including charts, multi-period performances and overall trends (as measured by Smart Investing & Trading Score). One can sort Transport stocks (click link to choose) by Daily, Weekly and by Year-to-Date performances. Also, one can sort by size of the company or by market capitalization. |
| Select Your Default Chart Type: | |||||
| |||||
| Click on stock symbol or name for detailed view. Click on to add stock symbol to your watchlist and to view watchlist. Quick View: Move mouse or cursor over "Daily" to quickly view daily Technical stock chart and over "Weekly" to view weekly Technical stock chart. | |||||
 | PTSI P.A.M. Transportation Services, Inc. |
| Sector: Transports | |
| SubSector: Trucking | |
| MarketCap: 136.915 Millions | |
| Recent Price: 17.15 Smart Investing & Trading Score: 49 | |
| Day Percent Change: 17.95% Day Change: 2.61 | |
| Week Change: 22.85% Year-to-date Change: -17.5% | |
| PTSI Links: Profile News Message Board | |
| Charts:- Daily , Weekly | |
| Add PTSI to Watchlist: View: Get Complete PTSI Trend Analysis ➞ | |
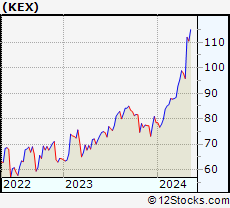 | KEX Kirby Corporation |
| Sector: Transports | |
| SubSector: Shipping | |
| MarketCap: 2533.34 Millions | |
| Recent Price: 112.16 Smart Investing & Trading Score: 100 | |
| Day Percent Change: 10.99% Day Change: 11.11 | |
| Week Change: 17.07% Year-to-date Change: 42.9% | |
| KEX Links: Profile News Message Board | |
| Charts:- Daily , Weekly | |
| Add KEX to Watchlist: View: Get Complete KEX Trend Analysis ➞ | |
 | URI United Rentals, Inc. |
| Sector: Transports | |
| SubSector: Rental & Leasing Services | |
| MarketCap: 6246.64 Millions | |
| Recent Price: 690.92 Smart Investing & Trading Score: 80 | |
| Day Percent Change: 5.45% Day Change: 35.73 | |
| Week Change: 9.96% Year-to-date Change: 20.5% | |
| URI Links: Profile News Message Board | |
| Charts:- Daily , Weekly | |
| Add URI to Watchlist: View: Get Complete URI Trend Analysis ➞ | |
 | OMAB Grupo Aeroportuario del Centro Norte, S.A.B. de C.V. |
| Sector: Transports | |
| SubSector: Air Services, Other | |
| MarketCap: 1196.38 Millions | |
| Recent Price: 85.26 Smart Investing & Trading Score: 85 | |
| Day Percent Change: 5.18% Day Change: 4.20 | |
| Week Change: 13.53% Year-to-date Change: 0.7% | |
| OMAB Links: Profile News Message Board | |
| Charts:- Daily , Weekly | |
| Add OMAB to Watchlist: View: Get Complete OMAB Trend Analysis ➞ | |
 | UNP Union Pacific Corporation |
| Sector: Transports | |
| SubSector: Railroads | |
| MarketCap: 87198.1 Millions | |
| Recent Price: 243.55 Smart Investing & Trading Score: 70 | |
| Day Percent Change: 4.99% Day Change: 11.57 | |
| Week Change: 4.94% Year-to-date Change: -0.8% | |
| UNP Links: Profile News Message Board | |
| Charts:- Daily , Weekly | |
| Add UNP to Watchlist: View: Get Complete UNP Trend Analysis ➞ | |
 | DAL Delta Air Lines, Inc. |
| Sector: Transports | |
| SubSector: Major Airlines | |
| MarketCap: 17298.5 Millions | |
| Recent Price: 49.88 Smart Investing & Trading Score: 86 | |
| Day Percent Change: 4.05% Day Change: 1.94 | |
| Week Change: 4.86% Year-to-date Change: 24.0% | |
| DAL Links: Profile News Message Board | |
| Charts:- Daily , Weekly | |
| Add DAL to Watchlist: View: Get Complete DAL Trend Analysis ➞ | |
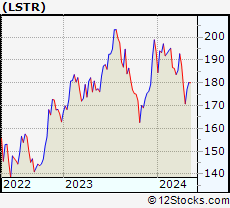 | LSTR Landstar System, Inc. |
| Sector: Transports | |
| SubSector: Trucking | |
| MarketCap: 3877.95 Millions | |
| Recent Price: 177.43 Smart Investing & Trading Score: 32 | |
| Day Percent Change: 3.70% Day Change: 6.33 | |
| Week Change: 3.88% Year-to-date Change: -8.4% | |
| LSTR Links: Profile News Message Board | |
| Charts:- Daily , Weekly | |
| Add LSTR to Watchlist: View: Get Complete LSTR Trend Analysis ➞ | |
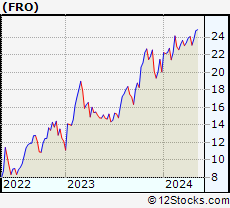 | FRO Frontline Ltd. |
| Sector: Transports | |
| SubSector: Shipping | |
| MarketCap: 1269.14 Millions | |
| Recent Price: 23.44 Smart Investing & Trading Score: 31 | |
| Day Percent Change: 3.17% Day Change: 0.72 | |
| Week Change: 1.47% Year-to-date Change: 16.9% | |
| FRO Links: Profile News Message Board | |
| Charts:- Daily , Weekly | |
| Add FRO to Watchlist: View: Get Complete FRO Trend Analysis ➞ | |
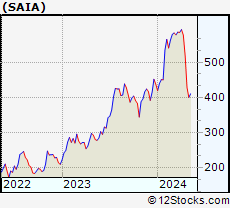 | SAIA Saia, Inc. |
| Sector: Transports | |
| SubSector: Trucking | |
| MarketCap: 1978.15 Millions | |
| Recent Price: 543.02 Smart Investing & Trading Score: 44 | |
| Day Percent Change: 2.88% Day Change: 15.19 | |
| Week Change: 4.93% Year-to-date Change: 23.9% | |
| SAIA Links: Profile News Message Board | |
| Charts:- Daily , Weekly | |
| Add SAIA to Watchlist: View: Get Complete SAIA Trend Analysis ➞ | |
 | TNK Teekay Tankers Ltd. |
| Sector: Transports | |
| SubSector: Shipping | |
| MarketCap: 584.714 Millions | |
| Recent Price: 58.13 Smart Investing & Trading Score: 25 | |
| Day Percent Change: 2.70% Day Change: 1.53 | |
| Week Change: 2.83% Year-to-date Change: 16.3% | |
| TNK Links: Profile News Message Board | |
| Charts:- Daily , Weekly | |
| Add TNK to Watchlist: View: Get Complete TNK Trend Analysis ➞ | |
 | SKYW SkyWest, Inc. |
| Sector: Transports | |
| SubSector: Regional Airlines | |
| MarketCap: 1394.7 Millions | |
| Recent Price: 73.14 Smart Investing & Trading Score: 73 | |
| Day Percent Change: 2.51% Day Change: 1.79 | |
| Week Change: 5.8% Year-to-date Change: 40.1% | |
| SKYW Links: Profile News Message Board | |
| Charts:- Daily , Weekly | |
| Add SKYW to Watchlist: View: Get Complete SKYW Trend Analysis ➞ | |
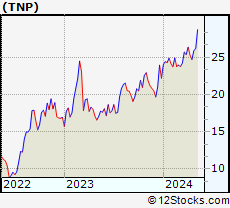 | TNP Tsakos Energy Navigation Limited |
| Sector: Transports | |
| SubSector: Shipping | |
| MarketCap: 162.414 Millions | |
| Recent Price: 25.35 Smart Investing & Trading Score: 38 | |
| Day Percent Change: 2.26% Day Change: 0.56 | |
| Week Change: 2.55% Year-to-date Change: 14.1% | |
| TNP Links: Profile News Message Board | |
| Charts:- Daily , Weekly | |
| Add TNP to Watchlist: View: Get Complete TNP Trend Analysis ➞ | |
 | SB Safe Bulkers, Inc. |
| Sector: Transports | |
| SubSector: Shipping | |
| MarketCap: 108.114 Millions | |
| Recent Price: 5.04 Smart Investing & Trading Score: 61 | |
| Day Percent Change: 2.23% Day Change: 0.11 | |
| Week Change: 4.78% Year-to-date Change: 28.2% | |
| SB Links: Profile News Message Board | |
| Charts:- Daily , Weekly | |
| Add SB to Watchlist: View: Get Complete SB Trend Analysis ➞ | |
 | RLGT Radiant Logistics, Inc. |
| Sector: Transports | |
| SubSector: Air Delivery & Freight Services | |
| MarketCap: 180.868 Millions | |
| Recent Price: 5.04 Smart Investing & Trading Score: 17 | |
| Day Percent Change: 2.23% Day Change: 0.11 | |
| Week Change: 2.23% Year-to-date Change: -24.1% | |
| RLGT Links: Profile News Message Board | |
| Charts:- Daily , Weekly | |
| Add RLGT to Watchlist: View: Get Complete RLGT Trend Analysis ➞ | |
 | ASR Grupo Aeroportuario del Sureste, S. A. B. de C. V. |
| Sector: Transports | |
| SubSector: Air Services, Other | |
| MarketCap: 2739.98 Millions | |
| Recent Price: 347.71 Smart Investing & Trading Score: 93 | |
| Day Percent Change: 2.21% Day Change: 7.52 | |
| Week Change: 12.82% Year-to-date Change: 18.2% | |
| ASR Links: Profile News Message Board | |
| Charts:- Daily , Weekly | |
| Add ASR to Watchlist: View: Get Complete ASR Trend Analysis ➞ | |
 | PAC Grupo Aeroportuario del Pacifico, S.A.B. de C.V. |
| Sector: Transports | |
| SubSector: Air Services, Other | |
| MarketCap: 3204.18 Millions | |
| Recent Price: 179.97 Smart Investing & Trading Score: 100 | |
| Day Percent Change: 2.17% Day Change: 3.82 | |
| Week Change: 15.25% Year-to-date Change: 2.7% | |
| PAC Links: Profile News Message Board | |
| Charts:- Daily , Weekly | |
| Add PAC to Watchlist: View: Get Complete PAC Trend Analysis ➞ | |
 | NSC Norfolk Southern Corporation |
| Sector: Transports | |
| SubSector: Railroads | |
| MarketCap: 36165.4 Millions | |
| Recent Price: 240.83 Smart Investing & Trading Score: 41 | |
| Day Percent Change: 1.95% Day Change: 4.61 | |
| Week Change: -0.19% Year-to-date Change: 1.9% | |
| NSC Links: Profile News Message Board | |
| Charts:- Daily , Weekly | |
| Add NSC to Watchlist: View: Get Complete NSC Trend Analysis ➞ | |
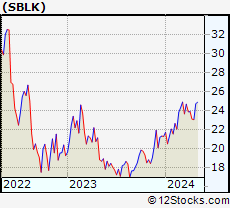 | SBLK Star Bulk Carriers Corp. |
| Sector: Transports | |
| SubSector: Shipping | |
| MarketCap: 542.714 Millions | |
| Recent Price: 24.42 Smart Investing & Trading Score: 93 | |
| Day Percent Change: 1.88% Day Change: 0.45 | |
| Week Change: 6.04% Year-to-date Change: 14.9% | |
| SBLK Links: Profile News Message Board | |
| Charts:- Daily , Weekly | |
| Add SBLK to Watchlist: View: Get Complete SBLK Trend Analysis ➞ | |
 | NAT Nordic American Tankers Limited |
| Sector: Transports | |
| SubSector: Shipping | |
| MarketCap: 416.114 Millions | |
| Recent Price: 3.86 Smart Investing & Trading Score: 25 | |
| Day Percent Change: 1.85% Day Change: 0.07 | |
| Week Change: 1.58% Year-to-date Change: -8.1% | |
| NAT Links: Profile News Message Board | |
| Charts:- Daily , Weekly | |
| Add NAT to Watchlist: View: Get Complete NAT Trend Analysis ➞ | |
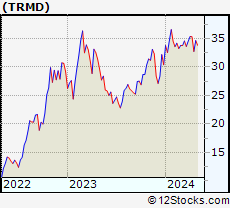 | TRMD TORM plc |
| Sector: Transports | |
| SubSector: Shipping | |
| MarketCap: 607.914 Millions | |
| Recent Price: 33.98 Smart Investing & Trading Score: 39 | |
| Day Percent Change: 1.83% Day Change: 0.61 | |
| Week Change: 3.82% Year-to-date Change: 11.7% | |
| TRMD Links: Profile News Message Board | |
| Charts:- Daily , Weekly | |
| Add TRMD to Watchlist: View: Get Complete TRMD Trend Analysis ➞ | |
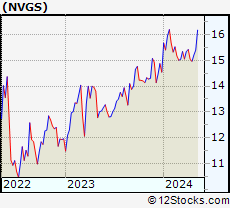 | NVGS Navigator Holdings Ltd. |
| Sector: Transports | |
| SubSector: Shipping | |
| MarketCap: 280.914 Millions | |
| Recent Price: 15.18 Smart Investing & Trading Score: 17 | |
| Day Percent Change: 1.81% Day Change: 0.27 | |
| Week Change: 1.4% Year-to-date Change: 4.3% | |
| NVGS Links: Profile News Message Board | |
| Charts:- Daily , Weekly | |
| Add NVGS to Watchlist: View: Get Complete NVGS Trend Analysis ➞ | |
 | DHT DHT Holdings, Inc. |
| Sector: Transports | |
| SubSector: Shipping | |
| MarketCap: 754.514 Millions | |
| Recent Price: 11.48 Smart Investing & Trading Score: 51 | |
| Day Percent Change: 1.77% Day Change: 0.20 | |
| Week Change: 1.95% Year-to-date Change: 17.0% | |
| DHT Links: Profile News Message Board | |
| Charts:- Daily , Weekly | |
| Add DHT to Watchlist: View: Get Complete DHT Trend Analysis ➞ | |
 | GATX GATX Corporation |
| Sector: Transports | |
| SubSector: Rental & Leasing Services | |
| MarketCap: 2080.34 Millions | |
| Recent Price: 127.99 Smart Investing & Trading Score: 33 | |
| Day Percent Change: 1.72% Day Change: 2.16 | |
| Week Change: -1.53% Year-to-date Change: 6.5% | |
| GATX Links: Profile News Message Board | |
| Charts:- Daily , Weekly | |
| Add GATX to Watchlist: View: Get Complete GATX Trend Analysis ➞ | |
 | GOGL Golden Ocean Group Limited |
| Sector: Transports | |
| SubSector: Shipping | |
| MarketCap: 446.614 Millions | |
| Recent Price: 13.82 Smart Investing & Trading Score: 90 | |
| Day Percent Change: 1.69% Day Change: 0.23 | |
| Week Change: 6.55% Year-to-date Change: 41.6% | |
| GOGL Links: Profile News Message Board | |
| Charts:- Daily , Weekly | |
| Add GOGL to Watchlist: View: Get Complete GOGL Trend Analysis ➞ | |
 | UAL United Airlines Holdings, Inc. |
| Sector: Transports | |
| SubSector: Major Airlines | |
| MarketCap: 8083.25 Millions | |
| Recent Price: 53.51 Smart Investing & Trading Score: 68 | |
| Day Percent Change: 1.59% Day Change: 0.84 | |
| Week Change: 4.15% Year-to-date Change: 29.7% | |
| UAL Links: Profile News Message Board | |
| Charts:- Daily , Weekly | |
| Add UAL to Watchlist: View: Get Complete UAL Trend Analysis ➞ | |
| For tabular summary view of above stock list: Summary View ➞ 0 - 25 , 25 - 50 , 50 - 75 , 75 - 100 | ||
| Click To Change The Sort Order: By Market Cap or Company Size Performance: Year-to-date, Week and Day | |
| Select Chart Type: | ||
|
Best Stocks Today 12Stocks.com |
© 2024 12Stocks.com Terms & Conditions Privacy Contact Us
All Information Provided Only For Education And Not To Be Used For Investing or Trading. See Terms & Conditions


One More Thing ... Get Best Stocks Delivered Daily!
Never Ever Miss A Move With Our Top Ten Stocks Lists
Find Best Stocks In Any Market - Bull or Bear Market
Take A Peek At Our Top Ten Stocks Lists: Daily, Weekly, Year-to-Date & Top Trends
Find Best Stocks In Any Market - Bull or Bear Market
Take A Peek At Our Top Ten Stocks Lists: Daily, Weekly, Year-to-Date & Top Trends
Transport Stocks With Best Up Trends [0-bearish to 100-bullish]: Kirby [100], Grupo Aeroportuario[100], ZTO Express[100], Ryder System[93], Wabtec [93], Grupo Aeroportuario[93], Star Bulk[93], Golden Ocean[90], Genco Shipping[90], Controladora Vuela[88], Air Lease[88]
Best Transport Stocks Year-to-Date:
Fortress ation[57.87%], Kirby [42.92%], Golden Ocean[41.6%], SkyWest [40.11%], XPO Logistics[35%], United Airlines[29.69%], Wabtec [28.59%], Safe Bulkers[28.24%], Genco Shipping[27.97%], Delta Air[23.99%], Saia [23.91%] Best Transport Stocks This Week:
P.A.M. ation[22.85%], Kirby [17.07%], Grupo Aeroportuario[15.25%], Grupo Aeroportuario[13.53%], Wabtec [13.19%], Grupo Aeroportuario[12.82%], Ryder System[12.62%], Controladora Vuela[12.56%], United Rentals[9.96%], Fortress ation[6.87%], Golden Ocean[6.55%] Best Transport Stocks Daily:
P.A.M. ation[17.95%], Kirby [10.99%], United Rentals[5.45%], Grupo Aeroportuario[5.18%], Union Pacific[4.99%], Delta Air[4.05%], Landstar System[3.70%], Frontline [3.17%], Saia [2.88%], Teekay Tankers[2.70%], SkyWest [2.51%]