
 Login Sign Up


| |||||
 |  | ||||

| 12Stocks.com Market Intelligence |
Best Tech Stocks
| In a hurry? Tech Stocks Lists: Performance & Trends, Stock Charts, FANG Stocks
Sort Tech stocks: Daily, Weekly, Year-to-Date, Market Cap & Trends. Filter Tech stocks list by size:All Tech Large Mid-Range Small and MicroCap |
| 12Stocks.com Tech Stocks Performances & Trends Daily | |||||||||
|
|  The overall Smart Investing & Trading Score is 100 (0-bearish to 100-bullish) which puts Technology sector in short term bullish trend. The Smart Investing & Trading Score from previous trading session is 80 and an improvement of trend continues.
| ||||||||
Here are the Smart Investing & Trading Scores of the most requested Technology stocks at 12Stocks.com (click stock name for detailed review):
|


| 12Stocks.com: Investing in Technology sector with Stocks | |
|
The following table helps investors and traders sort through current performance and trends (as measured by Smart Investing & Trading Score) of various
stocks in the Tech sector. Quick View: Move mouse or cursor over stock symbol (ticker) to view short-term technical chart and over stock name to view long term chart. Click on  to add stock symbol to your watchlist and to add stock symbol to your watchlist and  to view watchlist. Click on any ticker or stock name for detailed market intelligence report for that stock. to view watchlist. Click on any ticker or stock name for detailed market intelligence report for that stock. |
12Stocks.com Performance of Stocks in Tech Sector
| Ticker | Stock Name | Watchlist | Category | Recent Price | Smart Investing & Trading Score | Change % | YTD Change% |
| HCKT | Hackett |   | IT | 22.01 | 32 | 0.82% | -3.34% |
| IIIV | i3 Verticals | | Software | 19.96 | 64 | -0.20% | -5.72% |
| CINT | CI&T | | Software - Infrastructure | 5.00 | 83 | 2.25% | -6.10% |
| PLUS | ePlus | | Software | 74.71 | 25 | 2.79% | -6.43% |
| VPG | Vishay Precision | | Instruments | 31.73 | 0 | 0.79% | -6.87% |
| NVEC | NVE | | Semiconductor | 72.91 | 0 | -2.80% | -7.04% |
| SPOK | Spok | | Wireless | 14.38 | 7 | 0.35% | -7.11% |
| ATEX | Anterix | | Telecom | 30.76 | 0 | -1.32% | -7.68% |
| BLND | Blend Labs | | Software - | 2.35 | 0 | -4.08% | -8.20% |
| GOGO | Gogo | | Communication | 9.27 | 36 | 0.98% | -8.49% |
| IVAC | Intevac | | Electronics | 3.90 | 17 | 1.43% | -9.72% |
| PKE | Park Aerospace | | Semiconductor | 13.26 | 18 | -0.45% | -9.80% |
| VIOT | Viomi | | Electronic | 0.90 | 78 | 1.01% | -10.10% |
| KVHI | KVH Industries | | Communication | 4.72 | 10 | -1.46% | -10.27% |
| COHU | Cohu | | Semiconductor | 31.59 | 28 | 0.77% | -10.74% |
| CDLX | Cardlytics | | Internet | 8.22 | 0 | -2.32% | -10.75% |
| TTGT | TechTarget | | Internet | 31.06 | 49 | 0.39% | -10.90% |
| LASR | nLIGHT | | Semiconductor | 12.00 | 10 | 1.78% | -11.11% |
| HLIT | Harmonic | | Communication | 11.46 | 25 | 1.78% | -12.12% |
| CEVA | CEVA | | Semiconductor | 19.95 | 42 | -1.14% | -12.15% |
| TRVG | trivago N.V | | Internet | 2.14 | 10 | -0.93% | -12.30% |
| MLAB | Mesa | | Instruments | 91.04 | 20 | -0.61% | -13.10% |
| SILC | Silicom | | Communication | 15.70 | 61 | -1.78% | -13.29% |
| RMNI | Rimini Street | | Software | 2.84 | 42 | -0.87% | -13.30% |
| DGII | Digi | | Communication | 22.45 | 10 | 0.49% | -13.65% |
| For chart view version of above stock list: Chart View ➞ 0 - 25 , 25 - 50 , 50 - 75 , 75 - 100 , 100 - 125 , 125 - 150 , 150 - 175 , 175 - 200 , 200 - 225 | ||
 | Click To Change The Sort Order: By Market Cap or Company Size Performance: Year-to-date, Week and Day |  |
|
Get the most comprehensive stock market coverage daily at 12Stocks.com ➞ Best Stocks Today ➞ Best Stocks Weekly ➞ Best Stocks Year-to-Date ➞ Best Stocks Trends ➞  Best Stocks Today 12Stocks.com Best Nasdaq Stocks ➞ Best S&P 500 Stocks ➞ Best Tech Stocks ➞ Best Biotech Stocks ➞ |
| Detailed Overview of Tech Stocks |
| Tech Technical Overview, Leaders & Laggards, Top Tech ETF Funds & Detailed Tech Stocks List, Charts, Trends & More |
| Tech Sector: Technical Analysis, Trends & YTD Performance | |
| Technology sector is composed of stocks
from semiconductors, software, web, social media
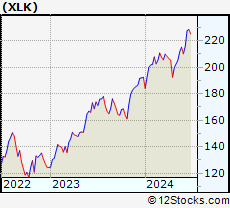
and services subsectors. Technology sector, as represented by XLK, an exchange-traded fund [ETF] that holds basket of tech stocks (e.g, Intel, Google) is up by 20.07% and is currently outperforming the overall market by 6.79% year-to-date. Below is a quick view of technical charts and trends: |
|
 XLK Weekly Chart |
|
| Long Term Trend: Very Good | |
| Medium Term Trend: Very Good | |
 XLK Daily Chart |
|
| Short Term Trend: Very Good | |
| Overall Trend Score: 100 | |
| YTD Performance: 20.07% | |
| **Trend Scores & Views Are Only For Educational Purposes And Not For Investing | |
| 12Stocks.com: Top Performing Technology Sector Stocks | ||||||||||||||||||||||||||||||||||||||||||||||||
 The top performing Technology sector stocks year to date are
Now, more recently, over last week, the top performing Technology sector stocks on the move are


|
||||||||||||||||||||||||||||||||||||||||||||||||
| 12Stocks.com: Investing in Tech Sector using Exchange Traded Funds | |
|
The following table shows list of key exchange traded funds (ETF) that
help investors track Tech Index. For detailed view, check out our ETF Funds section of our website. Quick View: Move mouse or cursor over ETF symbol (ticker) to view short-term technical chart and over ETF name to view long term chart. Click on ticker or stock name for detailed view. Click on to add stock symbol to your watchlist and to view watchlist. |
12Stocks.com List of ETFs that track Tech Index
| Ticker | ETF Name | Watchlist | Recent Price | Smart Investing & Trading Score | Change % | Week % | Year-to-date % |
| XLK | Technology | | 231.12 | 100 | 1.52 | 1.52 | 20.07% |
| QQQ | QQQ | | 485.04 | 100 | 1.22 | 1.22 | 18.44% |
| IYW | Technology | | 152.76 | 100 | 1.11 | 1.11 | 24.45% |
| VGT | Information Technology | | 586.47 | 100 | 1.22 | 1.22 | 21.17% |
| IXN | Global Tech | | 84.39 | 95 | 1.35 | 1.35 | 23.78% |
| IGV | Tech-Software | | 83.76 | 57 | 0.87 | 0.87 | 3.24% |
| XSD | Semiconductor | | 253.08 | 76 | 0.74 | 0.74 | 12.59% |
| TQQQ | QQQ | | 76.83 | 100 | 3.59 | 3.59 | 51.55% |
| SQQQ | Short QQQ | | 8.12 | 0 | -3.68 | -3.68 | -39.63% |
| SOXL | Semicondct Bull 3X | | 62.67 | 100 | 4.28 | 4.28 | 99.59% |
| SOXS | Semicondct Bear 3X | | 20.62 | 20 | -4.63 | -4.63 | -64.57% |
| SOXX | PHLX Semiconductor | | 256.04 | 95 | 1.57 | 1.57 | 33.33% |
| QTEC | First -100-Tech | | 198.62 | 95 | 1.27 | 1.27 | 13.19% |
| SMH | Semiconductor | | 272.49 | 100 | 1.72 | 1.72 | 55.82% |
| 12Stocks.com: Charts, Trends, Fundamental Data and Performances of Tech Stocks | |
|
We now take in-depth look at all Tech stocks including charts, multi-period performances and overall trends (as measured by Smart Investing & Trading Score). One can sort Tech stocks (click link to choose) by Daily, Weekly and by Year-to-Date performances. Also, one can sort by size of the company or by market capitalization. |
| Select Your Default Chart Type: | |||||
| |||||
| Click on stock symbol or name for detailed view. Click on to add stock symbol to your watchlist and to view watchlist. Quick View: Move mouse or cursor over "Daily" to quickly view daily technical stock chart and over "Weekly" to view weekly technical stock chart. | |||||


 | HCKT The Hackett Group, Inc. |
| Sector: Technology | |
| SubSector: Information Technology Services | |
| MarketCap: 334.468 Millions | |
| Recent Price: 22.01 Smart Investing & Trading Score: 32 | |
| Day Percent Change: 0.82% Day Change: 0.18 | |
| Week Change: 0.82% Year-to-date Change: -3.3% | |
| HCKT Links: Profile News Message Board | |
| Charts:- Daily , Weekly | |
| Add HCKT to Watchlist: View: Get Complete HCKT Trend Analysis ➞ | |
 | IIIV i3 Verticals, Inc. |
| Sector: Technology | |
| SubSector: Business Software & Services | |
| MarketCap: 448.458 Millions | |
| Recent Price: 19.96 Smart Investing & Trading Score: 64 | |
| Day Percent Change: -0.20% Day Change: -0.04 | |
| Week Change: -0.2% Year-to-date Change: -5.7% | |
| IIIV Links: Profile News Message Board | |
| Charts:- Daily , Weekly | |
| Add IIIV to Watchlist: View: Get Complete IIIV Trend Analysis ➞ | |
 | CINT CI&T Inc |
| Sector: Technology | |
| SubSector: Software - Infrastructure | |
| MarketCap: 806 Millions | |
| Recent Price: 5.00 Smart Investing & Trading Score: 83 | |
| Day Percent Change: 2.25% Day Change: 0.11 | |
| Week Change: 2.25% Year-to-date Change: -6.1% | |
| CINT Links: Profile News Message Board | |
| Charts:- Daily , Weekly | |
| Add CINT to Watchlist: View: Get Complete CINT Trend Analysis ➞ | |
 | PLUS ePlus inc. |
| Sector: Technology | |
| SubSector: Application Software | |
| MarketCap: 728.262 Millions | |
| Recent Price: 74.71 Smart Investing & Trading Score: 25 | |
| Day Percent Change: 2.79% Day Change: 2.03 | |
| Week Change: 2.79% Year-to-date Change: -6.4% | |
| PLUS Links: Profile News Message Board | |
| Charts:- Daily , Weekly | |
| Add PLUS to Watchlist: View: Get Complete PLUS Trend Analysis ➞ | |
 | VPG Vishay Precision Group, Inc. |
| Sector: Technology | |
| SubSector: Scientific & Technical Instruments | |
| MarketCap: 261.553 Millions | |
| Recent Price: 31.73 Smart Investing & Trading Score: 0 | |
| Day Percent Change: 0.79% Day Change: 0.25 | |
| Week Change: 0.79% Year-to-date Change: -6.9% | |
| VPG Links: Profile News Message Board | |
| Charts:- Daily , Weekly | |
| Add VPG to Watchlist: View: Get Complete VPG Trend Analysis ➞ | |
 | NVEC NVE Corporation |
| Sector: Technology | |
| SubSector: Semiconductor - Specialized | |
| MarketCap: 231.26 Millions | |
| Recent Price: 72.91 Smart Investing & Trading Score: 0 | |
| Day Percent Change: -2.80% Day Change: -2.10 | |
| Week Change: -2.8% Year-to-date Change: -7.0% | |
| NVEC Links: Profile News Message Board | |
| Charts:- Daily , Weekly | |
| Add NVEC to Watchlist: View: Get Complete NVEC Trend Analysis ➞ | |
 | SPOK Spok Holdings, Inc. |
| Sector: Technology | |
| SubSector: Wireless Communications | |
| MarketCap: 220.827 Millions | |
| Recent Price: 14.38 Smart Investing & Trading Score: 7 | |
| Day Percent Change: 0.35% Day Change: 0.05 | |
| Week Change: 0.35% Year-to-date Change: -7.1% | |
| SPOK Links: Profile News Message Board | |
| Charts:- Daily , Weekly | |
| Add SPOK to Watchlist: View: Get Complete SPOK Trend Analysis ➞ | |
 | ATEX Anterix Inc. |
| Sector: Technology | |
| SubSector: Telecom Services - Domestic | |
| MarketCap: 694.077 Millions | |
| Recent Price: 30.76 Smart Investing & Trading Score: 0 | |
| Day Percent Change: -1.32% Day Change: -0.41 | |
| Week Change: -1.32% Year-to-date Change: -7.7% | |
| ATEX Links: Profile News Message Board | |
| Charts:- Daily , Weekly | |
| Add ATEX to Watchlist: View: Get Complete ATEX Trend Analysis ➞ | |
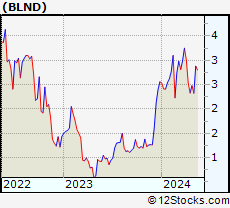 | BLND Blend Labs, Inc. |
| Sector: Technology | |
| SubSector: Software - Application | |
| MarketCap: 210 Millions | |
| Recent Price: 2.35 Smart Investing & Trading Score: 0 | |
| Day Percent Change: -4.08% Day Change: -0.10 | |
| Week Change: -4.08% Year-to-date Change: -8.2% | |
| BLND Links: Profile News Message Board | |
| Charts:- Daily , Weekly | |
| Add BLND to Watchlist: View: Get Complete BLND Trend Analysis ➞ | |
 | GOGO Gogo Inc. |
| Sector: Technology | |
| SubSector: Diversified Communication Services | |
| MarketCap: 307.064 Millions | |
| Recent Price: 9.27 Smart Investing & Trading Score: 36 | |
| Day Percent Change: 0.98% Day Change: 0.09 | |
| Week Change: 0.98% Year-to-date Change: -8.5% | |
| GOGO Links: Profile News Message Board | |
| Charts:- Daily , Weekly | |
| Add GOGO to Watchlist: View: Get Complete GOGO Trend Analysis ➞ | |
 | IVAC Intevac, Inc. |
| Sector: Technology | |
| SubSector: Diversified Electronics | |
| MarketCap: 89.2396 Millions | |
| Recent Price: 3.90 Smart Investing & Trading Score: 17 | |
| Day Percent Change: 1.43% Day Change: 0.05 | |
| Week Change: 1.43% Year-to-date Change: -9.7% | |
| IVAC Links: Profile News Message Board | |
| Charts:- Daily , Weekly | |
| Add IVAC to Watchlist: View: Get Complete IVAC Trend Analysis ➞ | |
 | PKE Park Aerospace Corp. |
| Sector: Technology | |
| SubSector: Semiconductor Equipment & Materials | |
| MarketCap: 229.018 Millions | |
| Recent Price: 13.26 Smart Investing & Trading Score: 18 | |
| Day Percent Change: -0.45% Day Change: -0.06 | |
| Week Change: -0.45% Year-to-date Change: -9.8% | |
| PKE Links: Profile News Message Board | |
| Charts:- Daily , Weekly | |
| Add PKE to Watchlist: View: Get Complete PKE Trend Analysis ➞ | |
 | VIOT Viomi Technology Co., Ltd |
| Sector: Technology | |
| SubSector: Electronic Equipment | |
| MarketCap: 357.2 Millions | |
| Recent Price: 0.90 Smart Investing & Trading Score: 78 | |
| Day Percent Change: 1.01% Day Change: 0.01 | |
| Week Change: 1.01% Year-to-date Change: -10.1% | |
| VIOT Links: Profile News Message Board | |
| Charts:- Daily , Weekly | |
| Add VIOT to Watchlist: View: Get Complete VIOT Trend Analysis ➞ | |
 | KVHI KVH Industries, Inc. |
| Sector: Technology | |
| SubSector: Communication Equipment | |
| MarketCap: 169.939 Millions | |
| Recent Price: 4.72 Smart Investing & Trading Score: 10 | |
| Day Percent Change: -1.46% Day Change: -0.07 | |
| Week Change: -1.46% Year-to-date Change: -10.3% | |
| KVHI Links: Profile News Message Board | |
| Charts:- Daily , Weekly | |
| Add KVHI to Watchlist: View: Get Complete KVHI Trend Analysis ➞ | |
 | COHU Cohu, Inc. |
| Sector: Technology | |
| SubSector: Semiconductor Equipment & Materials | |
| MarketCap: 519.518 Millions | |
| Recent Price: 31.59 Smart Investing & Trading Score: 28 | |
| Day Percent Change: 0.77% Day Change: 0.24 | |
| Week Change: 0.77% Year-to-date Change: -10.7% | |
| COHU Links: Profile News Message Board | |
| Charts:- Daily , Weekly | |
| Add COHU to Watchlist: View: Get Complete COHU Trend Analysis ➞ | |
 | CDLX Cardlytics, Inc. |
| Sector: Technology | |
| SubSector: Internet Information Providers | |
| MarketCap: 855.48 Millions | |
| Recent Price: 8.22 Smart Investing & Trading Score: 0 | |
| Day Percent Change: -2.32% Day Change: -0.19 | |
| Week Change: -2.32% Year-to-date Change: -10.8% | |
| CDLX Links: Profile News Message Board | |
| Charts:- Daily , Weekly | |
| Add CDLX to Watchlist: View: Get Complete CDLX Trend Analysis ➞ | |
 | TTGT TechTarget, Inc. |
| Sector: Technology | |
| SubSector: Internet Information Providers | |
| MarketCap: 560.78 Millions | |
| Recent Price: 31.06 Smart Investing & Trading Score: 49 | |
| Day Percent Change: 0.39% Day Change: 0.12 | |
| Week Change: 0.39% Year-to-date Change: -10.9% | |
| TTGT Links: Profile News Message Board | |
| Charts:- Daily , Weekly | |
| Add TTGT to Watchlist: View: Get Complete TTGT Trend Analysis ➞ | |
 | LASR nLIGHT, Inc. |
| Sector: Technology | |
| SubSector: Semiconductor - Broad Line | |
| MarketCap: 445.642 Millions | |
| Recent Price: 12.00 Smart Investing & Trading Score: 10 | |
| Day Percent Change: 1.78% Day Change: 0.21 | |
| Week Change: 1.78% Year-to-date Change: -11.1% | |
| LASR Links: Profile News Message Board | |
| Charts:- Daily , Weekly | |
| Add LASR to Watchlist: View: Get Complete LASR Trend Analysis ➞ | |
 | HLIT Harmonic Inc. |
| Sector: Technology | |
| SubSector: Communication Equipment | |
| MarketCap: 533.539 Millions | |
| Recent Price: 11.46 Smart Investing & Trading Score: 25 | |
| Day Percent Change: 1.78% Day Change: 0.20 | |
| Week Change: 1.78% Year-to-date Change: -12.1% | |
| HLIT Links: Profile News Message Board | |
| Charts:- Daily , Weekly | |
| Add HLIT to Watchlist: View: Get Complete HLIT Trend Analysis ➞ | |
 | CEVA CEVA, Inc. |
| Sector: Technology | |
| SubSector: Semiconductor - Specialized | |
| MarketCap: 587.06 Millions | |
| Recent Price: 19.95 Smart Investing & Trading Score: 42 | |
| Day Percent Change: -1.14% Day Change: -0.23 | |
| Week Change: -1.14% Year-to-date Change: -12.2% | |
| CEVA Links: Profile News Message Board | |
| Charts:- Daily , Weekly | |
| Add CEVA to Watchlist: View: Get Complete CEVA Trend Analysis ➞ | |
 | TRVG trivago N.V. |
| Sector: Technology | |
| SubSector: Internet Information Providers | |
| MarketCap: 587.88 Millions | |
| Recent Price: 2.14 Smart Investing & Trading Score: 10 | |
| Day Percent Change: -0.93% Day Change: -0.02 | |
| Week Change: -0.93% Year-to-date Change: -12.3% | |
| TRVG Links: Profile News Message Board | |
| Charts:- Daily , Weekly | |
| Add TRVG to Watchlist: View: Get Complete TRVG Trend Analysis ➞ | |
 | MLAB Mesa Laboratories, Inc. |
| Sector: Technology | |
| SubSector: Scientific & Technical Instruments | |
| MarketCap: 935.453 Millions | |
| Recent Price: 91.04 Smart Investing & Trading Score: 20 | |
| Day Percent Change: -0.61% Day Change: -0.56 | |
| Week Change: -0.61% Year-to-date Change: -13.1% | |
| MLAB Links: Profile News Message Board | |
| Charts:- Daily , Weekly | |
| Add MLAB to Watchlist: View: Get Complete MLAB Trend Analysis ➞ | |
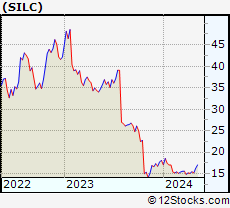 | SILC Silicom Ltd. |
| Sector: Technology | |
| SubSector: Communication Equipment | |
| MarketCap: 178.339 Millions | |
| Recent Price: 15.70 Smart Investing & Trading Score: 61 | |
| Day Percent Change: -1.78% Day Change: -0.29 | |
| Week Change: -1.78% Year-to-date Change: -13.3% | |
| SILC Links: Profile News Message Board | |
| Charts:- Daily , Weekly | |
| Add SILC to Watchlist: View: Get Complete SILC Trend Analysis ➞ | |
 | RMNI Rimini Street, Inc. |
| Sector: Technology | |
| SubSector: Application Software | |
| MarketCap: 288.762 Millions | |
| Recent Price: 2.84 Smart Investing & Trading Score: 42 | |
| Day Percent Change: -0.87% Day Change: -0.02 | |
| Week Change: -0.87% Year-to-date Change: -13.3% | |
| RMNI Links: Profile News Message Board | |
| Charts:- Daily , Weekly | |
| Add RMNI to Watchlist: View: Get Complete RMNI Trend Analysis ➞ | |
 | DGII Digi International Inc. |
| Sector: Technology | |
| SubSector: Communication Equipment | |
| MarketCap: 257.339 Millions | |
| Recent Price: 22.45 Smart Investing & Trading Score: 10 | |
| Day Percent Change: 0.49% Day Change: 0.11 | |
| Week Change: 0.49% Year-to-date Change: -13.7% | |
| DGII Links: Profile News Message Board | |
| Charts:- Daily , Weekly | |
| Add DGII to Watchlist: View: Get Complete DGII Trend Analysis ➞ | |
| For tabular summary view of above stock list: Summary View ➞ 0 - 25 , 25 - 50 , 50 - 75 , 75 - 100 , 100 - 125 , 125 - 150 , 150 - 175 , 175 - 200 , 200 - 225 | ||
| Click To Change The Sort Order: By Market Cap or Company Size Performance: Year-to-date, Week and Day | |
| Select Chart Type: | ||
|
Best Stocks Today 12Stocks.com |
© 2024 12Stocks.com Terms & Conditions Privacy Contact Us
All Information Provided Only For Education And Not To Be Used For Investing or Trading. See Terms & Conditions


One More Thing ... Get Best Stocks Delivered Daily!
Never Ever Miss A Move With Our Top Ten Stocks Lists
Find Best Stocks In Any Market - Bull or Bear Market
Take A Peek At Our Top Ten Stocks Lists: Daily, Weekly, Year-to-Date & Top Trends
Find Best Stocks In Any Market - Bull or Bear Market
Take A Peek At Our Top Ten Stocks Lists: Daily, Weekly, Year-to-Date & Top Trends
Technology Stocks With Best Up Trends [0-bearish to 100-bullish]: Camtek [100], Broadcom [100], Micron [100], Corning [100], Synopsys [100], Arista Networks[100], Lam Research[100], Cadence Design[100], Fabrinet [100], Altair Engineering[100], KLA [100]
Best Technology Stocks Year-to-Date:
2U [391.46%], MicroCloud Hologram[239.57%], Super Micro[212.3%], Uxin [204.56%], Smith Micro[174.82%], NVIDIA [164.73%], MicroStrategy [139.03%], Cheetah Mobile[123.68%], Quantum [123.21%], SoundHound AI[105.14%], CuriosityStream [99.96%] Best Technology Stocks This Week:
Quantum [32.26%], Aerohive Networks[11.43%], VirnetX Holding[10.72%], Kaltura [9.84%], Perion Network[8.36%], Bilibili [6.75%], Duolingo [6.7%], Camtek [6.53%], Autodesk [6.49%], D-Wave Quantum[6.14%], Palantir [6.11%] Best Technology Stocks Daily:
Quantum [32.26%], Aerohive Networks[11.43%], VirnetX Holding[10.72%], Kaltura [9.84%], Perion Network[8.36%], Bilibili [6.75%], Duolingo [6.70%], Camtek [6.53%], Autodesk [6.49%], D-Wave Quantum[6.14%], Palantir [6.11%]