
 Login Sign Up


| |||||
 |  | ||||

| 12Stocks.com Market Intelligence |
Best SmallCap Stocks
|
| In a hurry? Small Cap Stock Lists: Performance Trends Table, Stock Charts
Sort Small Cap stocks: Daily, Weekly, Year-to-Date, Market Cap & Trends. Filter Small Cap stocks list by sector: Show all, Tech, Finance, Energy, Staples, Retail, Industrial, Materials, Utilities and HealthCare Filter Small Cap stocks list by size: All Large Medium Small and MicroCap |
| 12Stocks.com Small Cap Stocks Performances & Trends Daily | |||||||||
|
|  The overall Smart Investing & Trading Score is 18 (0-bearish to 100-bullish) which puts Small Cap index in short term bearish trend. The Smart Investing & Trading Score from previous trading session is 32 and hence a deterioration of trend.
| ||||||||
Here are the Smart Investing & Trading Scores of the most requested small cap stocks at 12Stocks.com (click stock name for detailed review):
|


| 12Stocks.com: Investing in Smallcap Index with Stocks | |
|
The following table helps investors and traders sort through current performance and trends (as measured by Smart Investing & Trading Score) of various
stocks in the Smallcap Index. Quick View: Move mouse or cursor over stock symbol (ticker) to view short-term technical chart and over stock name to view long term chart. Click on  to add stock symbol to your watchlist and to add stock symbol to your watchlist and  to view watchlist. Click on any ticker or stock name for detailed market intelligence report for that stock. to view watchlist. Click on any ticker or stock name for detailed market intelligence report for that stock. |
12Stocks.com Performance of Stocks in Smallcap Index
| Ticker | Stock Name | Watchlist | Category | Recent Price | Smart Investing & Trading Score | Change % | YTD Change% |
| PWSC | PowerSchool |   | Technology | 22.31 | 76 | 0.00 | -5.63% |
| APPF | AppFolio | | Technology | 240.00 | 64 | -0.03 | 38.54% |
| PI | Impinj | | Technology | 152.02 | 63 | -0.05 | 68.85% |
| SANM | Sanmina | | Technology | 67.61 | 76 | -0.06 | 31.61% |
| SQSP | Squarespace | | Technology | 43.74 | 61 | -0.06 | 31.80% |
| STER | Sterling Check | | Technology | 15.40 | 23 | -0.10 | 10.55% |
| VMEO | Vimeo | | Technology | 4.01 | 62 | -0.12 | 2.29% |
| DOMO | Domo | | Technology | 6.66 | 22 | -0.15 | -35.28% |
| AMBA | Ambarella | | Technology | 57.32 | 90 | -0.19 | -6.48% |
| ATEX | Anterix | | Technology | 31.59 | 7 | -0.19 | -5.19% |
| SEMR | Semrush | | Technology | 14.10 | 31 | -0.21 | 1.51% |
| DAKT | Daktronics | | Technology | 11.51 | 90 | -0.26 | 35.73% |
| FN | Fabrinet | | Technology | 237.08 | 59 | -0.26 | 24.56% |
| AGYS | Agilysys | | Technology | 91.59 | 53 | -0.27 | 7.98% |
| QLYS | Qualys | | Technology | 140.10 | 49 | -0.27 | -28.62% |
| MTSI | MACOM | | Technology | 104.98 | 95 | -0.27 | 12.94% |
| NSIT | Insight Enterprises | | Technology | 197.07 | 36 | -0.28 | 11.22% |
| BMI | Badger Meter | | Technology | 188.54 | 61 | -0.30 | 22.14% |
| CCSI | Consensus Cloud | | Technology | 19.93 | 93 | -0.30 | -25.17% |
| IDCC | InterDigital | | Technology | 117.58 | 88 | -0.32 | 8.33% |
| CNXN | PC Connection | | Technology | 64.70 | 25 | -0.32 | -3.73% |
| KN | Knowles | | Technology | 17.92 | 100 | -0.33 | 0.06% |
| ONTF | ON24 | | Technology | 5.67 | 20 | -0.35 | -28.09% |
| BBAI | BigBear.ai | | Technology | 1.40 | 32 | -0.36 | -34.51% |
| CXM | Sprinklr | | Technology | 9.02 | 18 | -0.39 | -25.40% |
| For chart view version of above stock list: Chart View ➞ 0 - 25 , 25 - 50 , 50 - 75 , 75 - 100 , 100 - 125 , 125 - 150 , 150 - 175 , 175 - 200 , 200 - 225 , 225 - 250 | ||
 | Click To Change The Sort Order: By Market Cap or Company Size Performance: Year-to-date, Week and Day |  |
| Too many stocks? View smallcap stocks filtered by marketcap & sector |
| Marketcap: All SmallCap Stocks (default-no microcap), Large, Mid-Range, Small |
| Smallcap Sector: Tech, Finance, Energy, Staples, Retail, Industrial, Materials, & Medical |
|
Get the most comprehensive stock market coverage daily at 12Stocks.com ➞ Best Stocks Today ➞ Best Stocks Weekly ➞ Best Stocks Year-to-Date ➞ Best Stocks Trends ➞  Best Stocks Today 12Stocks.com Best Nasdaq Stocks ➞ Best S&P 500 Stocks ➞ Best Tech Stocks ➞ Best Biotech Stocks ➞ |
| Detailed Overview of SmallCap Stocks |
| SmallCap Technical Overview, Leaders & Laggards, Top SmallCap ETF Funds & Detailed SmallCap Stocks List, Charts, Trends & More |
| Smallcap: Technical Analysis, Trends & YTD Performance | |
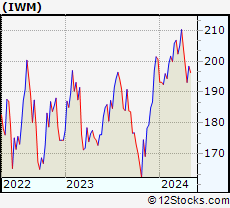
| SmallCap segment as represented by
IWM, an exchange-traded fund [ETF], holds basket of thousands of smallcap stocks from across all major sectors of the US stock market. The smallcap index (contains stocks like Riverbed & Sotheby's) is up by 0.59% and is currently underperforming the overall market by -11.99% year-to-date. Below is a quick view of technical charts and trends: | |
 IWM Weekly Chart |
|
| Long Term Trend: Not Good | |
| Medium Term Trend: Not Good | |
 IWM Daily Chart |
|
| Short Term Trend: Very Good | |
| Overall Trend Score: 18 | |
| YTD Performance: 0.59% | |
| **Trend Scores & Views Are Only For Educational Purposes And Not For Investing | |
| 12Stocks.com: Top Performing Small Cap Index Stocks | ||||||||||||||||||||||||||||||||||||||||||||||||
 The top performing Small Cap Index stocks year to date are
Now, more recently, over last week, the top performing Small Cap Index stocks on the move are


|
||||||||||||||||||||||||||||||||||||||||||||||||
| 12Stocks.com: Investing in Smallcap Index using Exchange Traded Funds | |
|
The following table shows list of key exchange traded funds (ETF) that
help investors track Smallcap index. The following list also includes leveraged ETF funds that track twice or thrice the daily returns of Smallcap indices. Short or inverse ETF funds move in the opposite direction to the index they track and are useful during market pullbacks or during bear markets. Quick View: Move mouse or cursor over ETF symbol (ticker) to view short-term technical chart and over ETF name to view long term chart. Click on ticker or stock name for detailed view. Click on to add stock symbol to your watchlist and to view watchlist. |
12Stocks.com List of ETFs that track Smallcap Index
| Ticker | ETF Name | Watchlist | Recent Price | Smart Investing & Trading Score | Change % | Week % | Year-to-date % |
| IWM | iShares Russell 2000 | | 201.90 | 18 | -0.90 | 0.35 | 0.59% |
| SMLV | SPDR SSGA US Small Cap Low Volatil ETF | | 108.00 | 18 | -0.39 | -0.04 | -4.02% |
| SDD | ProShares UltraShort SmallCap600 | | 18.72 | 70 | 0.96 | -1.69 | 1.58% |
| SBB | ProShares Short SmallCap600 | | 16.20 | 58 | 0.56 | -0.55 | 1.7% |
| SAA | ProShares Ultra SmallCap600 | | 23.69 | 32 | -0.01 | 1.64 | -5.06% |
| 12Stocks.com: Charts, Trends, Fundamental Data and Performances of SmallCap Stocks | |
|
We now take in-depth look at all SmallCap stocks including charts, multi-period performances and overall trends (as measured by Smart Investing & Trading Score). One can sort SmallCap stocks (click link to choose) by Daily, Weekly and by Year-to-Date performances. Also, one can sort by size of the company or by market capitalization. |
| Select Your Default Chart Type: | |||||
| |||||
| Click on stock symbol or name for detailed view. Click on to add stock symbol to your watchlist and to view watchlist. Quick View: Move mouse or cursor over "Daily" to quickly view daily technical stock chart and over "Weekly" to view weekly technical stock chart. | |||||

 | PWSC PowerSchool Holdings, Inc. |
| Sector: Technology | |
| SubSector: Software - Application | |
| MarketCap: 3870 Millions | |
| Recent Price: 22.31 Smart Investing & Trading Score: 76 | |
| Day Percent Change: 0.00% Day Change: 0.00 | |
| Week Change: -0.67% Year-to-date Change: -5.6% | |
| PWSC Links: Profile News Message Board | |
| Charts:- Daily , Weekly | |
| Add PWSC to Watchlist: View: Get Complete PWSC Trend Analysis ➞ | |
 | APPF AppFolio, Inc. |
| Sector: Technology | |
| SubSector: Application Software | |
| MarketCap: 3412.02 Millions | |
| Recent Price: 240.00 Smart Investing & Trading Score: 64 | |
| Day Percent Change: -0.03% Day Change: -0.07 | |
| Week Change: 4.6% Year-to-date Change: 38.5% | |
| APPF Links: Profile News Message Board | |
| Charts:- Daily , Weekly | |
| Add APPF to Watchlist: View: Get Complete APPF Trend Analysis ➞ | |
 | PI Impinj, Inc. |
| Sector: Technology | |
| SubSector: Communication Equipment | |
| MarketCap: 364.739 Millions | |
| Recent Price: 152.02 Smart Investing & Trading Score: 63 | |
| Day Percent Change: -0.05% Day Change: -0.07 | |
| Week Change: 1.41% Year-to-date Change: 68.9% | |
| PI Links: Profile News Message Board | |
| Charts:- Daily , Weekly | |
| Add PI to Watchlist: View: Get Complete PI Trend Analysis ➞ | |
 | SANM Sanmina Corporation |
| Sector: Technology | |
| SubSector: Diversified Electronics | |
| MarketCap: 1790.36 Millions | |
| Recent Price: 67.61 Smart Investing & Trading Score: 76 | |
| Day Percent Change: -0.06% Day Change: -0.04 | |
| Week Change: 2.83% Year-to-date Change: 31.6% | |
| SANM Links: Profile News Message Board | |
| Charts:- Daily , Weekly | |
| Add SANM to Watchlist: View: Get Complete SANM Trend Analysis ➞ | |
 | SQSP Squarespace, Inc. |
| Sector: Technology | |
| SubSector: Software - Infrastructure | |
| MarketCap: 4150 Millions | |
| Recent Price: 43.74 Smart Investing & Trading Score: 61 | |
| Day Percent Change: -0.06% Day Change: -0.03 | |
| Week Change: -0.58% Year-to-date Change: 31.8% | |
| SQSP Links: Profile News Message Board | |
| Charts:- Daily , Weekly | |
| Add SQSP to Watchlist: View: Get Complete SQSP Trend Analysis ➞ | |
 | STER Sterling Check Corp. |
| Sector: Technology | |
| SubSector: Software - Infrastructure | |
| MarketCap: 1180 Millions | |
| Recent Price: 15.40 Smart Investing & Trading Score: 23 | |
| Day Percent Change: -0.10% Day Change: -0.01 | |
| Week Change: 0.2% Year-to-date Change: 10.6% | |
| STER Links: Profile News Message Board | |
| Charts:- Daily , Weekly | |
| Add STER to Watchlist: View: Get Complete STER Trend Analysis ➞ | |
 | VMEO Vimeo, Inc. |
| Sector: Technology | |
| SubSector: Software - Application | |
| MarketCap: 678 Millions | |
| Recent Price: 4.01 Smart Investing & Trading Score: 62 | |
| Day Percent Change: -0.12% Day Change: 0.00 | |
| Week Change: 4.83% Year-to-date Change: 2.3% | |
| VMEO Links: Profile News Message Board | |
| Charts:- Daily , Weekly | |
| Add VMEO to Watchlist: View: Get Complete VMEO Trend Analysis ➞ | |
 | DOMO Domo, Inc. |
| Sector: Technology | |
| SubSector: Application Software | |
| MarketCap: 247.062 Millions | |
| Recent Price: 6.66 Smart Investing & Trading Score: 22 | |
| Day Percent Change: -0.15% Day Change: -0.01 | |
| Week Change: -5.33% Year-to-date Change: -35.3% | |
| DOMO Links: Profile News Message Board | |
| Charts:- Daily , Weekly | |
| Add DOMO to Watchlist: View: Get Complete DOMO Trend Analysis ➞ | |
 | AMBA Ambarella, Inc. |
| Sector: Technology | |
| SubSector: Semiconductor Equipment & Materials | |
| MarketCap: 1509.38 Millions | |
| Recent Price: 57.32 Smart Investing & Trading Score: 90 | |
| Day Percent Change: -0.19% Day Change: -0.11 | |
| Week Change: 0.72% Year-to-date Change: -6.5% | |
| AMBA Links: Profile News Message Board | |
| Charts:- Daily , Weekly | |
| Add AMBA to Watchlist: View: Get Complete AMBA Trend Analysis ➞ | |
 | ATEX Anterix Inc. |
| Sector: Technology | |
| SubSector: Telecom Services - Domestic | |
| MarketCap: 694.077 Millions | |
| Recent Price: 31.59 Smart Investing & Trading Score: 7 | |
| Day Percent Change: -0.19% Day Change: -0.06 | |
| Week Change: -2.38% Year-to-date Change: -5.2% | |
| ATEX Links: Profile News Message Board | |
| Charts:- Daily , Weekly | |
| Add ATEX to Watchlist: View: Get Complete ATEX Trend Analysis ➞ | |
 | SEMR Semrush Holdings, Inc. |
| Sector: Technology | |
| SubSector: Software - Application | |
| MarketCap: 1330 Millions | |
| Recent Price: 14.10 Smart Investing & Trading Score: 31 | |
| Day Percent Change: -0.21% Day Change: -0.03 | |
| Week Change: -7.66% Year-to-date Change: 1.5% | |
| SEMR Links: Profile News Message Board | |
| Charts:- Daily , Weekly | |
| Add SEMR to Watchlist: View: Get Complete SEMR Trend Analysis ➞ | |
 | DAKT Daktronics, Inc. |
| Sector: Technology | |
| SubSector: Computer Based Systems | |
| MarketCap: 223.539 Millions | |
| Recent Price: 11.51 Smart Investing & Trading Score: 90 | |
| Day Percent Change: -0.26% Day Change: -0.03 | |
| Week Change: 1.32% Year-to-date Change: 35.7% | |
| DAKT Links: Profile News Message Board | |
| Charts:- Daily , Weekly | |
| Add DAKT to Watchlist: View: Get Complete DAKT Trend Analysis ➞ | |
 | FN Fabrinet |
| Sector: Technology | |
| SubSector: Electronic Equipment | |
| MarketCap: 1876 Millions | |
| Recent Price: 237.08 Smart Investing & Trading Score: 59 | |
| Day Percent Change: -0.26% Day Change: -0.61 | |
| Week Change: 2.77% Year-to-date Change: 24.6% | |
| FN Links: Profile News Message Board | |
| Charts:- Daily , Weekly | |
| Add FN to Watchlist: View: Get Complete FN Trend Analysis ➞ | |
 | AGYS Agilysys, Inc. |
| Sector: Technology | |
| SubSector: Application Software | |
| MarketCap: 391.862 Millions | |
| Recent Price: 91.59 Smart Investing & Trading Score: 53 | |
| Day Percent Change: -0.27% Day Change: -0.25 | |
| Week Change: -3.62% Year-to-date Change: 8.0% | |
| AGYS Links: Profile News Message Board | |
| Charts:- Daily , Weekly | |
| Add AGYS to Watchlist: View: Get Complete AGYS Trend Analysis ➞ | |
 | QLYS Qualys, Inc. |
| Sector: Technology | |
| SubSector: Application Software | |
| MarketCap: 3475.02 Millions | |
| Recent Price: 140.10 Smart Investing & Trading Score: 49 | |
| Day Percent Change: -0.27% Day Change: -0.38 | |
| Week Change: 3% Year-to-date Change: -28.6% | |
| QLYS Links: Profile News Message Board | |
| Charts:- Daily , Weekly | |
| Add QLYS to Watchlist: View: Get Complete QLYS Trend Analysis ➞ | |
 | MTSI MACOM Technology Solutions Holdings, Inc. |
| Sector: Technology | |
| SubSector: Semiconductor - Broad Line | |
| MarketCap: 1214.42 Millions | |
| Recent Price: 104.98 Smart Investing & Trading Score: 95 | |
| Day Percent Change: -0.27% Day Change: -0.28 | |
| Week Change: 3.53% Year-to-date Change: 12.9% | |
| MTSI Links: Profile News Message Board | |
| Charts:- Daily , Weekly | |
| Add MTSI to Watchlist: View: Get Complete MTSI Trend Analysis ➞ | |
 | NSIT Insight Enterprises, Inc. |
| Sector: Technology | |
| SubSector: Information Technology Services | |
| MarketCap: 1498.48 Millions | |
| Recent Price: 197.07 Smart Investing & Trading Score: 36 | |
| Day Percent Change: -0.28% Day Change: -0.56 | |
| Week Change: -1.27% Year-to-date Change: 11.2% | |
| NSIT Links: Profile News Message Board | |
| Charts:- Daily , Weekly | |
| Add NSIT to Watchlist: View: Get Complete NSIT Trend Analysis ➞ | |
 | BMI Badger Meter, Inc. |
| Sector: Technology | |
| SubSector: Scientific & Technical Instruments | |
| MarketCap: 1530.53 Millions | |
| Recent Price: 188.54 Smart Investing & Trading Score: 61 | |
| Day Percent Change: -0.30% Day Change: -0.57 | |
| Week Change: 1.74% Year-to-date Change: 22.1% | |
| BMI Links: Profile News Message Board | |
| Charts:- Daily , Weekly | |
| Add BMI to Watchlist: View: Get Complete BMI Trend Analysis ➞ | |
 | CCSI Consensus Cloud Solutions, Inc. |
| Sector: Technology | |
| SubSector: Software - Infrastructure | |
| MarketCap: 609 Millions | |
| Recent Price: 19.93 Smart Investing & Trading Score: 93 | |
| Day Percent Change: -0.30% Day Change: -0.06 | |
| Week Change: 7.61% Year-to-date Change: -25.2% | |
| CCSI Links: Profile News Message Board | |
| Charts:- Daily , Weekly | |
| Add CCSI to Watchlist: View: Get Complete CCSI Trend Analysis ➞ | |
 | IDCC InterDigital, Inc. |
| Sector: Technology | |
| SubSector: Wireless Communications | |
| MarketCap: 1225.27 Millions | |
| Recent Price: 117.58 Smart Investing & Trading Score: 88 | |
| Day Percent Change: -0.32% Day Change: -0.38 | |
| Week Change: 0.24% Year-to-date Change: 8.3% | |
| IDCC Links: Profile News Message Board | |
| Charts:- Daily , Weekly | |
| Add IDCC to Watchlist: View: Get Complete IDCC Trend Analysis ➞ | |
 | CNXN PC Connection, Inc. |
| Sector: Technology | |
| SubSector: Computers Wholesale | |
| MarketCap: 1020.19 Millions | |
| Recent Price: 64.70 Smart Investing & Trading Score: 25 | |
| Day Percent Change: -0.32% Day Change: -0.21 | |
| Week Change: -0.58% Year-to-date Change: -3.7% | |
| CNXN Links: Profile News Message Board | |
| Charts:- Daily , Weekly | |
| Add CNXN to Watchlist: View: Get Complete CNXN Trend Analysis ➞ | |
 | KN Knowles Corporation |
| Sector: Technology | |
| SubSector: Communication Equipment | |
| MarketCap: 1231.39 Millions | |
| Recent Price: 17.92 Smart Investing & Trading Score: 100 | |
| Day Percent Change: -0.33% Day Change: -0.06 | |
| Week Change: 2.4% Year-to-date Change: 0.1% | |
| KN Links: Profile News Message Board | |
| Charts:- Daily , Weekly | |
| Add KN to Watchlist: View: Get Complete KN Trend Analysis ➞ | |
 | ONTF ON24, Inc. |
| Sector: Technology | |
| SubSector: Software - Application | |
| MarketCap: 386 Millions | |
| Recent Price: 5.67 Smart Investing & Trading Score: 20 | |
| Day Percent Change: -0.35% Day Change: -0.02 | |
| Week Change: -0.35% Year-to-date Change: -28.1% | |
| ONTF Links: Profile News Message Board | |
| Charts:- Daily , Weekly | |
| Add ONTF to Watchlist: View: Get Complete ONTF Trend Analysis ➞ | |
 | BBAI BigBear.ai Holdings, Inc. |
| Sector: Technology | |
| SubSector: Information Technology Services | |
| MarketCap: 339 Millions | |
| Recent Price: 1.40 Smart Investing & Trading Score: 32 | |
| Day Percent Change: -0.36% Day Change: 0.00 | |
| Week Change: -3.13% Year-to-date Change: -34.5% | |
| BBAI Links: Profile News Message Board | |
| Charts:- Daily , Weekly | |
| Add BBAI to Watchlist: View: Get Complete BBAI Trend Analysis ➞ | |
 | CXM Sprinklr, Inc. |
| Sector: Technology | |
| SubSector: Software - Application | |
| MarketCap: 3700 Millions | |
| Recent Price: 9.02 Smart Investing & Trading Score: 18 | |
| Day Percent Change: -0.39% Day Change: -0.04 | |
| Week Change: 1.07% Year-to-date Change: -25.4% | |
| CXM Links: Profile News Message Board | |
| Charts:- Daily , Weekly | |
| Add CXM to Watchlist: View: Get Complete CXM Trend Analysis ➞ | |
| For tabular summary view of above stock list: Summary View ➞ 0 - 25 , 25 - 50 , 50 - 75 , 75 - 100 , 100 - 125 , 125 - 150 , 150 - 175 , 175 - 200 , 200 - 225 , 225 - 250 | ||
| Click To Change The Sort Order: By Market Cap or Company Size Performance: Year-to-date, Week and Day | |
| Select Chart Type: | ||
| Too many stocks? View smallcap stocks filtered by marketcap & sector |
| Marketcap: All SmallCap Stocks (default-no microcap), Large, Mid-Range, Small & MicroCap |
| Sector: Tech, Finance, Energy, Staples, Retail, Industrial, Materials, Utilities & Medical |
|
Best Stocks Today 12Stocks.com |
© 2024 12Stocks.com Terms & Conditions Privacy Contact Us
All Information Provided Only For Education And Not To Be Used For Investing or Trading. See Terms & Conditions


One More Thing ... Get Best Stocks Delivered Daily!
Never Ever Miss A Move With Our Top Ten Stocks Lists
Find Best Stocks In Any Market - Bull or Bear Market
Take A Peek At Our Top Ten Stocks Lists: Daily, Weekly, Year-to-Date & Top Trends
Find Best Stocks In Any Market - Bull or Bear Market
Take A Peek At Our Top Ten Stocks Lists: Daily, Weekly, Year-to-Date & Top Trends
Smallcap Stocks With Best Up Trends [0-bearish to 100-bullish]: Axcelis [100], Riot Blockchain[100], Blink Charging[100], Avidity Biosciences[100], Redwire [100], Rackspace [100], Mirum [100], Nextracker [100], Independence Realty[100], Krystal Biotech[100], Vita Coco[100]
Best Smallcap Stocks Year-to-Date:
CareMax [526.8%], Li-Cycle [461%], Dominion Midstream[412.65%], Avidity Biosciences[336.67%], Janux [303.16%], Stoke [227.95%], Novavax [226.56%], Longboard [216.04%], Summit [213.6%], Sweetgreen [205.66%], Super Micro[181.78%] Best Smallcap Stocks This Week:
Dominion Midstream[685.71%], Avidity Biosciences[48.4%], Kaltura [44.96%], Biomea Fusion[38.65%], Scilex Holding[37.61%], Eos Energy[36.42%], Nerdy [28.91%], Enovix [26.29%], Cipher Mining[23.33%], Li-Cycle [23.32%], 89bio [21.17%] Best Smallcap Stocks Daily:
Biomea Fusion[24.11%], Cipher Mining[9.11%], Nerdy [8.91%], Vanda [8.78%], Replimune Group[7.14%], Korn Ferry[7.03%], Li-Cycle [6.40%], Cue Biopharma[6.00%], MBIA [5.35%], Torrid [5.30%], Axcelis [5.20%]