
 Login Sign Up


| |||||
 |  | ||||

| 12Stocks.com Market Intelligence |
Best Materials Stocks
| In a hurry? Materials Stocks Lists: Performance Trends Table, Stock Charts
Sort Materials stocks: Daily, Weekly, Year-to-Date, Market Cap & Trends. Filter Materials stocks list by size: All Materials Large Mid-Range Small |
| 12Stocks.com Materials Stocks Performances & Trends Daily | |||||||||
|
|  The overall Smart Investing & Trading Score is 83 (0-bearish to 100-bullish) which puts Materials sector in short term bullish trend. The Smart Investing & Trading Score from previous trading session is 68 and hence an improvement of trend.
| ||||||||
Here are the Smart Investing & Trading Scores of the most requested Materials stocks at 12Stocks.com (click stock name for detailed review):
|


| Consider signing up for our daily 12Stocks.com "Best Stocks Newsletter". You will never ever miss a big stock move again! |
| 12Stocks.com: Investing in Materials sector with Stocks | |
|
The following table helps investors and traders sort through current performance and trends (as measured by Smart Investing & Trading Score) of various
stocks in the Materials sector. Quick View: Move mouse or cursor over stock symbol (ticker) to view short-term Technical chart and over stock name to view long term chart. Click on  to add stock symbol to your watchlist and to add stock symbol to your watchlist and  to view watchlist. Click on any ticker or stock name for detailed market intelligence report for that stock. to view watchlist. Click on any ticker or stock name for detailed market intelligence report for that stock. |
12Stocks.com Performance of Stocks in Materials Sector
| Ticker | Stock Name | Watchlist | Category | Recent Price | Smart Investing & Trading Score | Change % | YTD Change% |
| ASH | Ashland Global |   | Chemicals | 97.02 | 90 | 1.00 | 15.08% |
| WLK | Westlake Chemical | | Chemicals | 151.00 | 68 | 0.97 | 7.89% |
| METCB | Ramaco | | Coking Coal | 11.64 | 28 | 0.95 | -12.15% |
| NWPX | Northwest Pipe | | Steel & Iron | 32.11 | 68 | 0.94 | 6.11% |
| AGI | Alamos Gold | | Gold | 15.44 | 95 | 0.92 | 14.63% |
| ASIX | AdvanSix | | Chemicals | 26.25 | 53 | 0.92 | -12.38% |
| DOW | Dow | | Chemicals | 57.80 | 76 | 0.89 | 5.40% |
| APD | Air Products | | Chemicals | 238.12 | 74 | 0.86 | -13.03% |
| BTG | B2Gold | | Gold | 2.64 | 54 | 0.76 | -16.46% |
| STLD | Steel Dynamics | | Steel & Iron | 135.04 | 63 | 0.75 | 14.34% |
| PRM | Perimeter | | Chemicals | 7.11 | 68 | 0.71 | 54.73% |
| ARCH | Arch Coal | | Metals/Minerals | 165.59 | 52 | 0.71 | -0.21% |
| SA | Seabridge Gold | | Gold | 16.00 | 75 | 0.69 | 31.90% |
| BHP | BHP | | Metals/Minerals | 56.81 | 10 | 0.67 | -16.84% |
| SCL | Stepan | | Chemicals | 84.53 | 67 | 0.65 | -10.60% |
| FF | FutureFuel | | Chemicals | 5.59 | 40 | 0.54 | -8.06% |
| IAG | IAMGOLD | | Gold | 3.80 | 90 | 0.53 | 50.20% |
| SAND | Sandstorm Gold | | Gold | 5.66 | 95 | 0.53 | 12.52% |
| UAN | CVR Partners | | Chemicals | 82.25 | 95 | 0.46 | 25.57% |
| PPG | PPG Industries | | Chemicals | 130.74 | 35 | 0.45 | -12.58% |
| ASTL | Algoma Steel | | Steel | 7.89 | 42 | 0.45 | -20.94% |
| AEM | Agnico Eagle | | Gold | 65.81 | 88 | 0.44 | 19.98% |
| CTVA | Corteva | | Chemicals | 55.13 | 90 | 0.37 | 15.04% |
| SID | Companhia Siderurgica | | Steel & Iron | 2.78 | 42 | 0.36 | -29.26% |
| FNV | Franco-Nevada | | Gold | 123.37 | 95 | 0.36 | 11.33% |
| For chart view version of above stock list: Chart View ➞ 0 - 25 , 25 - 50 , 50 - 75 , 75 - 100 , 100 - 125 , 125 - 150 , 150 - 175 | ||
 | Click To Change The Sort Order: By Market Cap or Company Size Performance: Year-to-date, Week and Day |  |
|
Get the most comprehensive stock market coverage daily at 12Stocks.com ➞ Best Stocks Today ➞ Best Stocks Weekly ➞ Best Stocks Year-to-Date ➞ Best Stocks Trends ➞  Best Stocks Today 12Stocks.com Best Nasdaq Stocks ➞ Best S&P 500 Stocks ➞ Best Tech Stocks ➞ Best Biotech Stocks ➞ |
| Detailed Overview of Materials Stocks |
| Materials Technical Overview, Leaders & Laggards, Top Materials ETF Funds & Detailed Materials Stocks List, Charts, Trends & More |
| Materials Sector: Technical Analysis, Trends & YTD Performance | |
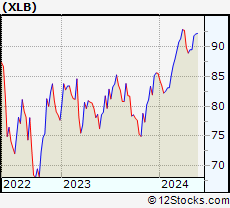
| Materials sector is composed of stocks
from mining, metals, agricultural, precious metals
and chemical subsectors. Materials sector, as represented by XLB, an exchange-traded fund [ETF] that holds basket of Materials stocks (e.g, Dow Chemical, Newmont Mining) is up by 5.53% and is currently underperforming the overall market by -1.03% year-to-date. Below is a quick view of Technical charts and trends: |
|
 XLB Weekly Chart |
|
| Long Term Trend: Very Good | |
| Medium Term Trend: Good | |
 XLB Daily Chart |
|
| Short Term Trend: Very Good | |
| Overall Trend Score: 83 | |
| YTD Performance: 5.53% | |
| **Trend Scores & Views Are Only For Educational Purposes And Not For Investing | |
| 12Stocks.com: Top Performing Materials Sector Stocks | ||||||||||||||||||||||||||||||||||||||||||||||||
 The top performing Materials sector stocks year to date are
Now, more recently, over last week, the top performing Materials sector stocks on the move are


|
||||||||||||||||||||||||||||||||||||||||||||||||
| 12Stocks.com: Investing in Materials Sector using Exchange Traded Funds | |
|
The following table shows list of key exchange traded funds (ETF) that
help investors track Materials Index. For detailed view, check out our ETF Funds section of our website. Quick View: Move mouse or cursor over ETF symbol (ticker) to view short-term Technical chart and over ETF name to view long term chart. Click on ticker or stock name for detailed view. Click on to add stock symbol to your watchlist and to view watchlist. |
12Stocks.com List of ETFs that track Materials Index
| Ticker | ETF Name | Watchlist | Recent Price | Smart Investing & Trading Score | Change % | Week % | Year-to-date % |
| XLB | Materials | | 90.27 | 83 | 0.84 | 0.84 | 5.53% |
| IYM | Basic Materials | | 143.77 | 83 | 1.04 | 1.04 | 4.06% |
| VAW | Materials | | 198.03 | 83 | 0.94 | 0.94 | 4.26% |
| GDX | Gold Miners | | 34.78 | 88 | 0.58 | 0.58 | 12.16% |
| UYM | Basic Materials | | 27.17 | 83 | 1.00 | 1 | 8.95% |
| XME | Metals and Mining | | 61.39 | 83 | 0.89 | 0.89 | 2.61% |
| MOO | Agribusiness | | 72.67 | 95 | 1.24 | 1.24 | -4.61% |
| DBA | Agriculture | | 25.10 | 36 | -3.61 | -3.61 | 21.02% |
| GLD | Gold | | 216.18 | 76 | -0.20 | -0.2 | 13.08% |
| SLV | Silver | | 24.83 | 54 | -0.24 | -0.24 | 14% |
| SLX | Steel | | 70.06 | 58 | 0.39 | 0.39 | -5.01% |
| COPX | Copper Miners | | 48.02 | 95 | 1.05 | 1.05 | 28.05% |
| SIL | Silver Miners | | 32.03 | 88 | 0.25 | 0.25 | 12.9% |
| MXI | Global Materials | | 88.43 | 83 | 1.01 | 1.01 | 1.34% |
| GDXJ | Junior Gold Miners | | 42.67 | 90 | 0.66 | 0.66 | 12.56% |
| PSCM | SmallCap Materials | | 75.06 | 83 | 0.03 | 0.03 | 1.71% |
| 12Stocks.com: Charts, Trends, Fundamental Data and Performances of Materials Stocks | |
|
We now take in-depth look at all Materials stocks including charts, multi-period performances and overall trends (as measured by Smart Investing & Trading Score). One can sort Materials stocks (click link to choose) by Daily, Weekly and by Year-to-Date performances. Also, one can sort by size of the company or by market capitalization. |
| Select Your Default Chart Type: | |||||
| |||||
| Click on stock symbol or name for detailed view. Click on to add stock symbol to your watchlist and to view watchlist. Quick View: Move mouse or cursor over "Daily" to quickly view daily Technical stock chart and over "Weekly" to view weekly Technical stock chart. | |||||

 | ASH Ashland Global Holdings Inc. |
| Sector: Materials | |
| SubSector: Chemicals - Major Diversified | |
| MarketCap: 2764.16 Millions | |
| Recent Price: 97.02 Smart Investing & Trading Score: 90 | |
| Day Percent Change: 1.00% Day Change: 0.96 | |
| Week Change: 1% Year-to-date Change: 15.1% | |
| ASH Links: Profile News Message Board | |
| Charts:- Daily , Weekly | |
| Add ASH to Watchlist: View: Get Complete ASH Trend Analysis ➞ | |
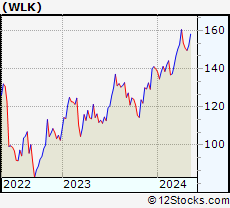 | WLK Westlake Chemical Corporation |
| Sector: Materials | |
| SubSector: Specialty Chemicals | |
| MarketCap: 5221.47 Millions | |
| Recent Price: 151.00 Smart Investing & Trading Score: 68 | |
| Day Percent Change: 0.97% Day Change: 1.45 | |
| Week Change: 0.97% Year-to-date Change: 7.9% | |
| WLK Links: Profile News Message Board | |
| Charts:- Daily , Weekly | |
| Add WLK to Watchlist: View: Get Complete WLK Trend Analysis ➞ | |
 | METCB Ramaco Resources, Inc. |
| Sector: Materials | |
| SubSector: Coking Coal | |
| MarketCap: 469 Millions | |
| Recent Price: 11.64 Smart Investing & Trading Score: 28 | |
| Day Percent Change: 0.95% Day Change: 0.11 | |
| Week Change: 0.95% Year-to-date Change: -12.2% | |
| METCB Links: Profile News Message Board | |
| Charts:- Daily , Weekly | |
| Add METCB to Watchlist: View: Get Complete METCB Trend Analysis ➞ | |
 | NWPX Northwest Pipe Company |
| Sector: Materials | |
| SubSector: Steel & Iron | |
| MarketCap: 245.788 Millions | |
| Recent Price: 32.11 Smart Investing & Trading Score: 68 | |
| Day Percent Change: 0.94% Day Change: 0.30 | |
| Week Change: 0.94% Year-to-date Change: 6.1% | |
| NWPX Links: Profile News Message Board | |
| Charts:- Daily , Weekly | |
| Add NWPX to Watchlist: View: Get Complete NWPX Trend Analysis ➞ | |
 | AGI Alamos Gold Inc. |
| Sector: Materials | |
| SubSector: Gold | |
| MarketCap: 1740.39 Millions | |
| Recent Price: 15.44 Smart Investing & Trading Score: 95 | |
| Day Percent Change: 0.92% Day Change: 0.14 | |
| Week Change: 0.92% Year-to-date Change: 14.6% | |
| AGI Links: Profile News Message Board | |
| Charts:- Daily , Weekly | |
| Add AGI to Watchlist: View: Get Complete AGI Trend Analysis ➞ | |
 | ASIX AdvanSix Inc. |
| Sector: Materials | |
| SubSector: Chemicals - Major Diversified | |
| MarketCap: 394.136 Millions | |
| Recent Price: 26.25 Smart Investing & Trading Score: 53 | |
| Day Percent Change: 0.92% Day Change: 0.24 | |
| Week Change: 0.92% Year-to-date Change: -12.4% | |
| ASIX Links: Profile News Message Board | |
| Charts:- Daily , Weekly | |
| Add ASIX to Watchlist: View: Get Complete ASIX Trend Analysis ➞ | |
 | DOW Dow Inc. |
| Sector: Materials | |
| SubSector: Chemicals - Major Diversified | |
| MarketCap: 24098.6 Millions | |
| Recent Price: 57.80 Smart Investing & Trading Score: 76 | |
| Day Percent Change: 0.89% Day Change: 0.51 | |
| Week Change: 0.89% Year-to-date Change: 5.4% | |
| DOW Links: Profile News Message Board | |
| Charts:- Daily , Weekly | |
| Add DOW to Watchlist: View: Get Complete DOW Trend Analysis ➞ | |
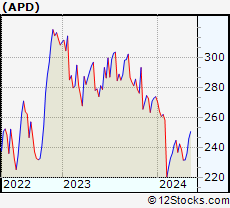 | APD Air Products and Chemicals, Inc. |
| Sector: Materials | |
| SubSector: Chemicals - Major Diversified | |
| MarketCap: 46203.6 Millions | |
| Recent Price: 238.12 Smart Investing & Trading Score: 74 | |
| Day Percent Change: 0.86% Day Change: 2.04 | |
| Week Change: 0.86% Year-to-date Change: -13.0% | |
| APD Links: Profile News Message Board | |
| Charts:- Daily , Weekly | |
| Add APD to Watchlist: View: Get Complete APD Trend Analysis ➞ | |
 | BTG B2Gold Corp. |
| Sector: Materials | |
| SubSector: Gold | |
| MarketCap: 2792.39 Millions | |
| Recent Price: 2.64 Smart Investing & Trading Score: 54 | |
| Day Percent Change: 0.76% Day Change: 0.02 | |
| Week Change: 0.76% Year-to-date Change: -16.5% | |
| BTG Links: Profile News Message Board | |
| Charts:- Daily , Weekly | |
| Add BTG to Watchlist: View: Get Complete BTG Trend Analysis ➞ | |
 | STLD Steel Dynamics, Inc. |
| Sector: Materials | |
| SubSector: Steel & Iron | |
| MarketCap: 4533.58 Millions | |
| Recent Price: 135.04 Smart Investing & Trading Score: 63 | |
| Day Percent Change: 0.75% Day Change: 1.00 | |
| Week Change: 0.75% Year-to-date Change: 14.3% | |
| STLD Links: Profile News Message Board | |
| Charts:- Daily , Weekly | |
| Add STLD to Watchlist: View: Get Complete STLD Trend Analysis ➞ | |
 | PRM Perimeter Solutions, SA |
| Sector: Materials | |
| SubSector: Specialty Chemicals | |
| MarketCap: 930 Millions | |
| Recent Price: 7.11 Smart Investing & Trading Score: 68 | |
| Day Percent Change: 0.71% Day Change: 0.05 | |
| Week Change: 0.71% Year-to-date Change: 54.7% | |
| PRM Links: Profile News Message Board | |
| Charts:- Daily , Weekly | |
| Add PRM to Watchlist: View: Get Complete PRM Trend Analysis ➞ | |
 | ARCH Arch Coal, Inc. |
| Sector: Materials | |
| SubSector: Industrial Metals & Minerals | |
| MarketCap: 547.21 Millions | |
| Recent Price: 165.59 Smart Investing & Trading Score: 52 | |
| Day Percent Change: 0.71% Day Change: 1.17 | |
| Week Change: 0.71% Year-to-date Change: -0.2% | |
| ARCH Links: Profile News Message Board | |
| Charts:- Daily , Weekly | |
| Add ARCH to Watchlist: View: Get Complete ARCH Trend Analysis ➞ | |
 | SA Seabridge Gold Inc. |
| Sector: Materials | |
| SubSector: Gold | |
| MarketCap: 565.419 Millions | |
| Recent Price: 16.00 Smart Investing & Trading Score: 75 | |
| Day Percent Change: 0.69% Day Change: 0.11 | |
| Week Change: 0.69% Year-to-date Change: 31.9% | |
| SA Links: Profile News Message Board | |
| Charts:- Daily , Weekly | |
| Add SA to Watchlist: View: Get Complete SA Trend Analysis ➞ | |
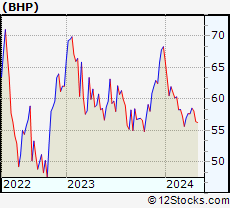 | BHP BHP Group |
| Sector: Materials | |
| SubSector: Industrial Metals & Minerals | |
| MarketCap: 86605.2 Millions | |
| Recent Price: 56.81 Smart Investing & Trading Score: 10 | |
| Day Percent Change: 0.67% Day Change: 0.38 | |
| Week Change: 0.67% Year-to-date Change: -16.8% | |
| BHP Links: Profile News Message Board | |
| Charts:- Daily , Weekly | |
| Add BHP to Watchlist: View: Get Complete BHP Trend Analysis ➞ | |
 | SCL Stepan Company |
| Sector: Materials | |
| SubSector: Specialty Chemicals | |
| MarketCap: 1812.97 Millions | |
| Recent Price: 84.53 Smart Investing & Trading Score: 67 | |
| Day Percent Change: 0.65% Day Change: 0.55 | |
| Week Change: 0.65% Year-to-date Change: -10.6% | |
| SCL Links: Profile News Message Board | |
| Charts:- Daily , Weekly | |
| Add SCL to Watchlist: View: Get Complete SCL Trend Analysis ➞ | |
 | FF FutureFuel Corp. |
| Sector: Materials | |
| SubSector: Chemicals - Major Diversified | |
| MarketCap: 450.736 Millions | |
| Recent Price: 5.59 Smart Investing & Trading Score: 40 | |
| Day Percent Change: 0.54% Day Change: 0.03 | |
| Week Change: 0.54% Year-to-date Change: -8.1% | |
| FF Links: Profile News Message Board | |
| Charts:- Daily , Weekly | |
| Add FF to Watchlist: View: Get Complete FF Trend Analysis ➞ | |
 | IAG IAMGOLD Corporation |
| Sector: Materials | |
| SubSector: Gold | |
| MarketCap: 1158.09 Millions | |
| Recent Price: 3.80 Smart Investing & Trading Score: 90 | |
| Day Percent Change: 0.53% Day Change: 0.02 | |
| Week Change: 0.53% Year-to-date Change: 50.2% | |
| IAG Links: Profile News Message Board | |
| Charts:- Daily , Weekly | |
| Add IAG to Watchlist: View: Get Complete IAG Trend Analysis ➞ | |
 | SAND Sandstorm Gold Ltd. |
| Sector: Materials | |
| SubSector: Gold | |
| MarketCap: 808.119 Millions | |
| Recent Price: 5.66 Smart Investing & Trading Score: 95 | |
| Day Percent Change: 0.53% Day Change: 0.03 | |
| Week Change: 0.53% Year-to-date Change: 12.5% | |
| SAND Links: Profile News Message Board | |
| Charts:- Daily , Weekly | |
| Add SAND to Watchlist: View: Get Complete SAND Trend Analysis ➞ | |
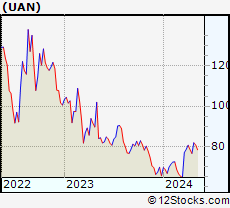 | UAN CVR Partners, LP |
| Sector: Materials | |
| SubSector: Agricultural Chemicals | |
| MarketCap: 118.529 Millions | |
| Recent Price: 82.25 Smart Investing & Trading Score: 95 | |
| Day Percent Change: 0.46% Day Change: 0.38 | |
| Week Change: 0.46% Year-to-date Change: 25.6% | |
| UAN Links: Profile News Message Board | |
| Charts:- Daily , Weekly | |
| Add UAN to Watchlist: View: Get Complete UAN Trend Analysis ➞ | |
 | PPG PPG Industries, Inc. |
| Sector: Materials | |
| SubSector: Specialty Chemicals | |
| MarketCap: 20285.5 Millions | |
| Recent Price: 130.74 Smart Investing & Trading Score: 35 | |
| Day Percent Change: 0.45% Day Change: 0.58 | |
| Week Change: 0.45% Year-to-date Change: -12.6% | |
| PPG Links: Profile News Message Board | |
| Charts:- Daily , Weekly | |
| Add PPG to Watchlist: View: Get Complete PPG Trend Analysis ➞ | |
 | ASTL Algoma Steel Group Inc. |
| Sector: Materials | |
| SubSector: Steel | |
| MarketCap: 731 Millions | |
| Recent Price: 7.89 Smart Investing & Trading Score: 42 | |
| Day Percent Change: 0.45% Day Change: 0.03 | |
| Week Change: 0.45% Year-to-date Change: -20.9% | |
| ASTL Links: Profile News Message Board | |
| Charts:- Daily , Weekly | |
| Add ASTL to Watchlist: View: Get Complete ASTL Trend Analysis ➞ | |
 | AEM Agnico Eagle Mines Limited |
| Sector: Materials | |
| SubSector: Gold | |
| MarketCap: 9491.49 Millions | |
| Recent Price: 65.81 Smart Investing & Trading Score: 88 | |
| Day Percent Change: 0.44% Day Change: 0.29 | |
| Week Change: 0.44% Year-to-date Change: 20.0% | |
| AEM Links: Profile News Message Board | |
| Charts:- Daily , Weekly | |
| Add AEM to Watchlist: View: Get Complete AEM Trend Analysis ➞ | |
 | CTVA Corteva, Inc. |
| Sector: Materials | |
| SubSector: Agricultural Chemicals | |
| MarketCap: 18894.3 Millions | |
| Recent Price: 55.13 Smart Investing & Trading Score: 90 | |
| Day Percent Change: 0.37% Day Change: 0.20 | |
| Week Change: 0.37% Year-to-date Change: 15.0% | |
| CTVA Links: Profile News Message Board | |
| Charts:- Daily , Weekly | |
| Add CTVA to Watchlist: View: Get Complete CTVA Trend Analysis ➞ | |
 | SID Companhia Siderurgica Nacional |
| Sector: Materials | |
| SubSector: Steel & Iron | |
| MarketCap: 2087.58 Millions | |
| Recent Price: 2.78 Smart Investing & Trading Score: 42 | |
| Day Percent Change: 0.36% Day Change: 0.01 | |
| Week Change: 0.36% Year-to-date Change: -29.3% | |
| SID Links: Profile News Message Board | |
| Charts:- Daily , Weekly | |
| Add SID to Watchlist: View: Get Complete SID Trend Analysis ➞ | |
 | FNV Franco-Nevada Corporation |
| Sector: Materials | |
| SubSector: Gold | |
| MarketCap: 17703.9 Millions | |
| Recent Price: 123.37 Smart Investing & Trading Score: 95 | |
| Day Percent Change: 0.36% Day Change: 0.44 | |
| Week Change: 0.36% Year-to-date Change: 11.3% | |
| FNV Links: Profile News Message Board | |
| Charts:- Daily , Weekly | |
| Add FNV to Watchlist: View: Get Complete FNV Trend Analysis ➞ | |
| For tabular summary view of above stock list: Summary View ➞ 0 - 25 , 25 - 50 , 50 - 75 , 75 - 100 , 100 - 125 , 125 - 150 , 150 - 175 | ||
| Click To Change The Sort Order: By Market Cap or Company Size Performance: Year-to-date, Week and Day | |
| Select Chart Type: | ||
|
Best Stocks Today 12Stocks.com |
© 2024 12Stocks.com Terms & Conditions Privacy Contact Us
All Information Provided Only For Education And Not To Be Used For Investing or Trading. See Terms & Conditions


One More Thing ... Get Best Stocks Delivered Daily!
Never Ever Miss A Move With Our Top Ten Stocks Lists
Find Best Stocks In Any Market - Bull or Bear Market
Take A Peek At Our Top Ten Stocks Lists: Daily, Weekly, Year-to-Date & Top Trends
Find Best Stocks In Any Market - Bull or Bear Market
Take A Peek At Our Top Ten Stocks Lists: Daily, Weekly, Year-to-Date & Top Trends
Materials Stocks With Best Up Trends [0-bearish to 100-bullish]: Albemarle [100], Ingevity [100], Alliance [100], Methanex [100], Sensient Technologies[100], Compania de[100], Hudbay Minerals[100], Warrior Met[100], Minerals Technologies[100], Teck [100], Flavors[100]
Best Materials Stocks Year-to-Date:
TuanChe [706.69%], McEwen [69.49%], Hudbay Minerals[59.78%], Gatos Silver[54.96%], Perimeter [54.73%], Coeur [50.61%], IAMGOLD [50.2%], Harmony Gold[48.13%], Gold Royalty[48.1%], Century Aluminum[48.06%], Southern Copper[40.41%] Best Materials Stocks This Week:
Origin [8.44%], Albemarle [7.57%], Sociedad Quimica[6.96%], Rayonier Advanced[6.17%], Denison Mines[5.42%], Ingevity [5.03%], Alliance [4.87%], Uranium Energy[4.78%], Ivanhoe Electric[4.78%], Methanex [4.47%], NovaGold [4.08%] Best Materials Stocks Daily:
Origin [8.44%], Albemarle [7.57%], Sociedad Quimica[6.96%], Rayonier Advanced[6.17%], Denison Mines[5.42%], Ingevity [5.03%], Alliance [4.87%], Uranium Energy[4.78%], Ivanhoe Electric[4.78%], Methanex [4.47%], NovaGold [4.08%]