
 Login Sign Up


| |||||
 |  | ||||

| 12Stocks.com Market Intelligence |
Best Industrial Stocks
| In a hurry? Industrial Stocks Lists: Performance Trends Table, Stock Charts
Sort Industrial stocks: Daily, Weekly, Year-to-Date, Market Cap & Trends. Filter Industrial stocks list by size:All Industrial Large Mid-Range Small |
| 12Stocks.com Industrial Stocks Performances & Trends Daily | |||||||||
|
|  The overall Smart Investing & Trading Score is 85 (0-bearish to 100-bullish) which puts Industrial sector in short term bullish trend. The Smart Investing & Trading Score from previous trading session is 73 and an improvement of trend continues.
| ||||||||
Here are the Smart Investing & Trading Scores of the most requested Industrial stocks at 12Stocks.com (click stock name for detailed review):
|


| 12Stocks.com: Investing in Industrial sector with Stocks | |
|
The following table helps investors and traders sort through current performance and trends (as measured by Smart Investing & Trading Score) of various
stocks in the Industrial sector. Quick View: Move mouse or cursor over stock symbol (ticker) to view short-term Technical chart and over stock name to view long term chart. Click on  to add stock symbol to your watchlist and to add stock symbol to your watchlist and  to view watchlist. Click on any ticker or stock name for detailed market intelligence report for that stock. to view watchlist. Click on any ticker or stock name for detailed market intelligence report for that stock. |
12Stocks.com Performance of Stocks in Industrial Sector
| Ticker | Stock Name | Watchlist | Category | Recent Price | Smart Investing & Trading Score | Change % | Weekly Change% |
| HLIO | Helios Technologies |   | Machinery | 48.40 | 100 | 2.26% | 0.73% |
| MHO | M/I Homes | | Residential | 122.88 | 59 | -0.86% | 0.70% |
| FIP | FTAI Infrastructure | | Industrials | 7.34 | 83 | 0.82% | 0.69% |
| CAE | CAE | | Aerospace/Defense | 20.60 | 95 | -0.77% | 0.64% |
| IEX | IDEX | | Machinery | 221.75 | 25 | -0.18% | 0.60% |
| ROP | Roper Technologies | | Machinery | 520.26 | 42 | 0.92% | 0.59% |
| TKR | Timken | | Machine Tools | 90.01 | 88 | 0.39% | 0.58% |
| AWI | Armstrong World | | Building Materials | 116.28 | 54 | -0.45% | 0.58% |
| WTTR | Select Energy | | Pollution & Treatment Controls | 9.21 | 68 | 0.77% | 0.55% |
| TREX | Trex | | Building Materials | 92.51 | 83 | -0.92% | 0.54% |
| HON | Honeywell | | Machinery | 196.85 | 64 | 0.95% | 0.53% |
| APT | Alpha Pro | | Building Materials | 6.12 | 71 | -0.65% | 0.49% |
| BROG | Brooge | | Conglomerates | 1.04 | 45 | 0.48% | 0.48% |
| GRC | Gorman-Rupp | | Machinery | 32.85 | 32 | 0.18% | 0.43% |
| LNN | Lindsay | | Machinery | 118.78 | 60 | 0.06% | 0.41% |
| HAYN | Haynes | | Fabrication | 59.48 | 31 | -0.17% | 0.41% |
| CVCO | Cavco Industries | | Residential | 378.60 | 73 | -0.77% | 0.34% |
| PHM | Pulte | | Residential | 116.95 | 85 | -0.59% | 0.27% |
| PLPC | Preformed Line | | Electrical Equipment | 127.01 | 57 | 1.33% | 0.21% |
| HRT | HireRight | | Staffing & Employment | 14.36 | 83 | 0.07% | 0.21% |
| GVA | Granite Construction | | Heavy Construction | 59.51 | 100 | -0.45% | 0.20% |
| SEB | Seaboard | | Conglomerates | 3226.13 | 28 | 1.11% | 0.19% |
| ESLT | Elbit Systems | | Aerospace/Defense | 202.71 | 42 | 1.15% | 0.19% |
| TNC | Tennant | | Machinery | 107.15 | 0 | 0.15% | 0.17% |
| DHR | Danaher | | Machinery | 248.76 | 62 | 0.55% | 0.15% |
| For chart view version of above stock list: Chart View ➞ 0 - 25 , 25 - 50 , 50 - 75 , 75 - 100 , 100 - 125 , 125 - 150 , 150 - 175 , 175 - 200 , 200 - 225 , 225 - 250 , 250 - 275 , 275 - 300 | ||
 | Click To Change The Sort Order: By Market Cap or Company Size Performance: Year-to-date, Week and Day |  |
|
Get the most comprehensive stock market coverage daily at 12Stocks.com ➞ Best Stocks Today ➞ Best Stocks Weekly ➞ Best Stocks Year-to-Date ➞ Best Stocks Trends ➞  Best Stocks Today 12Stocks.com Best Nasdaq Stocks ➞ Best S&P 500 Stocks ➞ Best Tech Stocks ➞ Best Biotech Stocks ➞ |
| Detailed Overview of Industrial Stocks |
| Industrial Technical Overview, Leaders & Laggards, Top Industrial ETF Funds & Detailed Industrial Stocks List, Charts, Trends & More |
| Industrial Sector: Technical Analysis, Trends & YTD Performance | |
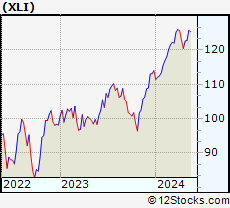
| Industrial sector is composed of stocks
from industrial machinery, aerospace, defense, farm/construction
and industrial services subsectors. Industrial sector, as represented by XLI, an exchange-traded fund [ETF] that holds basket of Industrial stocks (e.g, Caterpillar, Boeing) is up by 9.09% and is currently outperforming the overall market by 0.97% year-to-date. Below is a quick view of Technical charts and trends: |
|
 XLI Weekly Chart |
|
| Long Term Trend: Good | |
| Medium Term Trend: Good | |
 XLI Daily Chart |
|
| Short Term Trend: Very Good | |
| Overall Trend Score: 85 | |
| YTD Performance: 9.09% | |
| **Trend Scores & Views Are Only For Educational Purposes And Not For Investing | |
| 12Stocks.com: Top Performing Industrial Sector Stocks | ||||||||||||||||||||||||||||||||||||||||||||||||
 The top performing Industrial sector stocks year to date are
Now, more recently, over last week, the top performing Industrial sector stocks on the move are


|
||||||||||||||||||||||||||||||||||||||||||||||||
| 12Stocks.com: Investing in Industrial Sector using Exchange Traded Funds | |
|
The following table shows list of key exchange traded funds (ETF) that
help investors track Industrial Index. For detailed view, check out our ETF Funds section of our website. Quick View: Move mouse or cursor over ETF symbol (ticker) to view short-term Technical chart and over ETF name to view long term chart. Click on ticker or stock name for detailed view. Click on to add stock symbol to your watchlist and to view watchlist. |
12Stocks.com List of ETFs that track Industrial Index
| Ticker | ETF Name | Watchlist | Recent Price | Smart Investing & Trading Score | Change % | Week % | Year-to-date % |
| XLI | Industrial | | 124.35 | 85 | 0.27 | 1.29 | 9.09% |
| UXI | Industrials | | 33.46 | 85 | 0.63 | 2.17 | 16.2% |
| PPA | Aerospace & Defense | | 103.88 | 95 | -0.31 | 0.92 | 12.72% |
| ITA | Aerospace & Defense | | 133.44 | 88 | -0.13 | 0.66 | 5.4% |
| ITB | Home Construction | | 107.94 | 77 | -0.85 | 0.53 | 6.1% |
| XHB | Homebuilders | | 105.77 | 73 | -1.02 | 0.52 | 10.57% |
| SIJ | Short Industrials | | 9.61 | 10 | -0.93 | -2.54 | -15.26% |
| IYJ | Industrials | | 123.03 | 90 | 0.47 | 1.53 | 7.58% |
| EXI | Global Industrials | | 138.39 | 90 | -0.29 | 0.77 | 8.6% |
| VIS | Industrials | | 240.36 | 95 | 0.12 | 1.22 | 9.04% |
| PSCI | SmallCap Industrials | | 122.22 | 90 | 0.07 | 1.09 | 5.4% |
| XAR | Aerospace & Defense | | 141.06 | 78 | -0.47 | 1.13 | 4.16% |
| ARKQ | ARK Industrial Innovation | | 54.57 | 65 | -0.84 | 0.85 | -5.42% |
| 12Stocks.com: Charts, Trends, Fundamental Data and Performances of Industrial Stocks | |
|
We now take in-depth look at all Industrial stocks including charts, multi-period performances and overall trends (as measured by Smart Investing & Trading Score). One can sort Industrial stocks (click link to choose) by Daily, Weekly and by Year-to-Date performances. Also, one can sort by size of the company or by market capitalization. |
| Select Your Default Chart Type: | |||||
| |||||
| Click on stock symbol or name for detailed view. Click on to add stock symbol to your watchlist and to view watchlist. Quick View: Move mouse or cursor over "Daily" to quickly view daily Technical stock chart and over "Weekly" to view weekly Technical stock chart. | |||||

 | HLIO Helios Technologies, Inc. |
| Sector: Industrials | |
| SubSector: Diversified Machinery | |
| MarketCap: 1455.66 Millions | |
| Recent Price: 48.40 Smart Investing & Trading Score: 100 | |
| Day Percent Change: 2.26% Day Change: 1.07 | |
| Week Change: 0.73% Year-to-date Change: 6.7% | |
| HLIO Links: Profile News Message Board | |
| Charts:- Daily , Weekly | |
| Add HLIO to Watchlist: View: Get Complete HLIO Trend Analysis ➞ | |
 | MHO M/I Homes, Inc. |
| Sector: Industrials | |
| SubSector: Residential Construction | |
| MarketCap: 437.106 Millions | |
| Recent Price: 122.88 Smart Investing & Trading Score: 59 | |
| Day Percent Change: -0.86% Day Change: -1.06 | |
| Week Change: 0.7% Year-to-date Change: -10.8% | |
| MHO Links: Profile News Message Board | |
| Charts:- Daily , Weekly | |
| Add MHO to Watchlist: View: Get Complete MHO Trend Analysis ➞ | |
 | FIP FTAI Infrastructure Inc. |
| Sector: Industrials | |
| SubSector: Industrials | |
| MarketCap: 368 Millions | |
| Recent Price: 7.34 Smart Investing & Trading Score: 83 | |
| Day Percent Change: 0.82% Day Change: 0.06 | |
| Week Change: 0.69% Year-to-date Change: 88.7% | |
| FIP Links: Profile News Message Board | |
| Charts:- Daily , Weekly | |
| Add FIP to Watchlist: View: Get Complete FIP Trend Analysis ➞ | |
 | CAE CAE Inc. |
| Sector: Industrials | |
| SubSector: Aerospace/Defense Products & Services | |
| MarketCap: 3739.61 Millions | |
| Recent Price: 20.60 Smart Investing & Trading Score: 95 | |
| Day Percent Change: -0.77% Day Change: -0.16 | |
| Week Change: 0.64% Year-to-date Change: -4.6% | |
| CAE Links: Profile News Message Board | |
| Charts:- Daily , Weekly | |
| Add CAE to Watchlist: View: Get Complete CAE Trend Analysis ➞ | |
 | IEX IDEX Corporation |
| Sector: Industrials | |
| SubSector: Diversified Machinery | |
| MarketCap: 9721.46 Millions | |
| Recent Price: 221.75 Smart Investing & Trading Score: 25 | |
| Day Percent Change: -0.18% Day Change: -0.40 | |
| Week Change: 0.6% Year-to-date Change: 2.1% | |
| IEX Links: Profile News Message Board | |
| Charts:- Daily , Weekly | |
| Add IEX to Watchlist: View: Get Complete IEX Trend Analysis ➞ | |
 | ROP Roper Technologies, Inc. |
| Sector: Industrials | |
| SubSector: Diversified Machinery | |
| MarketCap: 33366.2 Millions | |
| Recent Price: 520.26 Smart Investing & Trading Score: 42 | |
| Day Percent Change: 0.92% Day Change: 4.72 | |
| Week Change: 0.59% Year-to-date Change: -4.6% | |
| ROP Links: Profile News Message Board | |
| Charts:- Daily , Weekly | |
| Add ROP to Watchlist: View: Get Complete ROP Trend Analysis ➞ | |
 | TKR The Timken Company |
| Sector: Industrials | |
| SubSector: Machine Tools & Accessories | |
| MarketCap: 2277.48 Millions | |
| Recent Price: 90.01 Smart Investing & Trading Score: 88 | |
| Day Percent Change: 0.39% Day Change: 0.35 | |
| Week Change: 0.58% Year-to-date Change: 12.3% | |
| TKR Links: Profile News Message Board | |
| Charts:- Daily , Weekly | |
| Add TKR to Watchlist: View: Get Complete TKR Trend Analysis ➞ | |
 | AWI Armstrong World Industries, Inc. |
| Sector: Industrials | |
| SubSector: General Building Materials | |
| MarketCap: 3609.53 Millions | |
| Recent Price: 116.28 Smart Investing & Trading Score: 54 | |
| Day Percent Change: -0.45% Day Change: -0.52 | |
| Week Change: 0.58% Year-to-date Change: 18.3% | |
| AWI Links: Profile News Message Board | |
| Charts:- Daily , Weekly | |
| Add AWI to Watchlist: View: Get Complete AWI Trend Analysis ➞ | |
 | WTTR Select Energy Services, Inc. |
| Sector: Industrials | |
| SubSector: Pollution & Treatment Controls | |
| MarketCap: 347.075 Millions | |
| Recent Price: 9.21 Smart Investing & Trading Score: 68 | |
| Day Percent Change: 0.77% Day Change: 0.07 | |
| Week Change: 0.55% Year-to-date Change: 21.3% | |
| WTTR Links: Profile News Message Board | |
| Charts:- Daily , Weekly | |
| Add WTTR to Watchlist: View: Get Complete WTTR Trend Analysis ➞ | |
 | TREX Trex Company, Inc. |
| Sector: Industrials | |
| SubSector: General Building Materials | |
| MarketCap: 4369.23 Millions | |
| Recent Price: 92.51 Smart Investing & Trading Score: 83 | |
| Day Percent Change: -0.92% Day Change: -0.86 | |
| Week Change: 0.54% Year-to-date Change: 11.7% | |
| TREX Links: Profile News Message Board | |
| Charts:- Daily , Weekly | |
| Add TREX to Watchlist: View: Get Complete TREX Trend Analysis ➞ | |
 | HON Honeywell International Inc. |
| Sector: Industrials | |
| SubSector: Diversified Machinery | |
| MarketCap: 91189.1 Millions | |
| Recent Price: 196.85 Smart Investing & Trading Score: 64 | |
| Day Percent Change: 0.95% Day Change: 1.85 | |
| Week Change: 0.53% Year-to-date Change: -6.1% | |
| HON Links: Profile News Message Board | |
| Charts:- Daily , Weekly | |
| Add HON to Watchlist: View: Get Complete HON Trend Analysis ➞ | |
 | APT Alpha Pro Tech, Ltd. |
| Sector: Industrials | |
| SubSector: General Building Materials | |
| MarketCap: 125.953 Millions | |
| Recent Price: 6.12 Smart Investing & Trading Score: 71 | |
| Day Percent Change: -0.65% Day Change: -0.04 | |
| Week Change: 0.49% Year-to-date Change: 15.7% | |
| APT Links: Profile News Message Board | |
| Charts:- Daily , Weekly | |
| Add APT to Watchlist: View: Get Complete APT Trend Analysis ➞ | |
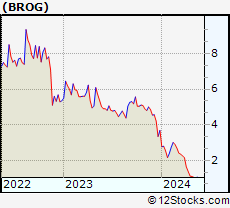 | BROG Brooge Holdings Limited |
| Sector: Industrials | |
| SubSector: Conglomerates | |
| MarketCap: 242.748 Millions | |
| Recent Price: 1.04 Smart Investing & Trading Score: 45 | |
| Day Percent Change: 0.48% Day Change: 0.00 | |
| Week Change: 0.48% Year-to-date Change: -71.6% | |
| BROG Links: Profile News Message Board | |
| Charts:- Daily , Weekly | |
| Add BROG to Watchlist: View: Get Complete BROG Trend Analysis ➞ | |
 | GRC The Gorman-Rupp Company |
| Sector: Industrials | |
| SubSector: Diversified Machinery | |
| MarketCap: 729.616 Millions | |
| Recent Price: 32.85 Smart Investing & Trading Score: 32 | |
| Day Percent Change: 0.18% Day Change: 0.06 | |
| Week Change: 0.43% Year-to-date Change: -7.5% | |
| GRC Links: Profile News Message Board | |
| Charts:- Daily , Weekly | |
| Add GRC to Watchlist: View: Get Complete GRC Trend Analysis ➞ | |
 | LNN Lindsay Corporation |
| Sector: Industrials | |
| SubSector: Farm & Construction Machinery | |
| MarketCap: 1097.57 Millions | |
| Recent Price: 118.78 Smart Investing & Trading Score: 60 | |
| Day Percent Change: 0.06% Day Change: 0.07 | |
| Week Change: 0.41% Year-to-date Change: -8.0% | |
| LNN Links: Profile News Message Board | |
| Charts:- Daily , Weekly | |
| Add LNN to Watchlist: View: Get Complete LNN Trend Analysis ➞ | |
 | HAYN Haynes International, Inc. |
| Sector: Industrials | |
| SubSector: Metal Fabrication | |
| MarketCap: 245.75 Millions | |
| Recent Price: 59.48 Smart Investing & Trading Score: 31 | |
| Day Percent Change: -0.17% Day Change: -0.10 | |
| Week Change: 0.41% Year-to-date Change: 4.3% | |
| HAYN Links: Profile News Message Board | |
| Charts:- Daily , Weekly | |
| Add HAYN to Watchlist: View: Get Complete HAYN Trend Analysis ➞ | |
 | CVCO Cavco Industries, Inc. |
| Sector: Industrials | |
| SubSector: Residential Construction | |
| MarketCap: 1375.86 Millions | |
| Recent Price: 378.60 Smart Investing & Trading Score: 73 | |
| Day Percent Change: -0.77% Day Change: -2.93 | |
| Week Change: 0.34% Year-to-date Change: 9.2% | |
| CVCO Links: Profile News Message Board | |
| Charts:- Daily , Weekly | |
| Add CVCO to Watchlist: View: Get Complete CVCO Trend Analysis ➞ | |
 | PHM PulteGroup, Inc. |
| Sector: Industrials | |
| SubSector: Residential Construction | |
| MarketCap: 6186.46 Millions | |
| Recent Price: 116.95 Smart Investing & Trading Score: 85 | |
| Day Percent Change: -0.59% Day Change: -0.70 | |
| Week Change: 0.27% Year-to-date Change: 13.3% | |
| PHM Links: Profile News Message Board | |
| Charts:- Daily , Weekly | |
| Add PHM to Watchlist: View: Get Complete PHM Trend Analysis ➞ | |
 | PLPC Preformed Line Products Company |
| Sector: Industrials | |
| SubSector: Industrial Electrical Equipment | |
| MarketCap: 221.779 Millions | |
| Recent Price: 127.01 Smart Investing & Trading Score: 57 | |
| Day Percent Change: 1.33% Day Change: 1.67 | |
| Week Change: 0.21% Year-to-date Change: -5.1% | |
| PLPC Links: Profile News Message Board | |
| Charts:- Daily , Weekly | |
| Add PLPC to Watchlist: View: Get Complete PLPC Trend Analysis ➞ | |
 | HRT HireRight Holdings Corporation |
| Sector: Industrials | |
| SubSector: Staffing & Employment Services | |
| MarketCap: 823 Millions | |
| Recent Price: 14.36 Smart Investing & Trading Score: 83 | |
| Day Percent Change: 0.07% Day Change: 0.01 | |
| Week Change: 0.21% Year-to-date Change: 6.8% | |
| HRT Links: Profile News Message Board | |
| Charts:- Daily , Weekly | |
| Add HRT to Watchlist: View: Get Complete HRT Trend Analysis ➞ | |
 | GVA Granite Construction Incorporated |
| Sector: Industrials | |
| SubSector: Heavy Construction | |
| MarketCap: 725.895 Millions | |
| Recent Price: 59.51 Smart Investing & Trading Score: 100 | |
| Day Percent Change: -0.45% Day Change: -0.27 | |
| Week Change: 0.2% Year-to-date Change: 17.0% | |
| GVA Links: Profile News Message Board | |
| Charts:- Daily , Weekly | |
| Add GVA to Watchlist: View: Get Complete GVA Trend Analysis ➞ | |
 | SEB Seaboard Corporation |
| Sector: Industrials | |
| SubSector: Conglomerates | |
| MarketCap: 3161.78 Millions | |
| Recent Price: 3226.13 Smart Investing & Trading Score: 28 | |
| Day Percent Change: 1.11% Day Change: 35.48 | |
| Week Change: 0.19% Year-to-date Change: -9.6% | |
| SEB Links: Profile News Message Board | |
| Charts:- Daily , Weekly | |
| Add SEB to Watchlist: View: Get Complete SEB Trend Analysis ➞ | |
 | ESLT Elbit Systems Ltd. |
| Sector: Industrials | |
| SubSector: Aerospace/Defense Products & Services | |
| MarketCap: 5770.01 Millions | |
| Recent Price: 202.71 Smart Investing & Trading Score: 42 | |
| Day Percent Change: 1.15% Day Change: 2.30 | |
| Week Change: 0.19% Year-to-date Change: -4.9% | |
| ESLT Links: Profile News Message Board | |
| Charts:- Daily , Weekly | |
| Add ESLT to Watchlist: View: Get Complete ESLT Trend Analysis ➞ | |
 | TNC Tennant Company |
| Sector: Industrials | |
| SubSector: Diversified Machinery | |
| MarketCap: 1097.96 Millions | |
| Recent Price: 107.15 Smart Investing & Trading Score: 0 | |
| Day Percent Change: 0.15% Day Change: 0.16 | |
| Week Change: 0.17% Year-to-date Change: 15.6% | |
| TNC Links: Profile News Message Board | |
| Charts:- Daily , Weekly | |
| Add TNC to Watchlist: View: Get Complete TNC Trend Analysis ➞ | |
 | DHR Danaher Corporation |
| Sector: Industrials | |
| SubSector: Diversified Machinery | |
| MarketCap: 93210.3 Millions | |
| Recent Price: 248.76 Smart Investing & Trading Score: 62 | |
| Day Percent Change: 0.55% Day Change: 1.36 | |
| Week Change: 0.15% Year-to-date Change: 7.5% | |
| DHR Links: Profile News Message Board | |
| Charts:- Daily , Weekly | |
| Add DHR to Watchlist: View: Get Complete DHR Trend Analysis ➞ | |
| For tabular summary view of above stock list: Summary View ➞ 0 - 25 , 25 - 50 , 50 - 75 , 75 - 100 , 100 - 125 , 125 - 150 , 150 - 175 , 175 - 200 , 200 - 225 , 225 - 250 , 250 - 275 , 275 - 300 | ||
| Click To Change The Sort Order: By Market Cap or Company Size Performance: Year-to-date, Week and Day | |
| Select Chart Type: | ||
|
Best Stocks Today 12Stocks.com |
© 2024 12Stocks.com Terms & Conditions Privacy Contact Us
All Information Provided Only For Education And Not To Be Used For Investing or Trading. See Terms & Conditions


One More Thing ... Get Best Stocks Delivered Daily!
Never Ever Miss A Move With Our Top Ten Stocks Lists
Find Best Stocks In Any Market - Bull or Bear Market
Take A Peek At Our Top Ten Stocks Lists: Daily, Weekly, Year-to-Date & Top Trends
Find Best Stocks In Any Market - Bull or Bear Market
Take A Peek At Our Top Ten Stocks Lists: Daily, Weekly, Year-to-Date & Top Trends
Industrial Stocks With Best Up Trends [0-bearish to 100-bullish]: Sterling Construction[100], Mueller Water[100], Priority Technology[100], ZIM Integrated[100], Himalaya Shipping[100], United States[100], Belden [100], Darling Ingredients[100], Comfort Systems[100], Caesarstone [100], Helios Technologies[100]
Best Industrial Stocks Year-to-Date:
Intuitive Machines[137.04%], IES [115.8%], Tutor Perini[101.65%], FTAI Infrastructure[88.69%], Powell Industries[78.46%], Caesarstone [76.74%], NuScale Power[75.5%], EMCOR [74.25%], Comfort Systems[67.08%], Aspen Aerogels[66.48%], United States[61.4%] Best Industrial Stocks This Week:
Great Lakes[25.72%], Sterling Construction[20.61%], Symbotic [13.11%], ESS Tech[13.09%], Mueller Water[10.97%], ZIM Integrated[9.89%], Planet Labs[9.59%], Latham [9.52%], United States[9.29%], Comfort Systems[9.08%], Priority Technology[8.46%] Best Industrial Stocks Daily:
Great Lakes[24.29%], Sterling Construction[15.78%], Symbotic [10.87%], Bowman Consulting[9.04%], Mueller Water[8.82%], Priority Technology[6.79%], Satellogic [5.79%], ESS Tech[5.56%], Planet Labs[5.26%], Ranpak [5.16%], ZIM Integrated[4.77%]