
 Login Sign Up


| |||||
 |  | ||||

| 12Stocks.com Market Intelligence |
Best Industrial Stocks
| In a hurry? Industrial Stocks Lists: Performance Trends Table, Stock Charts
Sort Industrial stocks: Daily, Weekly, Year-to-Date, Market Cap & Trends. Filter Industrial stocks list by size:All Industrial Large Mid-Range Small |
| 12Stocks.com Industrial Stocks Performances & Trends Daily | |||||||||
|
|  The overall Smart Investing & Trading Score is 56 (0-bearish to 100-bullish) which puts Industrial sector in short term neutral trend. The Smart Investing & Trading Score from previous trading session is 56 and hence a deterioration of trend.
| ||||||||
Here are the Smart Investing & Trading Scores of the most requested Industrial stocks at 12Stocks.com (click stock name for detailed review):
|


| 12Stocks.com: Investing in Industrial sector with Stocks | |
|
The following table helps investors and traders sort through current performance and trends (as measured by Smart Investing & Trading Score) of various
stocks in the Industrial sector. Quick View: Move mouse or cursor over stock symbol (ticker) to view short-term Technical chart and over stock name to view long term chart. Click on  to add stock symbol to your watchlist and to add stock symbol to your watchlist and  to view watchlist. Click on any ticker or stock name for detailed market intelligence report for that stock. to view watchlist. Click on any ticker or stock name for detailed market intelligence report for that stock. |
12Stocks.com Performance of Stocks in Industrial Sector
| Ticker | Stock Name | Watchlist | Category | Recent Price | Smart Investing & Trading Score | Change % | YTD Change% |
| THR | Thermon |   | Machinery | 31.83 | 49 | 0.76 | -2.27% |
| FTAIN | FTAI Aviation | | Rental & Leasing | 25.10 | 60 | 0.76 | 2.95% |
| MIR | Mirion Technologies | | Specialty Industrial Machinery | 11.09 | 63 | 0.73 | 8.09% |
| HLMN | Hillman | | Tools & Accessories | 9.75 | 63 | 0.72 | 5.46% |
| SXI | Standex | | Equipment | 172.81 | 66 | 0.71 | 9.11% |
| BCC | Boise Cascade | | Lumber, Wood | 139.42 | 58 | 0.69 | 7.78% |
| GE | General Electric | | Machinery | 162.35 | 78 | 0.68 | 27.20% |
| RYI | Ryerson Holding | | Fabrication | 9.45 | 17 | 0.64 | -11.59% |
| CCS | Century Communities | | Residential | 78.82 | 25 | 0.64 | -13.52% |
| WTTR | Select Energy | | Pollution & Treatment Controls | 9.48 | 68 | 0.64 | 24.90% |
| BDC | Belden | | Electrical Equipment | 83.40 | 68 | 0.62 | 7.96% |
| DOV | Dover | | Machinery | 180.17 | 100 | 0.59 | 17.14% |
| EML | Eastern | | Small Tools & Accessories | 32.31 | 83 | 0.59 | 46.86% |
| PL | Planet Labs | | Aerospace & Defense | 1.77 | 15 | 0.57 | -28.63% |
| PSN | Parsons | | Machinery | 79.73 | 48 | 0.57 | 27.14% |
| WWD | Woodward | | Aerospace/Defense | 150.58 | 70 | 0.56 | 10.61% |
| CSWI | CSW s | | Machinery | 239.00 | 78 | 0.54 | 15.23% |
| RGR | Sturm Ruger | | Aerospace/Defense | 46.47 | 70 | 0.52 | 2.24% |
| OSIS | OSI Systems | | Electrical Equipment | 134.82 | 63 | 0.50 | 4.47% |
| HOLI | Hollysys Automation | | Electrical Equipment | 24.55 | 38 | 0.49 | -6.83% |
| AOS | A. O. | | Electrical Equipment | 83.21 | 33 | 0.47 | 0.93% |
| MMM | 3M | | Machinery | 91.83 | 39 | 0.46 | -16.00% |
| NX | Quanex Building | | Building Materials | 33.81 | 43 | 0.45 | 10.60% |
| YGMZ | MingZhu Logistics | | Trucking | 0.43 | 47 | 0.45 | -9.86% |
| SKYH | Sky Harbour | | Aerospace & Defense | 8.97 | 32 | 0.45 | -7.86% |
| For chart view version of above stock list: Chart View ➞ 0 - 25 , 25 - 50 , 50 - 75 , 75 - 100 , 100 - 125 , 125 - 150 , 150 - 175 , 175 - 200 , 200 - 225 , 225 - 250 , 250 - 275 , 275 - 300 | ||
 | Click To Change The Sort Order: By Market Cap or Company Size Performance: Year-to-date, Week and Day |  |
|
Get the most comprehensive stock market coverage daily at 12Stocks.com ➞ Best Stocks Today ➞ Best Stocks Weekly ➞ Best Stocks Year-to-Date ➞ Best Stocks Trends ➞  Best Stocks Today 12Stocks.com Best Nasdaq Stocks ➞ Best S&P 500 Stocks ➞ Best Tech Stocks ➞ Best Biotech Stocks ➞ |
| Detailed Overview of Industrial Stocks |
| Industrial Technical Overview, Leaders & Laggards, Top Industrial ETF Funds & Detailed Industrial Stocks List, Charts, Trends & More |
| Industrial Sector: Technical Analysis, Trends & YTD Performance | |
| Industrial sector is composed of stocks
from industrial machinery, aerospace, defense, farm/construction
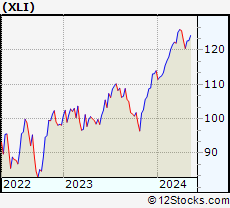
and industrial services subsectors. Industrial sector, as represented by XLI, an exchange-traded fund [ETF] that holds basket of Industrial stocks (e.g, Caterpillar, Boeing) is up by 7.61% and is currently outperforming the overall market by 1.47% year-to-date. Below is a quick view of Technical charts and trends: |
|
 XLI Weekly Chart |
|
| Long Term Trend: Very Good | |
| Medium Term Trend: Not Good | |
 XLI Daily Chart |
|
| Short Term Trend: Deteriorating | |
| Overall Trend Score: 56 | |
| YTD Performance: 7.61% | |
| **Trend Scores & Views Are Only For Educational Purposes And Not For Investing | |
| 12Stocks.com: Top Performing Industrial Sector Stocks | ||||||||||||||||||||||||||||||||||||||||||||||||
 The top performing Industrial sector stocks year to date are
Now, more recently, over last week, the top performing Industrial sector stocks on the move are


|
||||||||||||||||||||||||||||||||||||||||||||||||
| 12Stocks.com: Investing in Industrial Sector using Exchange Traded Funds | |
|
The following table shows list of key exchange traded funds (ETF) that
help investors track Industrial Index. For detailed view, check out our ETF Funds section of our website. Quick View: Move mouse or cursor over ETF symbol (ticker) to view short-term Technical chart and over ETF name to view long term chart. Click on ticker or stock name for detailed view. Click on to add stock symbol to your watchlist and to view watchlist. |
12Stocks.com List of ETFs that track Industrial Index
| Ticker | ETF Name | Watchlist | Recent Price | Smart Investing & Trading Score | Change % | Week % | Year-to-date % |
| XLI | Industrial | | 122.66 | 56 | 0.16 | 1.82 | 7.61% |
| UXI | Industrials | | 32.73 | 61 | 3.54 | 3.74 | 13.67% |
| PPA | Aerospace & Defense | | 100.91 | 83 | 0.56 | 2.64 | 9.49% |
| ITA | Aerospace & Defense | | 129.53 | 63 | 0.40 | 1.2 | 2.31% |
| ITB | Home Construction | | 105.65 | 51 | 1.19 | 3.21 | 3.85% |
| XHB | Homebuilders | | 103.72 | 51 | 1.22 | 3.55 | 8.43% |
| SIJ | Short Industrials | | 9.82 | 32 | -1.01 | -4.04 | -13.4% |
| IYJ | Industrials | | 121.56 | 48 | 0.21 | 1.8 | 6.3% |
| EXI | Global Industrials | | 136.09 | 48 | 0.93 | 2.3 | 6.79% |
| VIS | Industrials | | 236.50 | 63 | 0.12 | 1.85 | 7.29% |
| PSCI | SmallCap Industrials | | 121.36 | 63 | 0.25 | 2.12 | 4.66% |
| XAR | Aerospace & Defense | | 136.11 | 65 | 1.12 | 2.93 | 0.51% |
| ARKQ | ARK Industrial Innovation | | 53.36 | 24 | 2.52 | 7.02 | -7.52% |
| 12Stocks.com: Charts, Trends, Fundamental Data and Performances of Industrial Stocks | |
|
We now take in-depth look at all Industrial stocks including charts, multi-period performances and overall trends (as measured by Smart Investing & Trading Score). One can sort Industrial stocks (click link to choose) by Daily, Weekly and by Year-to-Date performances. Also, one can sort by size of the company or by market capitalization. |
| Select Your Default Chart Type: | |||||
| |||||
| Click on stock symbol or name for detailed view. Click on to add stock symbol to your watchlist and to view watchlist. Quick View: Move mouse or cursor over "Daily" to quickly view daily Technical stock chart and over "Weekly" to view weekly Technical stock chart. | |||||

 | THR Thermon Group Holdings, Inc. |
| Sector: Industrials | |
| SubSector: Diversified Machinery | |
| MarketCap: 492.816 Millions | |
| Recent Price: 31.83 Smart Investing & Trading Score: 49 | |
| Day Percent Change: 0.76% Day Change: 0.24 | |
| Week Change: 7.03% Year-to-date Change: -2.3% | |
| THR Links: Profile News Message Board | |
| Charts:- Daily , Weekly | |
| Add THR to Watchlist: View: Get Complete THR Trend Analysis ➞ | |
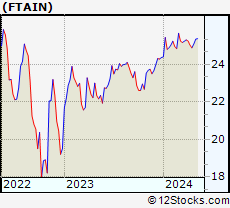 | FTAIN FTAI Aviation Ltd. |
| Sector: Industrials | |
| SubSector: Rental & Leasing Services | |
| MarketCap: 3160 Millions | |
| Recent Price: 25.10 Smart Investing & Trading Score: 60 | |
| Day Percent Change: 0.76% Day Change: 0.19 | |
| Week Change: 0.83% Year-to-date Change: 3.0% | |
| FTAIN Links: Profile News Message Board | |
| Charts:- Daily , Weekly | |
| Add FTAIN to Watchlist: View: Get Complete FTAIN Trend Analysis ➞ | |
 | MIR Mirion Technologies, Inc. |
| Sector: Industrials | |
| SubSector: Specialty Industrial Machinery | |
| MarketCap: 1920 Millions | |
| Recent Price: 11.09 Smart Investing & Trading Score: 63 | |
| Day Percent Change: 0.73% Day Change: 0.08 | |
| Week Change: 1% Year-to-date Change: 8.1% | |
| MIR Links: Profile News Message Board | |
| Charts:- Daily , Weekly | |
| Add MIR to Watchlist: View: Get Complete MIR Trend Analysis ➞ | |
 | HLMN Hillman Solutions Corp. |
| Sector: Industrials | |
| SubSector: Tools & Accessories | |
| MarketCap: 1720 Millions | |
| Recent Price: 9.75 Smart Investing & Trading Score: 63 | |
| Day Percent Change: 0.72% Day Change: 0.07 | |
| Week Change: 4.17% Year-to-date Change: 5.5% | |
| HLMN Links: Profile News Message Board | |
| Charts:- Daily , Weekly | |
| Add HLMN to Watchlist: View: Get Complete HLMN Trend Analysis ➞ | |
 | SXI Standex International Corporation |
| Sector: Industrials | |
| SubSector: Industrial Equipment & Components | |
| MarketCap: 644.109 Millions | |
| Recent Price: 172.81 Smart Investing & Trading Score: 66 | |
| Day Percent Change: 0.71% Day Change: 1.21 | |
| Week Change: 3.15% Year-to-date Change: 9.1% | |
| SXI Links: Profile News Message Board | |
| Charts:- Daily , Weekly | |
| Add SXI to Watchlist: View: Get Complete SXI Trend Analysis ➞ | |
 | BCC Boise Cascade Company |
| Sector: Industrials | |
| SubSector: Lumber, Wood Production | |
| MarketCap: 963.938 Millions | |
| Recent Price: 139.42 Smart Investing & Trading Score: 58 | |
| Day Percent Change: 0.69% Day Change: 0.96 | |
| Week Change: 4.36% Year-to-date Change: 7.8% | |
| BCC Links: Profile News Message Board | |
| Charts:- Daily , Weekly | |
| Add BCC to Watchlist: View: Get Complete BCC Trend Analysis ➞ | |
 | GE General Electric Company |
| Sector: Industrials | |
| SubSector: Diversified Machinery | |
| MarketCap: 64710.6 Millions | |
| Recent Price: 162.35 Smart Investing & Trading Score: 78 | |
| Day Percent Change: 0.68% Day Change: 1.09 | |
| Week Change: 9.65% Year-to-date Change: 27.2% | |
| GE Links: Profile News Message Board | |
| Charts:- Daily , Weekly | |
| Add GE to Watchlist: View: Get Complete GE Trend Analysis ➞ | |
 | RYI Ryerson Holding Corporation |
| Sector: Industrials | |
| SubSector: Metal Fabrication | |
| MarketCap: 202.55 Millions | |
| Recent Price: 9.45 Smart Investing & Trading Score: 17 | |
| Day Percent Change: 0.64% Day Change: 0.06 | |
| Week Change: -4.19% Year-to-date Change: -11.6% | |
| RYI Links: Profile News Message Board | |
| Charts:- Daily , Weekly | |
| Add RYI to Watchlist: View: Get Complete RYI Trend Analysis ➞ | |
 | CCS Century Communities, Inc. |
| Sector: Industrials | |
| SubSector: Residential Construction | |
| MarketCap: 459.206 Millions | |
| Recent Price: 78.82 Smart Investing & Trading Score: 25 | |
| Day Percent Change: 0.64% Day Change: 0.50 | |
| Week Change: -0.27% Year-to-date Change: -13.5% | |
| CCS Links: Profile News Message Board | |
| Charts:- Daily , Weekly | |
| Add CCS to Watchlist: View: Get Complete CCS Trend Analysis ➞ | |
 | WTTR Select Energy Services, Inc. |
| Sector: Industrials | |
| SubSector: Pollution & Treatment Controls | |
| MarketCap: 347.075 Millions | |
| Recent Price: 9.48 Smart Investing & Trading Score: 68 | |
| Day Percent Change: 0.64% Day Change: 0.06 | |
| Week Change: 1.5% Year-to-date Change: 24.9% | |
| WTTR Links: Profile News Message Board | |
| Charts:- Daily , Weekly | |
| Add WTTR to Watchlist: View: Get Complete WTTR Trend Analysis ➞ | |
 | BDC Belden Inc. |
| Sector: Industrials | |
| SubSector: Industrial Electrical Equipment | |
| MarketCap: 1490.59 Millions | |
| Recent Price: 83.40 Smart Investing & Trading Score: 68 | |
| Day Percent Change: 0.62% Day Change: 0.51 | |
| Week Change: 1.81% Year-to-date Change: 8.0% | |
| BDC Links: Profile News Message Board | |
| Charts:- Daily , Weekly | |
| Add BDC to Watchlist: View: Get Complete BDC Trend Analysis ➞ | |
 | DOV Dover Corporation |
| Sector: Industrials | |
| SubSector: Diversified Machinery | |
| MarketCap: 10725.6 Millions | |
| Recent Price: 180.17 Smart Investing & Trading Score: 100 | |
| Day Percent Change: 0.59% Day Change: 1.06 | |
| Week Change: 6.08% Year-to-date Change: 17.1% | |
| DOV Links: Profile News Message Board | |
| Charts:- Daily , Weekly | |
| Add DOV to Watchlist: View: Get Complete DOV Trend Analysis ➞ | |
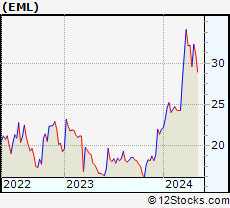 | EML The Eastern Company |
| Sector: Industrials | |
| SubSector: Small Tools & Accessories | |
| MarketCap: 140.356 Millions | |
| Recent Price: 32.31 Smart Investing & Trading Score: 83 | |
| Day Percent Change: 0.59% Day Change: 0.19 | |
| Week Change: 9.16% Year-to-date Change: 46.9% | |
| EML Links: Profile News Message Board | |
| Charts:- Daily , Weekly | |
| Add EML to Watchlist: View: Get Complete EML Trend Analysis ➞ | |
 | PL Planet Labs PBC |
| Sector: Industrials | |
| SubSector: Aerospace & Defense | |
| MarketCap: 874 Millions | |
| Recent Price: 1.77 Smart Investing & Trading Score: 15 | |
| Day Percent Change: 0.57% Day Change: 0.01 | |
| Week Change: 1.14% Year-to-date Change: -28.6% | |
| PL Links: Profile News Message Board | |
| Charts:- Daily , Weekly | |
| Add PL to Watchlist: View: Get Complete PL Trend Analysis ➞ | |
 | PSN Parsons Corporation |
| Sector: Industrials | |
| SubSector: Diversified Machinery | |
| MarketCap: 3021.16 Millions | |
| Recent Price: 79.73 Smart Investing & Trading Score: 48 | |
| Day Percent Change: 0.57% Day Change: 0.45 | |
| Week Change: 2.89% Year-to-date Change: 27.1% | |
| PSN Links: Profile News Message Board | |
| Charts:- Daily , Weekly | |
| Add PSN to Watchlist: View: Get Complete PSN Trend Analysis ➞ | |
 | WWD Woodward, Inc. |
| Sector: Industrials | |
| SubSector: Aerospace/Defense Products & Services | |
| MarketCap: 3764.01 Millions | |
| Recent Price: 150.58 Smart Investing & Trading Score: 70 | |
| Day Percent Change: 0.56% Day Change: 0.84 | |
| Week Change: 2.1% Year-to-date Change: 10.6% | |
| WWD Links: Profile News Message Board | |
| Charts:- Daily , Weekly | |
| Add WWD to Watchlist: View: Get Complete WWD Trend Analysis ➞ | |
 | CSWI CSW Industrials, Inc. |
| Sector: Industrials | |
| SubSector: Diversified Machinery | |
| MarketCap: 985.616 Millions | |
| Recent Price: 239.00 Smart Investing & Trading Score: 78 | |
| Day Percent Change: 0.54% Day Change: 1.28 | |
| Week Change: 3.07% Year-to-date Change: 15.2% | |
| CSWI Links: Profile News Message Board | |
| Charts:- Daily , Weekly | |
| Add CSWI to Watchlist: View: Get Complete CSWI Trend Analysis ➞ | |
 | RGR Sturm, Ruger & Company, Inc. |
| Sector: Industrials | |
| SubSector: Aerospace/Defense Products & Services | |
| MarketCap: 752 Millions | |
| Recent Price: 46.47 Smart Investing & Trading Score: 70 | |
| Day Percent Change: 0.52% Day Change: 0.24 | |
| Week Change: -0.6% Year-to-date Change: 2.2% | |
| RGR Links: Profile News Message Board | |
| Charts:- Daily , Weekly | |
| Add RGR to Watchlist: View: Get Complete RGR Trend Analysis ➞ | |
 | OSIS OSI Systems, Inc. |
| Sector: Industrials | |
| SubSector: Industrial Electrical Equipment | |
| MarketCap: 1100.39 Millions | |
| Recent Price: 134.82 Smart Investing & Trading Score: 63 | |
| Day Percent Change: 0.50% Day Change: 0.67 | |
| Week Change: -0.53% Year-to-date Change: 4.5% | |
| OSIS Links: Profile News Message Board | |
| Charts:- Daily , Weekly | |
| Add OSIS to Watchlist: View: Get Complete OSIS Trend Analysis ➞ | |
 | HOLI Hollysys Automation Technologies Ltd. |
| Sector: Industrials | |
| SubSector: Industrial Electrical Equipment | |
| MarketCap: 668.379 Millions | |
| Recent Price: 24.55 Smart Investing & Trading Score: 38 | |
| Day Percent Change: 0.49% Day Change: 0.12 | |
| Week Change: 0% Year-to-date Change: -6.8% | |
| HOLI Links: Profile News Message Board | |
| Charts:- Daily , Weekly | |
| Add HOLI to Watchlist: View: Get Complete HOLI Trend Analysis ➞ | |
 | AOS A. O. Smith Corporation |
| Sector: Industrials | |
| SubSector: Industrial Electrical Equipment | |
| MarketCap: 5809.89 Millions | |
| Recent Price: 83.21 Smart Investing & Trading Score: 33 | |
| Day Percent Change: 0.47% Day Change: 0.39 | |
| Week Change: -3.32% Year-to-date Change: 0.9% | |
| AOS Links: Profile News Message Board | |
| Charts:- Daily , Weekly | |
| Add AOS to Watchlist: View: Get Complete AOS Trend Analysis ➞ | |
 | MMM 3M Company |
| Sector: Industrials | |
| SubSector: Diversified Machinery | |
| MarketCap: 79237.7 Millions | |
| Recent Price: 91.83 Smart Investing & Trading Score: 39 | |
| Day Percent Change: 0.46% Day Change: 0.42 | |
| Week Change: -0.48% Year-to-date Change: -16.0% | |
| MMM Links: Profile News Message Board | |
| Charts:- Daily , Weekly | |
| Add MMM to Watchlist: View: Get Complete MMM Trend Analysis ➞ | |
 | NX Quanex Building Products Corporation |
| Sector: Industrials | |
| SubSector: General Building Materials | |
| MarketCap: 315.453 Millions | |
| Recent Price: 33.81 Smart Investing & Trading Score: 43 | |
| Day Percent Change: 0.45% Day Change: 0.15 | |
| Week Change: -2.4% Year-to-date Change: 10.6% | |
| NX Links: Profile News Message Board | |
| Charts:- Daily , Weekly | |
| Add NX to Watchlist: View: Get Complete NX Trend Analysis ➞ | |
 | YGMZ MingZhu Logistics Holdings Limited |
| Sector: Industrials | |
| SubSector: Trucking | |
| MarketCap: 41627 Millions | |
| Recent Price: 0.43 Smart Investing & Trading Score: 47 | |
| Day Percent Change: 0.45% Day Change: 0.00 | |
| Week Change: -9.36% Year-to-date Change: -9.9% | |
| YGMZ Links: Profile News Message Board | |
| Charts:- Daily , Weekly | |
| Add YGMZ to Watchlist: View: Get Complete YGMZ Trend Analysis ➞ | |
 | SKYH Sky Harbour Group Corporation |
| Sector: Industrials | |
| SubSector: Aerospace & Defense | |
| MarketCap: 271 Millions | |
| Recent Price: 8.97 Smart Investing & Trading Score: 32 | |
| Day Percent Change: 0.45% Day Change: 0.04 | |
| Week Change: 1.82% Year-to-date Change: -7.9% | |
| SKYH Links: Profile News Message Board | |
| Charts:- Daily , Weekly | |
| Add SKYH to Watchlist: View: Get Complete SKYH Trend Analysis ➞ | |
| For tabular summary view of above stock list: Summary View ➞ 0 - 25 , 25 - 50 , 50 - 75 , 75 - 100 , 100 - 125 , 125 - 150 , 150 - 175 , 175 - 200 , 200 - 225 , 225 - 250 , 250 - 275 , 275 - 300 | ||
| Click To Change The Sort Order: By Market Cap or Company Size Performance: Year-to-date, Week and Day | |
| Select Chart Type: | ||
|
Best Stocks Today 12Stocks.com |
© 2024 12Stocks.com Terms & Conditions Privacy Contact Us
All Information Provided Only For Education And Not To Be Used For Investing or Trading. See Terms & Conditions


One More Thing ... Get Best Stocks Delivered Daily!
Never Ever Miss A Move With Our Top Ten Stocks Lists
Find Best Stocks In Any Market - Bull or Bear Market
Take A Peek At Our Top Ten Stocks Lists: Daily, Weekly, Year-to-Date & Top Trends
Find Best Stocks In Any Market - Bull or Bear Market
Take A Peek At Our Top Ten Stocks Lists: Daily, Weekly, Year-to-Date & Top Trends
Industrial Stocks With Best Up Trends [0-bearish to 100-bullish]: Carrier Global[100], Carpenter Technology[100], Kanzhun [100], AeroVironment [100], AAR [100], Generac [100], Dover [100], Crane Co[100], HEICO [100], Powell Industries[95], NET Power[95]
Best Industrial Stocks Year-to-Date:
Intuitive Machines[124.28%], Tutor Perini[95.38%], FTAI Infrastructure[87.92%], NuScale Power[87.91%], Powell Industries[68.35%], Caesarstone [65.51%], IES [65.5%], EMCOR [64.33%], Masonite [55.46%], ADS-TEC Energy[52.73%], Graham [49.5%] Best Industrial Stocks This Week:
Tutor Perini[33.89%], ZIM Integrated[29.99%], NuScale Power[24.95%], BiomX [22.72%], Joby Aviation[17.84%], JELD-WEN Holding[17%], Freightos [14.8%], Powell Industries[14.18%], IES [13.51%], Kanzhun [12.67%], Meritage Homes[12.66%] Best Industrial Stocks Daily:
Tutor Perini[28.01%], TPI Composites[16.32%], ZIM Integrated[16.07%], Eos Energy[13.32%], Enovix [10.79%], Freightos [9.13%], Amprius Technologies[8.07%], Himalaya Shipping[7.52%], LanzaTech Global[7.49%], Shengfeng Development[7.14%], Eve Holding[6.99%]