
 Login Sign Up


| |||||
 |  | ||||

| 12Stocks.com Market Intelligence |
Best Industrial Stocks
| In a hurry? Industrial Stocks Lists: Performance Trends Table, Stock Charts
Sort Industrial stocks: Daily, Weekly, Year-to-Date, Market Cap & Trends. Filter Industrial stocks list by size:All Industrial Large Mid-Range Small |
| 12Stocks.com Industrial Stocks Performances & Trends Daily | |||||||||
|
|  The overall Smart Investing & Trading Score is 56 (0-bearish to 100-bullish) which puts Industrial sector in short term neutral trend. The Smart Investing & Trading Score from previous trading session is 63 and a deterioration of trend continues.
| ||||||||
Here are the Smart Investing & Trading Scores of the most requested Industrial stocks at 12Stocks.com (click stock name for detailed review):
|


| 12Stocks.com: Investing in Industrial sector with Stocks | |
|
The following table helps investors and traders sort through current performance and trends (as measured by Smart Investing & Trading Score) of various
stocks in the Industrial sector. Quick View: Move mouse or cursor over stock symbol (ticker) to view short-term Technical chart and over stock name to view long term chart. Click on  to add stock symbol to your watchlist and to add stock symbol to your watchlist and  to view watchlist. Click on any ticker or stock name for detailed market intelligence report for that stock. to view watchlist. Click on any ticker or stock name for detailed market intelligence report for that stock. |
12Stocks.com Performance of Stocks in Industrial Sector
| Ticker | Stock Name | Watchlist | Category | Recent Price | Smart Investing & Trading Score | Change % | YTD Change% |
| JELD | JELD-WEN Holding |   | Building Materials | 20.97 | 55 | 11.54 | 11.07% |
| BROG | Brooge | | Conglomerates | 1.14 | 20 | 9.13 | -69.16% |
| SFWL | Shengfeng Development | | Integrated Freight & Logistics | 1.54 | 17 | 7.69 | -44.00% |
| CARR | Carrier Global | | Building Products & Equipment | 58.71 | 95 | 7.19 | 2.19% |
| MTH | Meritage Homes | | Residential | 165.07 | 39 | 6.71 | -5.24% |
| JOBY | Joby Aviation | | Airports & Air | 5.10 | 49 | 6.14 | -23.19% |
| SMR | NuScale Power | | Specialty Industrial Machinery | 5.89 | 75 | 6.13 | 82.64% |
| DAR | Darling Ingredients | | Waste Mgmt | 45.26 | 62 | 4.94 | -9.19% |
| DOV | Dover | | Machinery | 179.11 | 100 | 4.47 | 16.45% |
| EH | EHang | | Aerospace/Defense | 18.20 | 68 | 4.12 | 8.33% |
| BZ | Kanzhun | | Staffing & Employment | 19.60 | 100 | 3.29 | 18.61% |
| CMPO | CompoSecure | | Fabrication | 6.69 | 68 | 3.16 | 22.30% |
| EVTL | Vertical Aerospace | | Aerospace & Defense | 0.77 | 61 | 3.14 | 12.98% |
| EME | EMCOR | | Contractors | 349.35 | 75 | 3.09 | 62.16% |
| NOC | Northrop Grumman | | Aerospace/Defense | 488.06 | 100 | 2.84 | 4.26% |
| APT | Alpha Pro | | Building Materials | 6.14 | 36 | 2.68 | 16.07% |
| PCT | PureCycle Technologies | | Pollution & Treatment Controls | 5.05 | 53 | 2.33 | 24.54% |
| ERJ | Embraer S.A | | Aerospace/Defense | 25.00 | 68 | 2.21 | 35.50% |
| LOMA | Loma Negra | | Building Materials | 7.17 | 73 | 2.14 | 1.13% |
| RXO | RXO | | Trucking | 19.82 | 25 | 2.09 | -15.19% |
| FA | First Advantage | | Specialty | 16.47 | 82 | 1.92 | -1.26% |
| TPH | TRI Pointe | | Residential | 36.82 | 63 | 1.80 | 4.01% |
| THR | Thermon | | Machinery | 31.59 | 42 | 1.77 | -3.01% |
| AMBI | Ambipar Emergency | | Waste Mgmt | 4.19 | 17 | 1.70 | -46.69% |
| CRS | Carpenter Technology | | Fabrication | 81.75 | 100 | 1.68 | 15.47% |
| For chart view version of above stock list: Chart View ➞ 0 - 25 , 25 - 50 , 50 - 75 , 75 - 100 , 100 - 125 , 125 - 150 , 150 - 175 , 175 - 200 , 200 - 225 , 225 - 250 , 250 - 275 , 275 - 300 | ||
 | Click To Change The Sort Order: By Market Cap or Company Size Performance: Year-to-date, Week and Day |  |
|
Get the most comprehensive stock market coverage daily at 12Stocks.com ➞ Best Stocks Today ➞ Best Stocks Weekly ➞ Best Stocks Year-to-Date ➞ Best Stocks Trends ➞  Best Stocks Today 12Stocks.com Best Nasdaq Stocks ➞ Best S&P 500 Stocks ➞ Best Tech Stocks ➞ Best Biotech Stocks ➞ |
| Detailed Overview of Industrial Stocks |
| Industrial Technical Overview, Leaders & Laggards, Top Industrial ETF Funds & Detailed Industrial Stocks List, Charts, Trends & More |
| Industrial Sector: Technical Analysis, Trends & YTD Performance | |
| Industrial sector is composed of stocks
from industrial machinery, aerospace, defense, farm/construction
and industrial services subsectors. Industrial sector, as represented by XLI, an exchange-traded fund [ETF] that holds basket of Industrial stocks (e.g, Caterpillar, Boeing) is up by 7.43% and is currently outperforming the overall market by 2.27% year-to-date. Below is a quick view of Technical charts and trends: |
|
 XLI Weekly Chart |
|
| Long Term Trend: Very Good | |
| Medium Term Trend: Not Good | |
 XLI Daily Chart |
|
| Short Term Trend: Very Good | |
| Overall Trend Score: 56 | |
| YTD Performance: 7.43% | |
| **Trend Scores & Views Are Only For Educational Purposes And Not For Investing | |
| 12Stocks.com: Top Performing Industrial Sector Stocks | ||||||||||||||||||||||||||||||||||||||||||||||||
 The top performing Industrial sector stocks year to date are
Now, more recently, over last week, the top performing Industrial sector stocks on the move are


|
||||||||||||||||||||||||||||||||||||||||||||||||
| 12Stocks.com: Investing in Industrial Sector using Exchange Traded Funds | |
|
The following table shows list of key exchange traded funds (ETF) that
help investors track Industrial Index. For detailed view, check out our ETF Funds section of our website. Quick View: Move mouse or cursor over ETF symbol (ticker) to view short-term Technical chart and over ETF name to view long term chart. Click on ticker or stock name for detailed view. Click on to add stock symbol to your watchlist and to view watchlist. |
12Stocks.com List of ETFs that track Industrial Index
| Ticker | ETF Name | Watchlist | Recent Price | Smart Investing & Trading Score | Change % | Week % | Year-to-date % |
| XLI | Industrial | | 122.46 | 56 | 0.30 | 1.65 | 7.43% |
| UXI | Industrials | | 31.61 | 41 | -1.22 | 0.19 | 9.78% |
| PPA | Aerospace & Defense | | 100.35 | 63 | 0.57 | 2.08 | 8.89% |
| ITA | Aerospace & Defense | | 129.01 | 56 | 0.39 | 0.79 | 1.9% |
| ITB | Home Construction | | 104.41 | 51 | -0.32 | 2 | 2.63% |
| XHB | Homebuilders | | 102.47 | 51 | -0.16 | 2.31 | 7.12% |
| SIJ | Short Industrials | | 9.92 | 39 | -0.40 | -3.06 | -12.52% |
| IYJ | Industrials | | 121.30 | 41 | 0.06 | 1.58 | 6.07% |
| EXI | Global Industrials | | 134.82 | 41 | -0.32 | 1.36 | 5.8% |
| VIS | Industrials | | 236.22 | 56 | 0.29 | 1.73 | 7.16% |
| PSCI | SmallCap Industrials | | 121.06 | 56 | -0.19 | 1.87 | 4.4% |
| XAR | Aerospace & Defense | | 134.60 | 58 | -0.03 | 1.79 | -0.61% |
| ARKQ | ARK Industrial Innovation | | 52.05 | 10 | 0.68 | 4.39 | -9.79% |
| 12Stocks.com: Charts, Trends, Fundamental Data and Performances of Industrial Stocks | |
|
We now take in-depth look at all Industrial stocks including charts, multi-period performances and overall trends (as measured by Smart Investing & Trading Score). One can sort Industrial stocks (click link to choose) by Daily, Weekly and by Year-to-Date performances. Also, one can sort by size of the company or by market capitalization. |
| Select Your Default Chart Type: | |||||
| |||||
| Click on stock symbol or name for detailed view. Click on to add stock symbol to your watchlist and to view watchlist. Quick View: Move mouse or cursor over "Daily" to quickly view daily Technical stock chart and over "Weekly" to view weekly Technical stock chart. | |||||

 | JELD JELD-WEN Holding, Inc. |
| Sector: Industrials | |
| SubSector: General Building Materials | |
| MarketCap: 1022.53 Millions | |
| Recent Price: 20.97 Smart Investing & Trading Score: 55 | |
| Day Percent Change: 11.54% Day Change: 2.17 | |
| Week Change: 14.65% Year-to-date Change: 11.1% | |
| JELD Links: Profile News Message Board | |
| Charts:- Daily , Weekly | |
| Add JELD to Watchlist: View: Get Complete JELD Trend Analysis ➞ | |
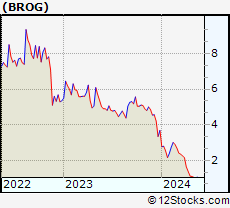 | BROG Brooge Holdings Limited |
| Sector: Industrials | |
| SubSector: Conglomerates | |
| MarketCap: 242.748 Millions | |
| Recent Price: 1.14 Smart Investing & Trading Score: 20 | |
| Day Percent Change: 9.13% Day Change: 0.09 | |
| Week Change: 2.25% Year-to-date Change: -69.2% | |
| BROG Links: Profile News Message Board | |
| Charts:- Daily , Weekly | |
| Add BROG to Watchlist: View: Get Complete BROG Trend Analysis ➞ | |
 | SFWL Shengfeng Development Limited |
| Sector: Industrials | |
| SubSector: Integrated Freight & Logistics | |
| MarketCap: 747 Millions | |
| Recent Price: 1.54 Smart Investing & Trading Score: 17 | |
| Day Percent Change: 7.69% Day Change: 0.11 | |
| Week Change: -5.52% Year-to-date Change: -44.0% | |
| SFWL Links: Profile News Message Board | |
| Charts:- Daily , Weekly | |
| Add SFWL to Watchlist: View: Get Complete SFWL Trend Analysis ➞ | |
 | CARR Carrier Global Corporation |
| Sector: Industrials | |
| SubSector: Building Products & Equipment | |
| MarketCap: 32547 Millions | |
| Recent Price: 58.71 Smart Investing & Trading Score: 95 | |
| Day Percent Change: 7.19% Day Change: 3.94 | |
| Week Change: 8.72% Year-to-date Change: 2.2% | |
| CARR Links: Profile News Message Board | |
| Charts:- Daily , Weekly | |
| Add CARR to Watchlist: View: Get Complete CARR Trend Analysis ➞ | |
 | MTH Meritage Homes Corporation |
| Sector: Industrials | |
| SubSector: Residential Construction | |
| MarketCap: 1440.36 Millions | |
| Recent Price: 165.07 Smart Investing & Trading Score: 39 | |
| Day Percent Change: 6.71% Day Change: 10.38 | |
| Week Change: 9.73% Year-to-date Change: -5.2% | |
| MTH Links: Profile News Message Board | |
| Charts:- Daily , Weekly | |
| Add MTH to Watchlist: View: Get Complete MTH Trend Analysis ➞ | |
 | JOBY Joby Aviation, Inc. |
| Sector: Industrials | |
| SubSector: Airports & Air Services | |
| MarketCap: 5810 Millions | |
| Recent Price: 5.10 Smart Investing & Trading Score: 49 | |
| Day Percent Change: 6.14% Day Change: 0.29 | |
| Week Change: 12.33% Year-to-date Change: -23.2% | |
| JOBY Links: Profile News Message Board | |
| Charts:- Daily , Weekly | |
| Add JOBY to Watchlist: View: Get Complete JOBY Trend Analysis ➞ | |
 | SMR NuScale Power Corporation |
| Sector: Industrials | |
| SubSector: Specialty Industrial Machinery | |
| MarketCap: 1510 Millions | |
| Recent Price: 5.89 Smart Investing & Trading Score: 75 | |
| Day Percent Change: 6.13% Day Change: 0.34 | |
| Week Change: 21.44% Year-to-date Change: 82.6% | |
| SMR Links: Profile News Message Board | |
| Charts:- Daily , Weekly | |
| Add SMR to Watchlist: View: Get Complete SMR Trend Analysis ➞ | |
 | DAR Darling Ingredients Inc. |
| Sector: Industrials | |
| SubSector: Waste Management | |
| MarketCap: 3075.28 Millions | |
| Recent Price: 45.26 Smart Investing & Trading Score: 62 | |
| Day Percent Change: 4.94% Day Change: 2.13 | |
| Week Change: 6.22% Year-to-date Change: -9.2% | |
| DAR Links: Profile News Message Board | |
| Charts:- Daily , Weekly | |
| Add DAR to Watchlist: View: Get Complete DAR Trend Analysis ➞ | |
 | DOV Dover Corporation |
| Sector: Industrials | |
| SubSector: Diversified Machinery | |
| MarketCap: 10725.6 Millions | |
| Recent Price: 179.11 Smart Investing & Trading Score: 100 | |
| Day Percent Change: 4.47% Day Change: 7.67 | |
| Week Change: 5.46% Year-to-date Change: 16.5% | |
| DOV Links: Profile News Message Board | |
| Charts:- Daily , Weekly | |
| Add DOV to Watchlist: View: Get Complete DOV Trend Analysis ➞ | |
 | EH EHang Holdings Limited |
| Sector: Industrials | |
| SubSector: Aerospace/Defense Products & Services | |
| MarketCap: 513.401 Millions | |
| Recent Price: 18.20 Smart Investing & Trading Score: 68 | |
| Day Percent Change: 4.12% Day Change: 0.72 | |
| Week Change: 3.94% Year-to-date Change: 8.3% | |
| EH Links: Profile News Message Board | |
| Charts:- Daily , Weekly | |
| Add EH to Watchlist: View: Get Complete EH Trend Analysis ➞ | |
 | BZ Kanzhun Limited |
| Sector: Industrials | |
| SubSector: Staffing & Employment Services | |
| MarketCap: 6680 Millions | |
| Recent Price: 19.60 Smart Investing & Trading Score: 100 | |
| Day Percent Change: 3.29% Day Change: 0.63 | |
| Week Change: 9.87% Year-to-date Change: 18.6% | |
| BZ Links: Profile News Message Board | |
| Charts:- Daily , Weekly | |
| Add BZ to Watchlist: View: Get Complete BZ Trend Analysis ➞ | |
 | CMPO CompoSecure, Inc. |
| Sector: Industrials | |
| SubSector: Metal Fabrication | |
| MarketCap: 535 Millions | |
| Recent Price: 6.69 Smart Investing & Trading Score: 68 | |
| Day Percent Change: 3.16% Day Change: 0.21 | |
| Week Change: 2.45% Year-to-date Change: 22.3% | |
| CMPO Links: Profile News Message Board | |
| Charts:- Daily , Weekly | |
| Add CMPO to Watchlist: View: Get Complete CMPO Trend Analysis ➞ | |
 | EVTL Vertical Aerospace Ltd. |
| Sector: Industrials | |
| SubSector: Aerospace & Defense | |
| MarketCap: 403 Millions | |
| Recent Price: 0.77 Smart Investing & Trading Score: 61 | |
| Day Percent Change: 3.14% Day Change: 0.02 | |
| Week Change: 7.5% Year-to-date Change: 13.0% | |
| EVTL Links: Profile News Message Board | |
| Charts:- Daily , Weekly | |
| Add EVTL to Watchlist: View: Get Complete EVTL Trend Analysis ➞ | |
 | EME EMCOR Group, Inc. |
| Sector: Industrials | |
| SubSector: General Contractors | |
| MarketCap: 3417.83 Millions | |
| Recent Price: 349.35 Smart Investing & Trading Score: 75 | |
| Day Percent Change: 3.09% Day Change: 10.46 | |
| Week Change: 6.3% Year-to-date Change: 62.2% | |
| EME Links: Profile News Message Board | |
| Charts:- Daily , Weekly | |
| Add EME to Watchlist: View: Get Complete EME Trend Analysis ➞ | |
 | NOC Northrop Grumman Corporation |
| Sector: Industrials | |
| SubSector: Aerospace/Defense - Major Diversified | |
| MarketCap: 52094.9 Millions | |
| Recent Price: 488.06 Smart Investing & Trading Score: 100 | |
| Day Percent Change: 2.84% Day Change: 13.49 | |
| Week Change: 5.51% Year-to-date Change: 4.3% | |
| NOC Links: Profile News Message Board | |
| Charts:- Daily , Weekly | |
| Add NOC to Watchlist: View: Get Complete NOC Trend Analysis ➞ | |
 | APT Alpha Pro Tech, Ltd. |
| Sector: Industrials | |
| SubSector: General Building Materials | |
| MarketCap: 125.953 Millions | |
| Recent Price: 6.14 Smart Investing & Trading Score: 36 | |
| Day Percent Change: 2.68% Day Change: 0.16 | |
| Week Change: -0.32% Year-to-date Change: 16.1% | |
| APT Links: Profile News Message Board | |
| Charts:- Daily , Weekly | |
| Add APT to Watchlist: View: Get Complete APT Trend Analysis ➞ | |
 | PCT PureCycle Technologies, Inc. |
| Sector: Industrials | |
| SubSector: Pollution & Treatment Controls | |
| MarketCap: 1610 Millions | |
| Recent Price: 5.05 Smart Investing & Trading Score: 53 | |
| Day Percent Change: 2.33% Day Change: 0.12 | |
| Week Change: -3.63% Year-to-date Change: 24.5% | |
| PCT Links: Profile News Message Board | |
| Charts:- Daily , Weekly | |
| Add PCT to Watchlist: View: Get Complete PCT Trend Analysis ➞ | |
 | ERJ Embraer S.A. |
| Sector: Industrials | |
| SubSector: Aerospace/Defense Products & Services | |
| MarketCap: 1623.71 Millions | |
| Recent Price: 25.00 Smart Investing & Trading Score: 68 | |
| Day Percent Change: 2.21% Day Change: 0.54 | |
| Week Change: 5.09% Year-to-date Change: 35.5% | |
| ERJ Links: Profile News Message Board | |
| Charts:- Daily , Weekly | |
| Add ERJ to Watchlist: View: Get Complete ERJ Trend Analysis ➞ | |
 | LOMA Loma Negra Compania Industrial Argentina Sociedad Anonima |
| Sector: Industrials | |
| SubSector: General Building Materials | |
| MarketCap: 408.853 Millions | |
| Recent Price: 7.17 Smart Investing & Trading Score: 73 | |
| Day Percent Change: 2.14% Day Change: 0.15 | |
| Week Change: 3.91% Year-to-date Change: 1.1% | |
| LOMA Links: Profile News Message Board | |
| Charts:- Daily , Weekly | |
| Add LOMA to Watchlist: View: Get Complete LOMA Trend Analysis ➞ | |
 | RXO RXO, Inc. |
| Sector: Industrials | |
| SubSector: Trucking | |
| MarketCap: 2550 Millions | |
| Recent Price: 19.82 Smart Investing & Trading Score: 25 | |
| Day Percent Change: 2.09% Day Change: 0.41 | |
| Week Change: 2.32% Year-to-date Change: -15.2% | |
| RXO Links: Profile News Message Board | |
| Charts:- Daily , Weekly | |
| Add RXO to Watchlist: View: Get Complete RXO Trend Analysis ➞ | |
 | FA First Advantage Corporation |
| Sector: Industrials | |
| SubSector: Specialty Business Services | |
| MarketCap: 2170 Millions | |
| Recent Price: 16.47 Smart Investing & Trading Score: 82 | |
| Day Percent Change: 1.92% Day Change: 0.31 | |
| Week Change: 7.51% Year-to-date Change: -1.3% | |
| FA Links: Profile News Message Board | |
| Charts:- Daily , Weekly | |
| Add FA to Watchlist: View: Get Complete FA Trend Analysis ➞ | |
 | TPH TRI Pointe Group, Inc. |
| Sector: Industrials | |
| SubSector: Residential Construction | |
| MarketCap: 1140.06 Millions | |
| Recent Price: 36.82 Smart Investing & Trading Score: 63 | |
| Day Percent Change: 1.80% Day Change: 0.65 | |
| Week Change: 5.41% Year-to-date Change: 4.0% | |
| TPH Links: Profile News Message Board | |
| Charts:- Daily , Weekly | |
| Add TPH to Watchlist: View: Get Complete TPH Trend Analysis ➞ | |
 | THR Thermon Group Holdings, Inc. |
| Sector: Industrials | |
| SubSector: Diversified Machinery | |
| MarketCap: 492.816 Millions | |
| Recent Price: 31.59 Smart Investing & Trading Score: 42 | |
| Day Percent Change: 1.77% Day Change: 0.55 | |
| Week Change: 6.22% Year-to-date Change: -3.0% | |
| THR Links: Profile News Message Board | |
| Charts:- Daily , Weekly | |
| Add THR to Watchlist: View: Get Complete THR Trend Analysis ➞ | |
 | AMBI Ambipar Emergency Response |
| Sector: Industrials | |
| SubSector: Waste Management | |
| MarketCap: 462 Millions | |
| Recent Price: 4.19 Smart Investing & Trading Score: 17 | |
| Day Percent Change: 1.70% Day Change: 0.07 | |
| Week Change: -14.14% Year-to-date Change: -46.7% | |
| AMBI Links: Profile News Message Board | |
| Charts:- Daily , Weekly | |
| Add AMBI to Watchlist: View: Get Complete AMBI Trend Analysis ➞ | |
 | CRS Carpenter Technology Corporation |
| Sector: Industrials | |
| SubSector: Metal Fabrication | |
| MarketCap: 853.35 Millions | |
| Recent Price: 81.75 Smart Investing & Trading Score: 100 | |
| Day Percent Change: 1.68% Day Change: 1.35 | |
| Week Change: 4.75% Year-to-date Change: 15.5% | |
| CRS Links: Profile News Message Board | |
| Charts:- Daily , Weekly | |
| Add CRS to Watchlist: View: Get Complete CRS Trend Analysis ➞ | |
| For tabular summary view of above stock list: Summary View ➞ 0 - 25 , 25 - 50 , 50 - 75 , 75 - 100 , 100 - 125 , 125 - 150 , 150 - 175 , 175 - 200 , 200 - 225 , 225 - 250 , 250 - 275 , 275 - 300 | ||
| Click To Change The Sort Order: By Market Cap or Company Size Performance: Year-to-date, Week and Day | |
| Select Chart Type: | ||
|
Best Stocks Today 12Stocks.com |
© 2024 12Stocks.com Terms & Conditions Privacy Contact Us
All Information Provided Only For Education And Not To Be Used For Investing or Trading. See Terms & Conditions


One More Thing ... Get Best Stocks Delivered Daily!
Never Ever Miss A Move With Our Top Ten Stocks Lists
Find Best Stocks In Any Market - Bull or Bear Market
Take A Peek At Our Top Ten Stocks Lists: Daily, Weekly, Year-to-Date & Top Trends
Find Best Stocks In Any Market - Bull or Bear Market
Take A Peek At Our Top Ten Stocks Lists: Daily, Weekly, Year-to-Date & Top Trends
Industrial Stocks With Best Up Trends [0-bearish to 100-bullish]: Dover [100], Kanzhun [100], Northrop Grumman[100], Carpenter Technology[100], Crane Co[100], Mueller Industries[100], Carrier Global[95], TransDigm [95], Generac [93], HEICO [93], Ducommun [93]
Best Industrial Stocks Year-to-Date:
Intuitive Machines[123.46%], FTAI Infrastructure[90.49%], NuScale Power[82.64%], Caesarstone [67.65%], Powell Industries[65.51%], EMCOR [62.16%], IES [61.01%], Masonite [55.62%], ADS-TEC Energy[52.88%], Tutor Perini[52.64%], Comfort Systems[51.41%] Best Industrial Stocks This Week:
NuScale Power[21.44%], BiomX [16.55%], JELD-WEN Holding[14.65%], Joby Aviation[12.33%], Powell Industries[12.25%], ZIM Integrated[12%], Mueller Industries[11.73%], Crane Co[11.2%], FTAI Infrastructure[11.09%], IES [10.42%], Caesarstone [10.19%] Best Industrial Stocks Daily:
JELD-WEN Holding[11.54%], Brooge [9.13%], Shengfeng Development[7.69%], Carrier Global[7.19%], Meritage Homes[6.71%], Joby Aviation[6.14%], NuScale Power[6.13%], Darling Ingredients[4.94%], Dover [4.47%], EHang [4.12%], Kanzhun [3.29%]