
 Login Sign Up


| |||||
 |  | ||||

| 12Stocks.com Market Intelligence |
Best Healthcare Stocks
 | "Discover best trending healthcare stocks with 12Stocks.com." |
| - Subu Vdaygiri, Founder, 12Stocks.com |
| In a hurry? Healthcare Stocks Lists: Performance Trends Table, Stock Charts
Sort Healthcare stocks: Daily, Weekly, Year-to-Date, Market Cap & Trends. Filter Healthcare stocks list by size:All Healthcare Large Mid-Range Small |
| 12Stocks.com Healthcare Stocks Performances & Trends Daily | |||||||||
|
|  The overall Smart Investing & Trading Score is 83 (0-bearish to 100-bullish) which puts Healthcare sector in short term bullish trend. The Smart Investing & Trading Score from previous trading session is 88 and a deterioration of trend continues.
| ||||||||
Here are the Smart Investing & Trading Scores of the most requested Healthcare stocks at 12Stocks.com (click stock name for detailed review):
|


| 12Stocks.com: Investing in Healthcare sector with Stocks | |
|
The following table helps investors and traders sort through current performance and trends (as measured by Smart Investing & Trading Score) of various
stocks in the Healthcare sector. Quick View: Move mouse or cursor over stock symbol (ticker) to view short-term Technical chart and over stock name to view long term chart. Click on  to add stock symbol to your watchlist and to add stock symbol to your watchlist and  to view watchlist. Click on any ticker or stock name for detailed market intelligence report for that stock. to view watchlist. Click on any ticker or stock name for detailed market intelligence report for that stock. |
12Stocks.com Performance of Stocks in Healthcare Sector
| Ticker | Stock Name | Watchlist | Category | Recent Price | Smart Investing & Trading Score | Change % | YTD Change% |
| RLAY | Relay |   | Biotechnology | 7.09 | 74 | 4.50% | -35.59% |
| RNLX | Renalytix AI | | Diagnostics & Research | 0.49 | 10 | -4.79% | 25.58% |
| ALXO | ALX Oncology | | Biotechnology | 14.00 | 10 | 1.52% | -5.91% |
| BSX | Boston Scientific | | Equipment | 75.81 | 100 | 0.60% | 31.15% |
| BDSX | Biodesix | | Diagnostics & Research | 1.58 | 85 | 0.64% | -16.84% |
| PRFX | PainReform | | Drug Manufacturers Specialty & Generic | 0.77 | 10 | 0.00% | -72.08% |
| ZCMD | Zhongchao | | Health Information | 1.51 | 32 | 0.00% | 313.59% |
| ANVS | Annovis Bio | | Biotechnology | 8.64 | 93 | -1.26% | -53.80% |
| BAX | Baxter | | Instruments | 34.91 | 10 | -0.30% | -9.69% |
| ILMN | Illumina | | Biotechnology | 107.74 | 0 | -0.73% | -22.62% |
| HLN | Haleon | | Drug Manufacturers - Specialty & Generic | 8.54 | 70 | -0.52% | 3.77% |
| LEGN | Legend Biotech | | Biotechnology | 43.82 | 10 | -3.54% | -27.35% |
| EW | Edwards Lifesciences | | Equipment | 90.26 | 88 | 0.53% | 18.37% |
| GEHC | GE | | Health Information | 81.34 | 35 | -0.73% | 5.18% |
| GLTO | Galecto | | Biotechnology | 0.64 | 20 | 0.00% | -11.68% |
| HUM | Humana | | Insurance | 355.82 | 83 | 0.17% | -22.28% |
| NARI | Inari | | Medical Devices | 45.57 | 63 | -1.21% | -29.83% |
| ACCD | Accolade | | Health Information | 7.47 | 64 | -2.73% | -37.85% |
| HCA | HCA | | Hospitals | 320.00 | 53 | -1.55% | 18.22% |
| CNC | Centene | | Insurance | 78.22 | 50 | 0.84% | 5.40% |
| RPRX | Royalty Pharma | | Biotechnology | 27.45 | 17 | -0.13% | -2.30% |
| BNR | Burning Rock | | Diagnostics & Research | 7.78 | 73 | 0.00% | 706.30% |
| KYMR | Kymera | | Biotechnology | 36.06 | 40 | 0.15% | 41.93% |
| IMAB | I Mab | | Biotechnology | 1.75 | 20 | -0.28% | -7.89% |
| PRLD | Prelude | | Biotechnology | 4.21 | 62 | 2.18% | -3.22% |
| For chart view version of above stock list: Chart View ➞ 0 - 25 , 25 - 50 , 50 - 75 , 75 - 100 , 100 - 125 , 125 - 150 , 150 - 175 , 175 - 200 , 200 - 225 , 225 - 250 , 250 - 275 , 275 - 300 , 300 - 325 , 325 - 350 , 350 - 375 , 375 - 400 , 400 - 425 , 425 - 450 , 450 - 475 , 475 - 500 , 500 - 525 , 525 - 550 , 550 - 575 , 575 - 600 , 600 - 625 , 625 - 650 , 650 - 675 | ||
 | Click To Change The Sort Order: By Market Cap or Company Size Performance: Year-to-date, Week and Day |  |
|
Get the most comprehensive stock market coverage daily at 12Stocks.com ➞ Best Stocks Today ➞ Best Stocks Weekly ➞ Best Stocks Year-to-Date ➞ Best Stocks Trends ➞  Best Stocks Today 12Stocks.com Best Nasdaq Stocks ➞ Best S&P 500 Stocks ➞ Best Tech Stocks ➞ Best Biotech Stocks ➞ |
| Detailed Overview of Healthcare Stocks |
| Healthcare Technical Overview, Leaders & Laggards, Top Healthcare ETF Funds & Detailed Healthcare Stocks List, Charts, Trends & More |
| Healthcare Sector: Technical Analysis, Trends & YTD Performance | |
| Healthcare sector is composed of stocks
from pharmaceutical, biotech, diagnostics labs, insurance providers
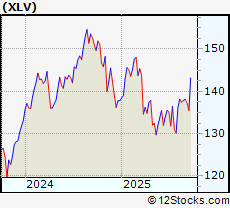
and healthcare services. Healthcare sector, as represented by XLV, an exchange-traded fund [ETF] that holds basket of Healthcare stocks (e.g, Merck, Amgen) is up by 7.11% and is currently underperforming the overall market by -3.61% year-to-date. Below is a quick view of Technical charts and trends: |
|
 XLV Weekly Chart |
|
| Long Term Trend: Very Good | |
| Medium Term Trend: Very Good | |
 XLV Daily Chart |
|
| Short Term Trend: Good | |
| Overall Trend Score: 83 | |
| YTD Performance: 7.11% | |
| **Trend Scores & Views Are Only For Educational Purposes And Not For Investing | |
| 12Stocks.com: Top Performing Healthcare Sector Stocks | ||||||||||||||||||||||||||||||||||||||||||||||||
 The top performing Healthcare sector stocks year to date are
Now, more recently, over last week, the top performing Healthcare sector stocks on the move are


|
||||||||||||||||||||||||||||||||||||||||||||||||
| 12Stocks.com: Investing in Healthcare Sector using Exchange Traded Funds | |
|
The following table shows list of key exchange traded funds (ETF) that
help investors track Healthcare Index. For detailed view, check out our ETF Funds section of our website. Quick View: Move mouse or cursor over ETF symbol (ticker) to view short-term Technical chart and over ETF name to view long term chart. Click on ticker or stock name for detailed view. Click on to add stock symbol to your watchlist and to view watchlist. |
12Stocks.com List of ETFs that track Healthcare Index
| Ticker | ETF Name | Watchlist | Recent Price | Smart Investing & Trading Score | Change % | Week % | Year-to-date % |
| XLV | Health Care | | 146.08 | 83 | 0.05 | -0.16 | 7.11% |
| XBI | Biotech | | 91.72 | 38 | -0.60 | 0.59 | 2.72% |
| IBB | Biotechnology | | 136.39 | 70 | -0.81 | -0.22 | 0.4% |
| BBH | Biotech | | 168.05 | 83 | -0.32 | 0.04 | 1.66% |
| IHF | Healthcare Providers | | 53.57 | 76 | 0.06 | -0.63 | 2.02% |
| IHI | Medical Devices | | 56.35 | 38 | -0.17 | -0.59 | 4.42% |
| BIB | Biotechnology | | 57.88 | 60 | -0.02 | 1.62 | 1.45% |
| CURE | Healthcare Bull 3X | | 118.58 | 61 | 0.28 | -0.44 | 16.55% |
| LABU | Biotech Bull 3X | | 113.83 | 30 | -1.70 | 1.82 | -6.67% |
| LABD | Biotech Bear 3X | | 7.82 | 61 | 1.96 | -1.64 | -19.3% |
| RXL | Health Care | | 103.09 | 90 | 0.19 | 0.32 | 12.79% |
| 12Stocks.com: Charts, Trends, Fundamental Data and Performances of Healthcare Stocks | |
|
We now take in-depth look at all Healthcare stocks including charts, multi-period performances and overall trends (as measured by Smart Investing & Trading Score). One can sort Healthcare stocks (click link to choose) by Daily, Weekly and by Year-to-Date performances. Also, one can sort by size of the company or by market capitalization. |
| Select Your Default Chart Type: | |||||
| |||||
| Click on stock symbol or name for detailed view. Click on to add stock symbol to your watchlist and to view watchlist. Quick View: Move mouse or cursor over "Daily" to quickly view daily Technical stock chart and over "Weekly" to view weekly Technical stock chart. | |||||

 | RLAY Relay Therapeutics, Inc. |
| Sector: Health Care | |
| SubSector: Biotechnology | |
| MarketCap: 45887 Millions | |
| Recent Price: 7.09 Smart Investing & Trading Score: 74 | |
| Day Percent Change: 4.50% Day Change: 0.30 | |
| Week Change: 6.7% Year-to-date Change: -35.6% | |
| RLAY Links: Profile News Message Board | |
| Charts:- Daily , Weekly | |
| Add RLAY to Watchlist: View: Get Complete RLAY Trend Analysis ➞ | |
 | RNLX Renalytix AI plc |
| Sector: Health Care | |
| SubSector: Diagnostics & Research | |
| MarketCap: 45487 Millions | |
| Recent Price: 0.49 Smart Investing & Trading Score: 10 | |
| Day Percent Change: -4.79% Day Change: -0.02 | |
| Week Change: -4.31% Year-to-date Change: 25.6% | |
| RNLX Links: Profile News Message Board | |
| Charts:- Daily , Weekly | |
| Add RNLX to Watchlist: View: Get Complete RNLX Trend Analysis ➞ | |
 | ALXO ALX Oncology Holdings Inc. |
| Sector: Health Care | |
| SubSector: Biotechnology | |
| MarketCap: 41787 Millions | |
| Recent Price: 14.00 Smart Investing & Trading Score: 10 | |
| Day Percent Change: 1.52% Day Change: 0.21 | |
| Week Change: -1.48% Year-to-date Change: -5.9% | |
| ALXO Links: Profile News Message Board | |
| Charts:- Daily , Weekly | |
| Add ALXO to Watchlist: View: Get Complete ALXO Trend Analysis ➞ | |
 | BSX Boston Scientific Corporation |
| Sector: Health Care | |
| SubSector: Medical Appliances & Equipment | |
| MarketCap: 41541.2 Millions | |
| Recent Price: 75.81 Smart Investing & Trading Score: 100 | |
| Day Percent Change: 0.60% Day Change: 0.45 | |
| Week Change: 1.56% Year-to-date Change: 31.2% | |
| BSX Links: Profile News Message Board | |
| Charts:- Daily , Weekly | |
| Add BSX to Watchlist: View: Get Complete BSX Trend Analysis ➞ | |
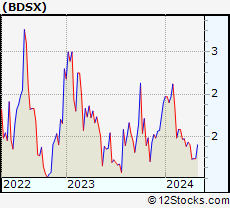 | BDSX Biodesix, Inc. |
| Sector: Health Care | |
| SubSector: Diagnostics & Research | |
| MarketCap: 41487 Millions | |
| Recent Price: 1.58 Smart Investing & Trading Score: 85 | |
| Day Percent Change: 0.64% Day Change: 0.01 | |
| Week Change: 0.32% Year-to-date Change: -16.8% | |
| BDSX Links: Profile News Message Board | |
| Charts:- Daily , Weekly | |
| Add BDSX to Watchlist: View: Get Complete BDSX Trend Analysis ➞ | |
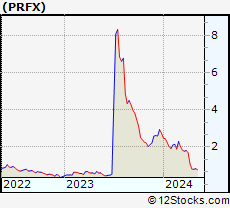 | PRFX PainReform Ltd. |
| Sector: Health Care | |
| SubSector: Drug Manufacturers Specialty & Generic | |
| MarketCap: 41487 Millions | |
| Recent Price: 0.77 Smart Investing & Trading Score: 10 | |
| Day Percent Change: 0.00% Day Change: 0.00 | |
| Week Change: -8.87% Year-to-date Change: -72.1% | |
| PRFX Links: Profile News Message Board | |
| Charts:- Daily , Weekly | |
| Add PRFX to Watchlist: View: Get Complete PRFX Trend Analysis ➞ | |
 | ZCMD Zhongchao Inc. |
| Sector: Health Care | |
| SubSector: Health Information Services | |
| MarketCap: 41487 Millions | |
| Recent Price: 1.51 Smart Investing & Trading Score: 32 | |
| Day Percent Change: 0.00% Day Change: 0.00 | |
| Week Change: 0% Year-to-date Change: 313.6% | |
| ZCMD Links: Profile News Message Board | |
| Charts:- Daily , Weekly | |
| Add ZCMD to Watchlist: View: Get Complete ZCMD Trend Analysis ➞ | |
 | ANVS Annovis Bio, Inc. |
| Sector: Health Care | |
| SubSector: Biotechnology | |
| MarketCap: 41487 Millions | |
| Recent Price: 8.64 Smart Investing & Trading Score: 93 | |
| Day Percent Change: -1.26% Day Change: -0.11 | |
| Week Change: 3.97% Year-to-date Change: -53.8% | |
| ANVS Links: Profile News Message Board | |
| Charts:- Daily , Weekly | |
| Add ANVS to Watchlist: View: Get Complete ANVS Trend Analysis ➞ | |
 | BAX Baxter International Inc. |
| Sector: Health Care | |
| SubSector: Medical Instruments & Supplies | |
| MarketCap: 39955.8 Millions | |
| Recent Price: 34.91 Smart Investing & Trading Score: 10 | |
| Day Percent Change: -0.30% Day Change: -0.11 | |
| Week Change: -0.95% Year-to-date Change: -9.7% | |
| BAX Links: Profile News Message Board | |
| Charts:- Daily , Weekly | |
| Add BAX to Watchlist: View: Get Complete BAX Trend Analysis ➞ | |
 | ILMN Illumina, Inc. |
| Sector: Health Care | |
| SubSector: Biotechnology | |
| MarketCap: 39194.3 Millions | |
| Recent Price: 107.74 Smart Investing & Trading Score: 0 | |
| Day Percent Change: -0.73% Day Change: -0.79 | |
| Week Change: -3% Year-to-date Change: -22.6% | |
| ILMN Links: Profile News Message Board | |
| Charts:- Daily , Weekly | |
| Add ILMN to Watchlist: View: Get Complete ILMN Trend Analysis ➞ | |
 | HLN Haleon plc |
| Sector: Health Care | |
| SubSector: Drug Manufacturers - Specialty & Generic | |
| MarketCap: 38310 Millions | |
| Recent Price: 8.54 Smart Investing & Trading Score: 70 | |
| Day Percent Change: -0.52% Day Change: -0.05 | |
| Week Change: 0.35% Year-to-date Change: 3.8% | |
| HLN Links: Profile News Message Board | |
| Charts:- Daily , Weekly | |
| Add HLN to Watchlist: View: Get Complete HLN Trend Analysis ➞ | |
 | LEGN Legend Biotech Corporation |
| Sector: Health Care | |
| SubSector: Biotechnology | |
| MarketCap: 37387 Millions | |
| Recent Price: 43.82 Smart Investing & Trading Score: 10 | |
| Day Percent Change: -3.54% Day Change: -1.61 | |
| Week Change: -2.97% Year-to-date Change: -27.4% | |
| LEGN Links: Profile News Message Board | |
| Charts:- Daily , Weekly | |
| Add LEGN to Watchlist: View: Get Complete LEGN Trend Analysis ➞ | |
 | EW Edwards Lifesciences Corporation |
| Sector: Health Care | |
| SubSector: Medical Appliances & Equipment | |
| MarketCap: 36735.5 Millions | |
| Recent Price: 90.26 Smart Investing & Trading Score: 88 | |
| Day Percent Change: 0.53% Day Change: 0.48 | |
| Week Change: 1.26% Year-to-date Change: 18.4% | |
| EW Links: Profile News Message Board | |
| Charts:- Daily , Weekly | |
| Add EW to Watchlist: View: Get Complete EW Trend Analysis ➞ | |
 | GEHC GE HealthCare Technologies Inc. |
| Sector: Health Care | |
| SubSector: Health Information Services | |
| MarketCap: 36240 Millions | |
| Recent Price: 81.34 Smart Investing & Trading Score: 35 | |
| Day Percent Change: -0.73% Day Change: -0.59 | |
| Week Change: -0.63% Year-to-date Change: 5.2% | |
| GEHC Links: Profile News Message Board | |
| Charts:- Daily , Weekly | |
| Add GEHC to Watchlist: View: Get Complete GEHC Trend Analysis ➞ | |
 | GLTO Galecto, Inc. |
| Sector: Health Care | |
| SubSector: Biotechnology | |
| MarketCap: 34487 Millions | |
| Recent Price: 0.64 Smart Investing & Trading Score: 20 | |
| Day Percent Change: 0.00% Day Change: 0.00 | |
| Week Change: 2.38% Year-to-date Change: -11.7% | |
| GLTO Links: Profile News Message Board | |
| Charts:- Daily , Weekly | |
| Add GLTO to Watchlist: View: Get Complete GLTO Trend Analysis ➞ | |
 | HUM Humana Inc. |
| Sector: Health Care | |
| SubSector: Health Care Plans | |
| MarketCap: 34125.6 Millions | |
| Recent Price: 355.82 Smart Investing & Trading Score: 83 | |
| Day Percent Change: 0.17% Day Change: 0.60 | |
| Week Change: -0.11% Year-to-date Change: -22.3% | |
| HUM Links: Profile News Message Board | |
| Charts:- Daily , Weekly | |
| Add HUM to Watchlist: View: Get Complete HUM Trend Analysis ➞ | |
 | NARI Inari Medical, Inc. |
| Sector: Health Care | |
| SubSector: Medical Devices | |
| MarketCap: 33287 Millions | |
| Recent Price: 45.57 Smart Investing & Trading Score: 63 | |
| Day Percent Change: -1.21% Day Change: -0.56 | |
| Week Change: -0.39% Year-to-date Change: -29.8% | |
| NARI Links: Profile News Message Board | |
| Charts:- Daily , Weekly | |
| Add NARI to Watchlist: View: Get Complete NARI Trend Analysis ➞ | |
 | ACCD Accolade, Inc. |
| Sector: Health Care | |
| SubSector: Health Information Services | |
| MarketCap: 32987 Millions | |
| Recent Price: 7.47 Smart Investing & Trading Score: 64 | |
| Day Percent Change: -2.73% Day Change: -0.21 | |
| Week Change: -0.13% Year-to-date Change: -37.9% | |
| ACCD Links: Profile News Message Board | |
| Charts:- Daily , Weekly | |
| Add ACCD to Watchlist: View: Get Complete ACCD Trend Analysis ➞ | |
 | HCA HCA Healthcare, Inc. |
| Sector: Health Care | |
| SubSector: Hospitals | |
| MarketCap: 29466.6 Millions | |
| Recent Price: 320.00 Smart Investing & Trading Score: 53 | |
| Day Percent Change: -1.55% Day Change: -5.05 | |
| Week Change: -0.89% Year-to-date Change: 18.2% | |
| HCA Links: Profile News Message Board | |
| Charts:- Daily , Weekly | |
| Add HCA to Watchlist: View: Get Complete HCA Trend Analysis ➞ | |
 | CNC Centene Corporation |
| Sector: Health Care | |
| SubSector: Health Care Plans | |
| MarketCap: 29075 Millions | |
| Recent Price: 78.22 Smart Investing & Trading Score: 50 | |
| Day Percent Change: 0.84% Day Change: 0.65 | |
| Week Change: 0.2% Year-to-date Change: 5.4% | |
| CNC Links: Profile News Message Board | |
| Charts:- Daily , Weekly | |
| Add CNC to Watchlist: View: Get Complete CNC Trend Analysis ➞ | |
 | RPRX Royalty Pharma plc |
| Sector: Health Care | |
| SubSector: Biotechnology | |
| MarketCap: 28457 Millions | |
| Recent Price: 27.45 Smart Investing & Trading Score: 17 | |
| Day Percent Change: -0.13% Day Change: -0.04 | |
| Week Change: 0.31% Year-to-date Change: -2.3% | |
| RPRX Links: Profile News Message Board | |
| Charts:- Daily , Weekly | |
| Add RPRX to Watchlist: View: Get Complete RPRX Trend Analysis ➞ | |
 | BNR Burning Rock Biotech Limited |
| Sector: Health Care | |
| SubSector: Diagnostics & Research | |
| MarketCap: 27887 Millions | |
| Recent Price: 7.78 Smart Investing & Trading Score: 73 | |
| Day Percent Change: 0.00% Day Change: 0.00 | |
| Week Change: -6.27% Year-to-date Change: 706.3% | |
| BNR Links: Profile News Message Board | |
| Charts:- Daily , Weekly | |
| Add BNR to Watchlist: View: Get Complete BNR Trend Analysis ➞ | |
 | KYMR Kymera Therapeutics, Inc. |
| Sector: Health Care | |
| SubSector: Biotechnology | |
| MarketCap: 27087 Millions | |
| Recent Price: 36.06 Smart Investing & Trading Score: 40 | |
| Day Percent Change: 0.15% Day Change: 0.05 | |
| Week Change: 3.19% Year-to-date Change: 41.9% | |
| KYMR Links: Profile News Message Board | |
| Charts:- Daily , Weekly | |
| Add KYMR to Watchlist: View: Get Complete KYMR Trend Analysis ➞ | |
 | IMAB I Mab |
| Sector: Health Care | |
| SubSector: Biotechnology | |
| MarketCap: 26187 Millions | |
| Recent Price: 1.75 Smart Investing & Trading Score: 20 | |
| Day Percent Change: -0.28% Day Change: 0.00 | |
| Week Change: 0% Year-to-date Change: -7.9% | |
| IMAB Links: Profile News Message Board | |
| Charts:- Daily , Weekly | |
| Add IMAB to Watchlist: View: Get Complete IMAB Trend Analysis ➞ | |
 | PRLD Prelude Therapeutics Incorporated |
| Sector: Health Care | |
| SubSector: Biotechnology | |
| MarketCap: 26087 Millions | |
| Recent Price: 4.21 Smart Investing & Trading Score: 62 | |
| Day Percent Change: 2.18% Day Change: 0.09 | |
| Week Change: 5.25% Year-to-date Change: -3.2% | |
| PRLD Links: Profile News Message Board | |
| Charts:- Daily , Weekly | |
| Add PRLD to Watchlist: View: Get Complete PRLD Trend Analysis ➞ | |
| For tabular summary view of above stock list: Summary View ➞ 0 - 25 , 25 - 50 , 50 - 75 , 75 - 100 , 100 - 125 , 125 - 150 , 150 - 175 , 175 - 200 , 200 - 225 , 225 - 250 , 250 - 275 , 275 - 300 , 300 - 325 , 325 - 350 , 350 - 375 , 375 - 400 , 400 - 425 , 425 - 450 , 450 - 475 , 475 - 500 , 500 - 525 , 525 - 550 , 550 - 575 , 575 - 600 , 600 - 625 , 625 - 650 , 650 - 675 | ||
| Click To Change The Sort Order: By Market Cap or Company Size Performance: Year-to-date, Week and Day | |
| Select Chart Type: | ||
|
Best Stocks Today 12Stocks.com |
© 2024 12Stocks.com Terms & Conditions Privacy Contact Us
All Information Provided Only For Education And Not To Be Used For Investing or Trading. See Terms & Conditions


One More Thing ... Get Best Stocks Delivered Daily!
Never Ever Miss A Move With Our Top Ten Stocks Lists
Find Best Stocks In Any Market - Bull or Bear Market
Take A Peek At Our Top Ten Stocks Lists: Daily, Weekly, Year-to-Date & Top Trends
Find Best Stocks In Any Market - Bull or Bear Market
Take A Peek At Our Top Ten Stocks Lists: Daily, Weekly, Year-to-Date & Top Trends
Healthcare Stocks With Best Up Trends [0-bearish to 100-bullish]: Concord [100], Third Harmonic[100], Wave Life[100], Arbutus Biopharma[100], Humacyte [100], Integer [100], Boston Scientific[100], Vericel [100], Reneo [100], Stoke [100], Cytosorbents [100]
Best Healthcare Stocks Year-to-Date:
Pieris [6042.86%], Precision BioSciences[3397.26%], Avenue [2266.46%], Inovio [2071.57%], Assembly Biosciences[1724.17%], Aurora Cannabis[1479.17%], Agenus [1233.49%], NuCana [1117.04%], Adverum Biotechnologies[1013.18%], Affimed N.V[725.6%], Burning Rock[706.3%] Best Healthcare Stocks This Week:
Genelux [31.78%], Concord [31.16%], Dyne [23.66%], Scilex Holding[22.22%], PTC [20.61%], Nobilis Health[19.65%], Petros [19.01%], Atara Bio[17.11%], Sutro Biopharma[17.08%], CareMax [16.61%], InnovAge Holding[16.49%] Best Healthcare Stocks Daily:
CareMax [17.83%], Accelerate Diagnostics[12.26%], Genelux [11.86%], Petros [11.60%], Concord [10.00%], Brainstorm Cell[9.95%], Vaxxinity [9.30%], Mesoblast [7.80%], Compugen [6.61%], Tandem Diabetes[6.20%], Third Harmonic[5.83%]