
 Login Sign Up


| |||||
 |  | ||||

| 12Stocks.com Market Intelligence |
Best Financial Stocks
| In a hurry? Financial Stocks Lists: Performance Trends Table, Stock Charts
Sort Financial stocks: Daily, Weekly, Year-to-Date, Market Cap & Trends. Filter Financial stocks list by size:All Financial Large Mid-Range Small & MicroCap |
| 12Stocks.com Financial Stocks Performances & Trends Daily | |||||||||
|
|  The overall Smart Investing & Trading Score is 53 (0-bearish to 100-bullish) which puts Financial sector in short term neutral trend. The Smart Investing & Trading Score from previous trading session is 36 and hence an improvement of trend.
| ||||||||
Here are the Smart Investing & Trading Scores of the most requested Financial stocks at 12Stocks.com (click stock name for detailed review):
|


| 12Stocks.com: Investing in Financial sector with Stocks | |
|
The following table helps investors and traders sort through current performance and trends (as measured by Smart Investing & Trading Score) of various
stocks in the Financial sector. Quick View: Move mouse or cursor over stock symbol (ticker) to view short-term Technical chart and over stock name to view long term chart. Click on  to add stock symbol to your watchlist and to add stock symbol to your watchlist and  to view watchlist. Click on any ticker or stock name for detailed market intelligence report for that stock. to view watchlist. Click on any ticker or stock name for detailed market intelligence report for that stock. |
12Stocks.com Performance of Stocks in Financial Sector
| Ticker | Stock Name | Watchlist | Category | Recent Price | Smart Investing & Trading Score | Change % | YTD Change% |
| HIPO | Hippo |   | Insurance - Specialty | 18.53 | 31 | 2.04% | 103.40% |
| GLAD | Gladstone Capital | | Closed-End Fund - Debt | 21.43 | 63 | 0.89% | 100.28% |
| BBAR | Banco BBVA | | Foreign Banks | 10.49 | 100 | 9.27% | 92.83% |
| EVER | EverQuote | | Regional Banks | 21.75 | 100 | 1.02% | 77.70% |
| SUPV | Grupo Supervielle | | Foreign Banks | 6.87 | 100 | 5.53% | 69.21% |
| YRD | Yiren Digital | | Credit Services | 5.21 | 78 | -4.40% | 66.99% |
| FFNW | First | | Regional Banks | 20.40 | 37 | 0.44% | 51.34% |
| RILY | B. Riley | | Asset Mgmt | 31.10 | 68 | -7.39% | 48.17% |
| VIST | Vista Oil | | Asset Mgmt | 43.20 | 70 | 1.72% | 46.39% |
| SIEB | Siebert | | Brokerage | 2.32 | 100 | 17.17% | 38.10% |
| INBK | First Internet | | Regional Banks | 32.08 | 85 | 1.20% | 32.62% |
| ALCC | AltC Acquisition | | SPAC | 13.61 | 78 | 4.53% | 29.13% |
| EDF | Stone Harbor | | Asset Mgmt | 5.55 | 95 | 1.83% | 28.77% |
| TRTX | TPG RE | | Mortgage | 8.36 | 100 | 2.83% | 28.62% |
| MCBC | Macatawa Bank | | Regional Banks | 14.42 | 83 | 0.84% | 27.84% |
| HCI | HCI | | Insurance | 110.87 | 41 | -0.80% | 26.85% |
| MLP | Maui Land | | Real Estatet | 20.12 | 73 | 0.00% | 26.62% |
| HRTG | Heritage Insurance | | Insurance | 8.15 | 26 | 2.26% | 25.00% |
| UVE | Universal Insurance | | Insurance | 19.81 | 37 | 0.46% | 23.97% |
| QFIN | 360 Finance | | Credit Services | 19.50 | 95 | -1.91% | 23.26% |
| COOP | Mr. Cooper | | S&L | 80.10 | 83 | 1.84% | 23.00% |
| BLX | Banco Latinoamericano | | Foreign Banks | 30.39 | 85 | 1.50% | 22.84% |
| EZPW | EZCORP | | Credit Services | 10.43 | 13 | -1.04% | 19.34% |
| NXE | NexGen Energy | | Closed-End Fund - Debt | 8.29 | 88 | 1.47% | 18.43% |
| PIPR | Piper Sandler | | Asset Mgmt | 206.14 | 100 | 1.47% | 17.88% |
| For chart view version of above stock list: Chart View ➞ 0 - 25 , 25 - 50 , 50 - 75 , 75 - 100 , 100 - 125 , 125 - 150 , 150 - 175 , 175 - 200 , 200 - 225 , 225 - 250 , 250 - 275 , 275 - 300 , 300 - 325 , 325 - 350 , 350 - 375 , 375 - 400 , 400 - 425 , 425 - 450 , 450 - 475 , 475 - 500 , 500 - 525 , 525 - 550 , 550 - 575 , 575 - 600 , 600 - 625 , 625 - 650 , 650 - 675 | ||
 | Click To Change The Sort Order: By Market Cap or Company Size Performance: Year-to-date, Week and Day |  |
|
Get the most comprehensive stock market coverage daily at 12Stocks.com ➞ Best Stocks Today ➞ Best Stocks Weekly ➞ Best Stocks Year-to-Date ➞ Best Stocks Trends ➞  Best Stocks Today 12Stocks.com Best Nasdaq Stocks ➞ Best S&P 500 Stocks ➞ Best Tech Stocks ➞ Best Biotech Stocks ➞ |
| Detailed Overview of Financial Stocks |
| Financial Technical Overview, Leaders & Laggards, Top Financial ETF Funds & Detailed Financial Stocks List, Charts, Trends & More |
| Financial Sector: Technical Analysis, Trends & YTD Performance | |
| Financial sector is composed of stocks
from banks, brokers, insurance, REITs
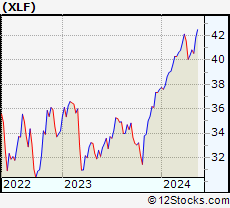
and services subsectors. Financial sector, as represented by XLF, an exchange-traded fund [ETF] that holds basket of Financial stocks (e.g, Bank of America, Goldman Sachs) is up by 7.85% and is currently outperforming the overall market by 0.97% year-to-date. Below is a quick view of Technical charts and trends: |
|
 XLF Weekly Chart |
|
| Long Term Trend: Good | |
| Medium Term Trend: Good | |
 XLF Daily Chart |
|
| Short Term Trend: Very Good | |
| Overall Trend Score: 53 | |
| YTD Performance: 7.85% | |
| **Trend Scores & Views Are Only For Educational Purposes And Not For Investing | |
| 12Stocks.com: Top Performing Financial Sector Stocks | ||||||||||||||||||||||||||||||||||||||||||||||||
 The top performing Financial sector stocks year to date are
Now, more recently, over last week, the top performing Financial sector stocks on the move are


|
||||||||||||||||||||||||||||||||||||||||||||||||
| 12Stocks.com: Investing in Financial Sector using Exchange Traded Funds | |
|
The following table shows list of key exchange traded funds (ETF) that
help investors track Financial Index. For detailed view, check out our ETF Funds section of our website. Quick View: Move mouse or cursor over ETF symbol (ticker) to view short-term Technical chart and over ETF name to view long term chart. Click on ticker or stock name for detailed view. Click on to add stock symbol to your watchlist and to view watchlist. |
12Stocks.com List of ETFs that track Financial Index
| Ticker | ETF Name | Watchlist | Recent Price | Smart Investing & Trading Score | Change % | Week % | Year-to-date % |
| XLF | Financial | | 40.55 | 53 | 0.22 | -0.66 | 7.85% |
| IAI | Broker-Dealers & Secs | | 114.27 | 95 | 0.98 | 1.11 | 5.29% |
| IYF | Financials | | 92.47 | 78 | 0.38 | 0.33 | 8.27% |
| IYG | Financial Services | | 64.09 | 60 | 0.31 | -0.8 | 7.29% |
| KRE | Regional Banking | | 49.65 | 100 | 1.29 | 3.03 | -5.3% |
| IXG | Global Financials | | 84.84 | 85 | 0.87 | 0.77 | 7.97% |
| VFH | Financials | | 98.70 | 73 | 0.34 | -0.23 | 6.98% |
| KBE | Bank | | 46.39 | 100 | 1.16 | 2.34 | 0.8% |
| FAS | Financial Bull 3X | | 98.83 | 60 | 0.95 | -1.79 | 19.58% |
| FAZ | Financial Bear 3X | | 11.08 | 17 | -0.89 | 2.03 | -18.95% |
| UYG | Financials | | 62.79 | 60 | 0.56 | -1.35 | 13.75% |
| IAT | Regional Banks | | 42.29 | 100 | 0.93 | 1.37 | 1.08% |
| KIE | Insurance | | 49.48 | 60 | 0.39 | 1.96 | 9.42% |
| PSCF | SmallCap Financials | | 47.28 | 100 | 0.77 | 1.98 | -3.86% |
| EUFN | Europe Financials | | 22.65 | 85 | 0.24 | 0.82 | 8.04% |
| PGF | Financial Preferred | | 14.85 | 64 | 1.43 | 1.92 | 1.85% |
| 12Stocks.com: Charts, Trends, Fundamental Data and Performances of Financial Stocks | |
|
We now take in-depth look at all Financial stocks including charts, multi-period performances and overall trends (as measured by Smart Investing & Trading Score). One can sort Financial stocks (click link to choose) by Daily, Weekly and by Year-to-Date performances. Also, one can sort by size of the company or by market capitalization. |
| Select Your Default Chart Type: | |||||
| |||||
| Click on stock symbol or name for detailed view. Click on to add stock symbol to your watchlist and to view watchlist. Quick View: Move mouse or cursor over "Daily" to quickly view daily Technical stock chart and over "Weekly" to view weekly Technical stock chart. | |||||

 | HIPO Hippo Holdings Inc. |
| Sector: Financials | |
| SubSector: Insurance - Specialty | |
| MarketCap: 377 Millions | |
| Recent Price: 18.53 Smart Investing & Trading Score: 31 | |
| Day Percent Change: 2.04% Day Change: 0.37 | |
| Week Change: -15.08% Year-to-date Change: 103.4% | |
| HIPO Links: Profile News Message Board | |
| Charts:- Daily , Weekly | |
| Add HIPO to Watchlist: View: Get Complete HIPO Trend Analysis ➞ | |
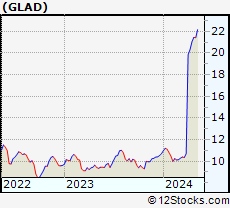 | GLAD Gladstone Capital Corporation |
| Sector: Financials | |
| SubSector: Closed-End Fund - Debt | |
| MarketCap: 174.807 Millions | |
| Recent Price: 21.43 Smart Investing & Trading Score: 63 | |
| Day Percent Change: 0.89% Day Change: 0.19 | |
| Week Change: -0.09% Year-to-date Change: 100.3% | |
| GLAD Links: Profile News Message Board | |
| Charts:- Daily , Weekly | |
| Add GLAD to Watchlist: View: Get Complete GLAD Trend Analysis ➞ | |
 | BBAR Banco BBVA Argentina S.A. |
| Sector: Financials | |
| SubSector: Foreign Regional Banks | |
| MarketCap: 895.479 Millions | |
| Recent Price: 10.49 Smart Investing & Trading Score: 100 | |
| Day Percent Change: 9.27% Day Change: 0.89 | |
| Week Change: 13.41% Year-to-date Change: 92.8% | |
| BBAR Links: Profile News Message Board | |
| Charts:- Daily , Weekly | |
| Add BBAR to Watchlist: View: Get Complete BBAR Trend Analysis ➞ | |
 | EVER EverQuote, Inc. |
| Sector: Financials | |
| SubSector: Regional - Southeast Banks | |
| MarketCap: 767.135 Millions | |
| Recent Price: 21.75 Smart Investing & Trading Score: 100 | |
| Day Percent Change: 1.02% Day Change: 0.22 | |
| Week Change: 11.25% Year-to-date Change: 77.7% | |
| EVER Links: Profile News Message Board | |
| Charts:- Daily , Weekly | |
| Add EVER to Watchlist: View: Get Complete EVER Trend Analysis ➞ | |
 | SUPV Grupo Supervielle S.A. |
| Sector: Financials | |
| SubSector: Foreign Regional Banks | |
| MarketCap: 224.779 Millions | |
| Recent Price: 6.87 Smart Investing & Trading Score: 100 | |
| Day Percent Change: 5.53% Day Change: 0.36 | |
| Week Change: 13.93% Year-to-date Change: 69.2% | |
| SUPV Links: Profile News Message Board | |
| Charts:- Daily , Weekly | |
| Add SUPV to Watchlist: View: Get Complete SUPV Trend Analysis ➞ | |
 | YRD Yiren Digital Ltd. |
| Sector: Financials | |
| SubSector: Credit Services | |
| MarketCap: 330.208 Millions | |
| Recent Price: 5.21 Smart Investing & Trading Score: 78 | |
| Day Percent Change: -4.40% Day Change: -0.24 | |
| Week Change: 2.56% Year-to-date Change: 67.0% | |
| YRD Links: Profile News Message Board | |
| Charts:- Daily , Weekly | |
| Add YRD to Watchlist: View: Get Complete YRD Trend Analysis ➞ | |
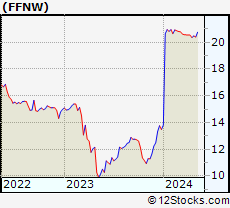 | FFNW First Financial Northwest, Inc. |
| Sector: Financials | |
| SubSector: Regional - Pacific Banks | |
| MarketCap: 102.829 Millions | |
| Recent Price: 20.40 Smart Investing & Trading Score: 37 | |
| Day Percent Change: 0.44% Day Change: 0.09 | |
| Week Change: -0.39% Year-to-date Change: 51.3% | |
| FFNW Links: Profile News Message Board | |
| Charts:- Daily , Weekly | |
| Add FFNW to Watchlist: View: Get Complete FFNW Trend Analysis ➞ | |
 | RILY B. Riley Financial, Inc. |
| Sector: Financials | |
| SubSector: Asset Management | |
| MarketCap: 443.703 Millions | |
| Recent Price: 31.10 Smart Investing & Trading Score: 68 | |
| Day Percent Change: -7.39% Day Change: -2.48 | |
| Week Change: -15.54% Year-to-date Change: 48.2% | |
| RILY Links: Profile News Message Board | |
| Charts:- Daily , Weekly | |
| Add RILY to Watchlist: View: Get Complete RILY Trend Analysis ➞ | |
 | VIST Vista Oil & Gas, S.A.B. de C.V. |
| Sector: Financials | |
| SubSector: Asset Management | |
| MarketCap: 201.603 Millions | |
| Recent Price: 43.20 Smart Investing & Trading Score: 70 | |
| Day Percent Change: 1.72% Day Change: 0.73 | |
| Week Change: 0.37% Year-to-date Change: 46.4% | |
| VIST Links: Profile News Message Board | |
| Charts:- Daily , Weekly | |
| Add VIST to Watchlist: View: Get Complete VIST Trend Analysis ➞ | |
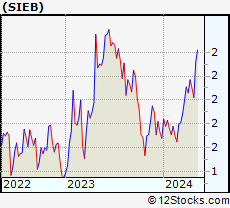 | SIEB Siebert Financial Corp. |
| Sector: Financials | |
| SubSector: Investment Brokerage - Regional | |
| MarketCap: 272.365 Millions | |
| Recent Price: 2.32 Smart Investing & Trading Score: 100 | |
| Day Percent Change: 17.17% Day Change: 0.34 | |
| Week Change: 14.85% Year-to-date Change: 38.1% | |
| SIEB Links: Profile News Message Board | |
| Charts:- Daily , Weekly | |
| Add SIEB to Watchlist: View: Get Complete SIEB Trend Analysis ➞ | |
 | INBK First Internet Bancorp |
| Sector: Financials | |
| SubSector: Regional - Midwest Banks | |
| MarketCap: 149.07 Millions | |
| Recent Price: 32.08 Smart Investing & Trading Score: 85 | |
| Day Percent Change: 1.20% Day Change: 0.38 | |
| Week Change: 3.32% Year-to-date Change: 32.6% | |
| INBK Links: Profile News Message Board | |
| Charts:- Daily , Weekly | |
| Add INBK to Watchlist: View: Get Complete INBK Trend Analysis ➞ | |
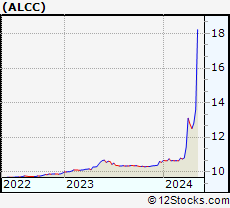 | ALCC AltC Acquisition Corp. |
| Sector: Financials | |
| SubSector: SPAC | |
| MarketCap: 666 Millions | |
| Recent Price: 13.61 Smart Investing & Trading Score: 78 | |
| Day Percent Change: 4.53% Day Change: 0.59 | |
| Week Change: 6.25% Year-to-date Change: 29.1% | |
| ALCC Links: Profile News Message Board | |
| Charts:- Daily , Weekly | |
| Add ALCC to Watchlist: View: Get Complete ALCC Trend Analysis ➞ | |
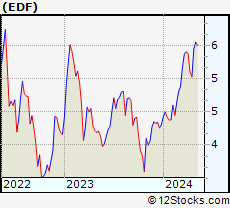 | EDF Stone Harbor Emerging Markets Income Fund |
| Sector: Financials | |
| SubSector: Asset Management | |
| MarketCap: 108.203 Millions | |
| Recent Price: 5.55 Smart Investing & Trading Score: 95 | |
| Day Percent Change: 1.83% Day Change: 0.10 | |
| Week Change: 1.83% Year-to-date Change: 28.8% | |
| EDF Links: Profile News Message Board | |
| Charts:- Daily , Weekly | |
| Add EDF to Watchlist: View: Get Complete EDF Trend Analysis ➞ | |
 | TRTX TPG RE Finance Trust, Inc. |
| Sector: Financials | |
| SubSector: Mortgage Investment | |
| MarketCap: 607.739 Millions | |
| Recent Price: 8.36 Smart Investing & Trading Score: 100 | |
| Day Percent Change: 2.83% Day Change: 0.23 | |
| Week Change: 10.73% Year-to-date Change: 28.6% | |
| TRTX Links: Profile News Message Board | |
| Charts:- Daily , Weekly | |
| Add TRTX to Watchlist: View: Get Complete TRTX Trend Analysis ➞ | |
 | MCBC Macatawa Bank Corporation |
| Sector: Financials | |
| SubSector: Regional - Midwest Banks | |
| MarketCap: 264.37 Millions | |
| Recent Price: 14.42 Smart Investing & Trading Score: 83 | |
| Day Percent Change: 0.84% Day Change: 0.12 | |
| Week Change: 1.26% Year-to-date Change: 27.8% | |
| MCBC Links: Profile News Message Board | |
| Charts:- Daily , Weekly | |
| Add MCBC to Watchlist: View: Get Complete MCBC Trend Analysis ➞ | |
 | HCI HCI Group, Inc. |
| Sector: Financials | |
| SubSector: Property & Casualty Insurance | |
| MarketCap: 297.412 Millions | |
| Recent Price: 110.87 Smart Investing & Trading Score: 41 | |
| Day Percent Change: -0.80% Day Change: -0.89 | |
| Week Change: -3.59% Year-to-date Change: 26.9% | |
| HCI Links: Profile News Message Board | |
| Charts:- Daily , Weekly | |
| Add HCI to Watchlist: View: Get Complete HCI Trend Analysis ➞ | |
 | MLP Maui Land & Pineapple Company, Inc. |
| Sector: Financials | |
| SubSector: Real Estate Development | |
| MarketCap: 186.619 Millions | |
| Recent Price: 20.12 Smart Investing & Trading Score: 73 | |
| Day Percent Change: 0.00% Day Change: 0.00 | |
| Week Change: 1.56% Year-to-date Change: 26.6% | |
| MLP Links: Profile News Message Board | |
| Charts:- Daily , Weekly | |
| Add MLP to Watchlist: View: Get Complete MLP Trend Analysis ➞ | |
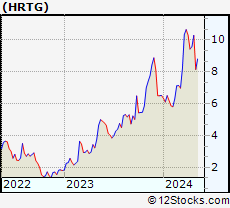 | HRTG Heritage Insurance Holdings, Inc. |
| Sector: Financials | |
| SubSector: Property & Casualty Insurance | |
| MarketCap: 303.312 Millions | |
| Recent Price: 8.15 Smart Investing & Trading Score: 26 | |
| Day Percent Change: 2.26% Day Change: 0.18 | |
| Week Change: -20.8% Year-to-date Change: 25.0% | |
| HRTG Links: Profile News Message Board | |
| Charts:- Daily , Weekly | |
| Add HRTG to Watchlist: View: Get Complete HRTG Trend Analysis ➞ | |
 | UVE Universal Insurance Holdings, Inc. |
| Sector: Financials | |
| SubSector: Property & Casualty Insurance | |
| MarketCap: 616.212 Millions | |
| Recent Price: 19.81 Smart Investing & Trading Score: 37 | |
| Day Percent Change: 0.46% Day Change: 0.09 | |
| Week Change: 1.38% Year-to-date Change: 24.0% | |
| UVE Links: Profile News Message Board | |
| Charts:- Daily , Weekly | |
| Add UVE to Watchlist: View: Get Complete UVE Trend Analysis ➞ | |
 | QFIN 360 Finance, Inc. |
| Sector: Financials | |
| SubSector: Credit Services | |
| MarketCap: 956.208 Millions | |
| Recent Price: 19.50 Smart Investing & Trading Score: 95 | |
| Day Percent Change: -1.91% Day Change: -0.38 | |
| Week Change: 5.29% Year-to-date Change: 23.3% | |
| QFIN Links: Profile News Message Board | |
| Charts:- Daily , Weekly | |
| Add QFIN to Watchlist: View: Get Complete QFIN Trend Analysis ➞ | |
 | COOP Mr. Cooper Group Inc. |
| Sector: Financials | |
| SubSector: Savings & Loans | |
| MarketCap: 648.33 Millions | |
| Recent Price: 80.10 Smart Investing & Trading Score: 83 | |
| Day Percent Change: 1.84% Day Change: 1.45 | |
| Week Change: 1.74% Year-to-date Change: 23.0% | |
| COOP Links: Profile News Message Board | |
| Charts:- Daily , Weekly | |
| Add COOP to Watchlist: View: Get Complete COOP Trend Analysis ➞ | |
 | BLX Banco Latinoamericano de Comercio Exterior, S.A |
| Sector: Financials | |
| SubSector: Foreign Money Center Banks | |
| MarketCap: 390.471 Millions | |
| Recent Price: 30.39 Smart Investing & Trading Score: 85 | |
| Day Percent Change: 1.50% Day Change: 0.45 | |
| Week Change: 2.74% Year-to-date Change: 22.8% | |
| BLX Links: Profile News Message Board | |
| Charts:- Daily , Weekly | |
| Add BLX to Watchlist: View: Get Complete BLX Trend Analysis ➞ | |
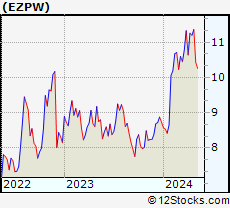 | EZPW EZCORP, Inc. |
| Sector: Financials | |
| SubSector: Credit Services | |
| MarketCap: 236.408 Millions | |
| Recent Price: 10.43 Smart Investing & Trading Score: 13 | |
| Day Percent Change: -1.04% Day Change: -0.11 | |
| Week Change: -8.19% Year-to-date Change: 19.3% | |
| EZPW Links: Profile News Message Board | |
| Charts:- Daily , Weekly | |
| Add EZPW to Watchlist: View: Get Complete EZPW Trend Analysis ➞ | |
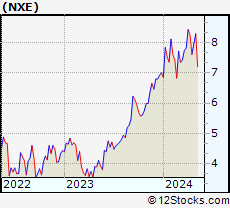 | NXE NexGen Energy Ltd. |
| Sector: Financials | |
| SubSector: Closed-End Fund - Debt | |
| MarketCap: 210.207 Millions | |
| Recent Price: 8.29 Smart Investing & Trading Score: 88 | |
| Day Percent Change: 1.47% Day Change: 0.12 | |
| Week Change: 4.15% Year-to-date Change: 18.4% | |
| NXE Links: Profile News Message Board | |
| Charts:- Daily , Weekly | |
| Add NXE to Watchlist: View: Get Complete NXE Trend Analysis ➞ | |
 | PIPR Piper Sandler Companies |
| Sector: Financials | |
| SubSector: Asset Management | |
| MarketCap: 759.603 Millions | |
| Recent Price: 206.14 Smart Investing & Trading Score: 100 | |
| Day Percent Change: 1.47% Day Change: 2.98 | |
| Week Change: 4.55% Year-to-date Change: 17.9% | |
| PIPR Links: Profile News Message Board | |
| Charts:- Daily , Weekly | |
| Add PIPR to Watchlist: View: Get Complete PIPR Trend Analysis ➞ | |
| For tabular summary view of above stock list: Summary View ➞ 0 - 25 , 25 - 50 , 50 - 75 , 75 - 100 , 100 - 125 , 125 - 150 , 150 - 175 , 175 - 200 , 200 - 225 , 225 - 250 , 250 - 275 , 275 - 300 , 300 - 325 , 325 - 350 , 350 - 375 , 375 - 400 , 400 - 425 , 425 - 450 , 450 - 475 , 475 - 500 , 500 - 525 , 525 - 550 , 550 - 575 , 575 - 600 , 600 - 625 , 625 - 650 , 650 - 675 | ||
| Click To Change The Sort Order: By Market Cap or Company Size Performance: Year-to-date, Week and Day | |
| Select Chart Type: | ||
|
Best Stocks Today 12Stocks.com |
© 2024 12Stocks.com Terms & Conditions Privacy Contact Us
All Information Provided Only For Education And Not To Be Used For Investing or Trading. See Terms & Conditions


One More Thing ... Get Best Stocks Delivered Daily!
Never Ever Miss A Move With Our Top Ten Stocks Lists
Find Best Stocks In Any Market - Bull or Bear Market
Take A Peek At Our Top Ten Stocks Lists: Daily, Weekly, Year-to-Date & Top Trends
Find Best Stocks In Any Market - Bull or Bear Market
Take A Peek At Our Top Ten Stocks Lists: Daily, Weekly, Year-to-Date & Top Trends
Financial Stocks With Best Up Trends [0-bearish to 100-bullish]: Siebert [100], Office Properties[100], Banco BBVA[100], AG Mortgage[100], Grupo Financiero[100], Banco Macro[100], Global X[100], Grupo Supervielle[100], Reinsurance [100], Camden Property[100], Noah [100]
Best Financial Stocks Year-to-Date:
Root [436.68%], Banco Macro[109.83%], Hippo [103.4%], Gladstone Capital[100.28%], Grupo Financiero[98.78%], Banco BBVA[92.83%], EverQuote [77.7%], Grupo Supervielle[69.21%], Yiren Digital[66.99%], LendingTree [62.96%], Lufax Holding[53.09%] Best Financial Stocks This Week:
Office Properties[42.79%], LendingTree [30.37%], SelectQuote [26.71%], Heartland [23.01%], Industrial Logistics[20.39%], New York[18.86%], KE [17.8%], Banco Macro[17.21%], Douglas Elliman[16.39%], Siebert [14.85%], eXp World[14.82%] Best Financial Stocks Daily:
Siebert [17.17%], SelectQuote [13.33%], Office Properties[12.11%], Banco BBVA[9.27%], Oportun [9.01%], AG Mortgage[8.85%], Diversified Healthcare[8.26%], RE/MAX [7.68%], Grupo Financiero[7.62%], Banco Macro[7.32%], Xenia Hotels[7.01%]