
 Login Sign Up


| |||||
 |  | ||||

| 12Stocks.com Market Intelligence |
Best Financial Stocks
| In a hurry? Financial Stocks Lists: Performance Trends Table, Stock Charts
Sort Financial stocks: Daily, Weekly, Year-to-Date, Market Cap & Trends. Filter Financial stocks list by size:All Financial Large Mid-Range Small & MicroCap |
| 12Stocks.com Financial Stocks Performances & Trends Daily | |||||||||
|
|  The overall Smart Investing & Trading Score is 68 (0-bearish to 100-bullish) which puts Financial sector in short term neutral to bullish trend. The Smart Investing & Trading Score from previous trading session is 75 and hence a deterioration of trend.
| ||||||||
Here are the Smart Investing & Trading Scores of the most requested Financial stocks at 12Stocks.com (click stock name for detailed review):
|


| 12Stocks.com: Investing in Financial sector with Stocks | |
|
The following table helps investors and traders sort through current performance and trends (as measured by Smart Investing & Trading Score) of various
stocks in the Financial sector. Quick View: Move mouse or cursor over stock symbol (ticker) to view short-term Technical chart and over stock name to view long term chart. Click on  to add stock symbol to your watchlist and to add stock symbol to your watchlist and  to view watchlist. Click on any ticker or stock name for detailed market intelligence report for that stock. to view watchlist. Click on any ticker or stock name for detailed market intelligence report for that stock. |
12Stocks.com Performance of Stocks in Financial Sector
| Ticker | Stock Name | Watchlist | Category | Recent Price | Smart Investing & Trading Score | Change % | YTD Change% |
| TFSL | TFS |   | Regional Banks | 12.15 | 57 | -1.30% | -17.29% |
| CIM | Chimera | | Mortgage | 4.11 | 42 | -1.20% | -17.64% |
| EXR | Extra Space | | REIT - Industrial | 131.90 | 35 | -2.04% | -17.73% |
| KRC | Kilroy Realty | | REIT - Office | 32.77 | 42 | -2.79% | -17.75% |
| HR | Healthcare Realty | | REIT | 14.16 | 67 | -1.53% | -17.82% |
| CVBF | CVB | | Regional Banks | 16.54 | 100 | -3.22% | -18.08% |
| CWH | Camping World | | REIT - Office | 21.48 | 25 | -5.56% | -18.22% |
| BDN | Brandywine Realty | | REIT - | 4.41 | 74 | -2.33% | -18.43% |
| PUK | Prudential | | Life Insurance | 18.04 | 67 | -3.22% | -19.64% |
| IVZ | Invesco | | Asset Mgmt | 14.29 | 0 | -1.62% | -19.93% |
| BSBR | Banco Santander | | Foreign Banks | 5.22 | 42 | -0.95% | -20.31% |
| AMT | American Tower | | REIT - | 171.74 | 32 | -0.93% | -20.45% |
| BOH | Bank of Hawaii | | Regional Banks | 57.44 | 40 | -2.10% | -20.73% |
| INDB | Independent Bank | | Regional Banks | 51.66 | 74 | -2.39% | -21.51% |
| CATY | Cathay General | | Regional Banks | 34.81 | 34 | -2.03% | -21.90% |
| PLD | Prologis | | REIT - Industrial | 102.02 | 18 | -1.12% | -23.47% |
| BBD | Banco Bradesco | | Foreign Banks | 2.65 | 27 | -0.19% | -24.14% |
| CFFN | Capitol Federal | | S&L | 4.87 | 17 | -5.98% | -24.50% |
| PX | P10 | | Asset Mgmt | 7.51 | 53 | -1.05% | -26.52% |
| BBDO | Banco Bradesco | | Foreign Banks | 2.33 | 27 | 0.00% | -26.89% |
| COLB | Columbia Banking | | S&L | 18.83 | 74 | -1.98% | -29.42% |
| MKTX | MarketAxess | | Brokerage | 202.26 | 28 | -0.96% | -30.93% |
| KW | Kennedy-Wilson | | Property Mgmt | 8.43 | 42 | -0.71% | -31.91% |
| VLY | Valley National | | Regional Banks | 7.38 | 67 | -5.93% | -32.09% |
| EGBN | Eagle Bancorp | | Regional Banks | 18.99 | 67 | -14.61% | -36.99% |
| For chart view version of above stock list: Chart View ➞ 0 - 25 , 25 - 50 , 50 - 75 , 75 - 100 , 100 - 125 , 125 - 150 , 150 - 175 , 175 - 200 , 200 - 225 , 225 - 250 , 250 - 275 , 275 - 300 , 300 - 325 | ||
 | Click To Change The Sort Order: By Market Cap or Company Size Performance: Year-to-date, Week and Day |  |
|
Get the most comprehensive stock market coverage daily at 12Stocks.com ➞ Best Stocks Today ➞ Best Stocks Weekly ➞ Best Stocks Year-to-Date ➞ Best Stocks Trends ➞  Best Stocks Today 12Stocks.com Best Nasdaq Stocks ➞ Best S&P 500 Stocks ➞ Best Tech Stocks ➞ Best Biotech Stocks ➞ |
| Detailed Overview of Financial Stocks |
| Financial Technical Overview, Leaders & Laggards, Top Financial ETF Funds & Detailed Financial Stocks List, Charts, Trends & More |
| Financial Sector: Technical Analysis, Trends & YTD Performance | |
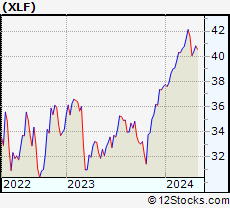
| Financial sector is composed of stocks
from banks, brokers, insurance, REITs
and services subsectors. Financial sector, as represented by XLF, an exchange-traded fund [ETF] that holds basket of Financial stocks (e.g, Bank of America, Goldman Sachs) is up by 7.98% and is currently outperforming the overall market by 4.06% year-to-date. Below is a quick view of Technical charts and trends: |
|
 XLF Weekly Chart |
|
| Long Term Trend: Very Good | |
| Medium Term Trend: Not Good | |
 XLF Daily Chart |
|
| Short Term Trend: Very Good | |
| Overall Trend Score: 68 | |
| YTD Performance: 7.98% | |
| **Trend Scores & Views Are Only For Educational Purposes And Not For Investing | |
| 12Stocks.com: Top Performing Financial Sector Stocks | ||||||||||||||||||||||||||||||||||||||||||||||||
 The top performing Financial sector stocks year to date are
Now, more recently, over last week, the top performing Financial sector stocks on the move are


|
||||||||||||||||||||||||||||||||||||||||||||||||
| 12Stocks.com: Investing in Financial Sector using Exchange Traded Funds | |
|
The following table shows list of key exchange traded funds (ETF) that
help investors track Financial Index. For detailed view, check out our ETF Funds section of our website. Quick View: Move mouse or cursor over ETF symbol (ticker) to view short-term Technical chart and over ETF name to view long term chart. Click on ticker or stock name for detailed view. Click on to add stock symbol to your watchlist and to view watchlist. |
12Stocks.com List of ETFs that track Financial Index
| Ticker | ETF Name | Watchlist | Recent Price | Smart Investing & Trading Score | Change % | Week % | Year-to-date % |
| XLF | Financial | | 40.60 | 68 | -1.26 | 0.54 | 7.98% |
| IAI | Broker-Dealers & Secs | | 111.11 | 75 | -1.59 | 0.07 | 2.38% |
| KBE | Bank | | 45.02 | 100 | -2.03 | 1.38 | -2.16% |
| FAS | Financial Bull 3X | | 100.02 | 68 | -3.08 | 2.13 | 21.02% |
| FAZ | Financial Bear 3X | | 11.01 | 32 | 3.72 | -1.74 | -19.5% |
| UYG | Financials | | 63.61 | 68 | -1.75 | 1.87 | 15.24% |
| KIE | Insurance | | 49.17 | 58 | -1.01 | 0.18 | 8.74% |
| 12Stocks.com: Charts, Trends, Fundamental Data and Performances of Financial Stocks | |
|
We now take in-depth look at all Financial stocks including charts, multi-period performances and overall trends (as measured by Smart Investing & Trading Score). One can sort Financial stocks (click link to choose) by Daily, Weekly and by Year-to-Date performances. Also, one can sort by size of the company or by market capitalization. |
| Select Your Default Chart Type: | |||||
| |||||
| Click on stock symbol or name for detailed view. Click on to add stock symbol to your watchlist and to view watchlist. Quick View: Move mouse or cursor over "Daily" to quickly view daily Technical stock chart and over "Weekly" to view weekly Technical stock chart. | |||||

 | TFSL TFS Financial Corporation |
| Sector: Financials | |
| SubSector: Regional - Midwest Banks | |
| MarketCap: 4539.1 Millions | |
| Recent Price: 12.15 Smart Investing & Trading Score: 57 | |
| Day Percent Change: -1.30% Day Change: -0.16 | |
| Week Change: 0.33% Year-to-date Change: -17.3% | |
| TFSL Links: Profile News Message Board | |
| Charts:- Daily , Weekly | |
| Add TFSL to Watchlist: View: Get Complete TFSL Trend Analysis ➞ | |
 | CIM Chimera Investment Corporation |
| Sector: Financials | |
| SubSector: Mortgage Investment | |
| MarketCap: 2164.09 Millions | |
| Recent Price: 4.11 Smart Investing & Trading Score: 42 | |
| Day Percent Change: -1.20% Day Change: -0.05 | |
| Week Change: 0% Year-to-date Change: -17.6% | |
| CIM Links: Profile News Message Board | |
| Charts:- Daily , Weekly | |
| Add CIM to Watchlist: View: Get Complete CIM Trend Analysis ➞ | |
 | EXR Extra Space Storage Inc. |
| Sector: Financials | |
| SubSector: REIT - Industrial | |
| MarketCap: 11203.9 Millions | |
| Recent Price: 131.90 Smart Investing & Trading Score: 35 | |
| Day Percent Change: -2.04% Day Change: -2.74 | |
| Week Change: -0.42% Year-to-date Change: -17.7% | |
| EXR Links: Profile News Message Board | |
| Charts:- Daily , Weekly | |
| Add EXR to Watchlist: View: Get Complete EXR Trend Analysis ➞ | |
 | KRC Kilroy Realty Corporation |
| Sector: Financials | |
| SubSector: REIT - Office | |
| MarketCap: 6390.46 Millions | |
| Recent Price: 32.77 Smart Investing & Trading Score: 42 | |
| Day Percent Change: -2.79% Day Change: -0.94 | |
| Week Change: -0.97% Year-to-date Change: -17.8% | |
| KRC Links: Profile News Message Board | |
| Charts:- Daily , Weekly | |
| Add KRC to Watchlist: View: Get Complete KRC Trend Analysis ➞ | |
 | HR Healthcare Realty Trust Incorporated |
| Sector: Financials | |
| SubSector: REIT - Healthcare Facilities | |
| MarketCap: 3718.84 Millions | |
| Recent Price: 14.16 Smart Investing & Trading Score: 67 | |
| Day Percent Change: -1.53% Day Change: -0.22 | |
| Week Change: 1.43% Year-to-date Change: -17.8% | |
| HR Links: Profile News Message Board | |
| Charts:- Daily , Weekly | |
| Add HR to Watchlist: View: Get Complete HR Trend Analysis ➞ | |
 | CVBF CVB Financial Corp. |
| Sector: Financials | |
| SubSector: Regional - Pacific Banks | |
| MarketCap: 2699.99 Millions | |
| Recent Price: 16.54 Smart Investing & Trading Score: 100 | |
| Day Percent Change: -3.22% Day Change: -0.55 | |
| Week Change: -0.54% Year-to-date Change: -18.1% | |
| CVBF Links: Profile News Message Board | |
| Charts:- Daily , Weekly | |
| Add CVBF to Watchlist: View: Get Complete CVBF Trend Analysis ➞ | |
 | CWH Camping World Holdings, Inc. |
| Sector: Financials | |
| SubSector: REIT - Office | |
| MarketCap: 473.566 Millions | |
| Recent Price: 21.48 Smart Investing & Trading Score: 25 | |
| Day Percent Change: -5.56% Day Change: -1.26 | |
| Week Change: -3.83% Year-to-date Change: -18.2% | |
| CWH Links: Profile News Message Board | |
| Charts:- Daily , Weekly | |
| Add CWH to Watchlist: View: Get Complete CWH Trend Analysis ➞ | |
 | BDN Brandywine Realty Trust |
| Sector: Financials | |
| SubSector: REIT - Diversified | |
| MarketCap: 1688.13 Millions | |
| Recent Price: 4.41 Smart Investing & Trading Score: 74 | |
| Day Percent Change: -2.33% Day Change: -0.10 | |
| Week Change: 0.57% Year-to-date Change: -18.4% | |
| BDN Links: Profile News Message Board | |
| Charts:- Daily , Weekly | |
| Add BDN to Watchlist: View: Get Complete BDN Trend Analysis ➞ | |
 | PUK Prudential plc |
| Sector: Financials | |
| SubSector: Life Insurance | |
| MarketCap: 28247.4 Millions | |
| Recent Price: 18.04 Smart Investing & Trading Score: 67 | |
| Day Percent Change: -3.22% Day Change: -0.60 | |
| Week Change: -0.5% Year-to-date Change: -19.6% | |
| PUK Links: Profile News Message Board | |
| Charts:- Daily , Weekly | |
| Add PUK to Watchlist: View: Get Complete PUK Trend Analysis ➞ | |
 | IVZ Invesco Ltd. |
| Sector: Financials | |
| SubSector: Asset Management | |
| MarketCap: 4578.23 Millions | |
| Recent Price: 14.29 Smart Investing & Trading Score: 0 | |
| Day Percent Change: -1.62% Day Change: -0.23 | |
| Week Change: -7.06% Year-to-date Change: -19.9% | |
| IVZ Links: Profile News Message Board | |
| Charts:- Daily , Weekly | |
| Add IVZ to Watchlist: View: Get Complete IVZ Trend Analysis ➞ | |
 | BSBR Banco Santander (Brasil) S.A. |
| Sector: Financials | |
| SubSector: Foreign Regional Banks | |
| MarketCap: 21961.4 Millions | |
| Recent Price: 5.22 Smart Investing & Trading Score: 42 | |
| Day Percent Change: -0.95% Day Change: -0.05 | |
| Week Change: -0.57% Year-to-date Change: -20.3% | |
| BSBR Links: Profile News Message Board | |
| Charts:- Daily , Weekly | |
| Add BSBR to Watchlist: View: Get Complete BSBR Trend Analysis ➞ | |
 | AMT American Tower Corporation (REIT) |
| Sector: Financials | |
| SubSector: REIT - Diversified | |
| MarketCap: 92527 Millions | |
| Recent Price: 171.74 Smart Investing & Trading Score: 32 | |
| Day Percent Change: -0.93% Day Change: -1.61 | |
| Week Change: 0.26% Year-to-date Change: -20.5% | |
| AMT Links: Profile News Message Board | |
| Charts:- Daily , Weekly | |
| Add AMT to Watchlist: View: Get Complete AMT Trend Analysis ➞ | |
 | BOH Bank of Hawaii Corporation |
| Sector: Financials | |
| SubSector: Regional - Pacific Banks | |
| MarketCap: 2305.19 Millions | |
| Recent Price: 57.44 Smart Investing & Trading Score: 40 | |
| Day Percent Change: -2.10% Day Change: -1.23 | |
| Week Change: -1.64% Year-to-date Change: -20.7% | |
| BOH Links: Profile News Message Board | |
| Charts:- Daily , Weekly | |
| Add BOH to Watchlist: View: Get Complete BOH Trend Analysis ➞ | |
 | INDB Independent Bank Corp. |
| Sector: Financials | |
| SubSector: Regional - Northeast Banks | |
| MarketCap: 2347.09 Millions | |
| Recent Price: 51.66 Smart Investing & Trading Score: 74 | |
| Day Percent Change: -2.39% Day Change: -1.27 | |
| Week Change: 2.17% Year-to-date Change: -21.5% | |
| INDB Links: Profile News Message Board | |
| Charts:- Daily , Weekly | |
| Add INDB to Watchlist: View: Get Complete INDB Trend Analysis ➞ | |
 | CATY Cathay General Bancorp |
| Sector: Financials | |
| SubSector: Regional - Pacific Banks | |
| MarketCap: 1781.99 Millions | |
| Recent Price: 34.81 Smart Investing & Trading Score: 34 | |
| Day Percent Change: -2.03% Day Change: -0.72 | |
| Week Change: -3.31% Year-to-date Change: -21.9% | |
| CATY Links: Profile News Message Board | |
| Charts:- Daily , Weekly | |
| Add CATY to Watchlist: View: Get Complete CATY Trend Analysis ➞ | |
 | PLD Prologis, Inc. |
| Sector: Financials | |
| SubSector: REIT - Industrial | |
| MarketCap: 48728.9 Millions | |
| Recent Price: 102.02 Smart Investing & Trading Score: 18 | |
| Day Percent Change: -1.12% Day Change: -1.16 | |
| Week Change: -1.42% Year-to-date Change: -23.5% | |
| PLD Links: Profile News Message Board | |
| Charts:- Daily , Weekly | |
| Add PLD to Watchlist: View: Get Complete PLD Trend Analysis ➞ | |
 | BBD Banco Bradesco S.A. |
| Sector: Financials | |
| SubSector: Foreign Regional Banks | |
| MarketCap: 30281.7 Millions | |
| Recent Price: 2.65 Smart Investing & Trading Score: 27 | |
| Day Percent Change: -0.19% Day Change: -0.01 | |
| Week Change: 0.57% Year-to-date Change: -24.1% | |
| BBD Links: Profile News Message Board | |
| Charts:- Daily , Weekly | |
| Add BBD to Watchlist: View: Get Complete BBD Trend Analysis ➞ | |
 | CFFN Capitol Federal Financial, Inc. |
| Sector: Financials | |
| SubSector: Savings & Loans | |
| MarketCap: 1639.1 Millions | |
| Recent Price: 4.87 Smart Investing & Trading Score: 17 | |
| Day Percent Change: -5.98% Day Change: -0.31 | |
| Week Change: -7.77% Year-to-date Change: -24.5% | |
| CFFN Links: Profile News Message Board | |
| Charts:- Daily , Weekly | |
| Add CFFN to Watchlist: View: Get Complete CFFN Trend Analysis ➞ | |
 | PX P10, Inc. |
| Sector: Financials | |
| SubSector: Asset Management | |
| MarketCap: 1300 Millions | |
| Recent Price: 7.51 Smart Investing & Trading Score: 53 | |
| Day Percent Change: -1.05% Day Change: -0.08 | |
| Week Change: 0.27% Year-to-date Change: -26.5% | |
| PX Links: Profile News Message Board | |
| Charts:- Daily , Weekly | |
| Add PX to Watchlist: View: Get Complete PX Trend Analysis ➞ | |
 | BBDO Banco Bradesco S.A. |
| Sector: Financials | |
| SubSector: Foreign Regional Banks | |
| MarketCap: 27711.4 Millions | |
| Recent Price: 2.33 Smart Investing & Trading Score: 27 | |
| Day Percent Change: 0.00% Day Change: 0.00 | |
| Week Change: -0.21% Year-to-date Change: -26.9% | |
| BBDO Links: Profile News Message Board | |
| Charts:- Daily , Weekly | |
| Add BBDO to Watchlist: View: Get Complete BBDO Trend Analysis ➞ | |
 | COLB Columbia Banking System, Inc. |
| Sector: Financials | |
| SubSector: Savings & Loans | |
| MarketCap: 1868.3 Millions | |
| Recent Price: 18.83 Smart Investing & Trading Score: 74 | |
| Day Percent Change: -1.98% Day Change: -0.38 | |
| Week Change: 2.84% Year-to-date Change: -29.4% | |
| COLB Links: Profile News Message Board | |
| Charts:- Daily , Weekly | |
| Add COLB to Watchlist: View: Get Complete COLB Trend Analysis ➞ | |
 | MKTX MarketAxess Holdings Inc. |
| Sector: Financials | |
| SubSector: Investment Brokerage - National | |
| MarketCap: 12431.5 Millions | |
| Recent Price: 202.26 Smart Investing & Trading Score: 28 | |
| Day Percent Change: -0.96% Day Change: -1.96 | |
| Week Change: -0.86% Year-to-date Change: -30.9% | |
| MKTX Links: Profile News Message Board | |
| Charts:- Daily , Weekly | |
| Add MKTX to Watchlist: View: Get Complete MKTX Trend Analysis ➞ | |
 | KW Kennedy-Wilson Holdings, Inc. |
| Sector: Financials | |
| SubSector: Property Management | |
| MarketCap: 2025.42 Millions | |
| Recent Price: 8.43 Smart Investing & Trading Score: 42 | |
| Day Percent Change: -0.71% Day Change: -0.06 | |
| Week Change: -0.82% Year-to-date Change: -31.9% | |
| KW Links: Profile News Message Board | |
| Charts:- Daily , Weekly | |
| Add KW to Watchlist: View: Get Complete KW Trend Analysis ➞ | |
 | VLY Valley National Bancorp |
| Sector: Financials | |
| SubSector: Regional - Northeast Banks | |
| MarketCap: 2843.09 Millions | |
| Recent Price: 7.38 Smart Investing & Trading Score: 67 | |
| Day Percent Change: -5.93% Day Change: -0.46 | |
| Week Change: -4.35% Year-to-date Change: -32.1% | |
| VLY Links: Profile News Message Board | |
| Charts:- Daily , Weekly | |
| Add VLY to Watchlist: View: Get Complete VLY Trend Analysis ➞ | |
 | EGBN Eagle Bancorp, Inc. |
| Sector: Financials | |
| SubSector: Regional - Mid-Atlantic Banks | |
| MarketCap: 906.559 Millions | |
| Recent Price: 18.99 Smart Investing & Trading Score: 67 | |
| Day Percent Change: -14.61% Day Change: -3.25 | |
| Week Change: -12.16% Year-to-date Change: -37.0% | |
| EGBN Links: Profile News Message Board | |
| Charts:- Daily , Weekly | |
| Add EGBN to Watchlist: View: Get Complete EGBN Trend Analysis ➞ | |
| For tabular summary view of above stock list: Summary View ➞ 0 - 25 , 25 - 50 , 50 - 75 , 75 - 100 , 100 - 125 , 125 - 150 , 150 - 175 , 175 - 200 , 200 - 225 , 225 - 250 , 250 - 275 , 275 - 300 , 300 - 325 | ||
| Click To Change The Sort Order: By Market Cap or Company Size Performance: Year-to-date, Week and Day | |
| Select Chart Type: | ||
|
Best Stocks Today 12Stocks.com |
© 2024 12Stocks.com Terms & Conditions Privacy Contact Us
All Information Provided Only For Education And Not To Be Used For Investing or Trading. See Terms & Conditions


One More Thing ... Get Best Stocks Delivered Daily!
Never Ever Miss A Move With Our Top Ten Stocks Lists
Find Best Stocks In Any Market - Bull or Bear Market
Take A Peek At Our Top Ten Stocks Lists: Daily, Weekly, Year-to-Date & Top Trends
Find Best Stocks In Any Market - Bull or Bear Market
Take A Peek At Our Top Ten Stocks Lists: Daily, Weekly, Year-to-Date & Top Trends
Financial Stocks With Best Up Trends [0-bearish to 100-bullish]: Trustmark [100], Virtu [100], UDR [100], Main Street[100], Ares Capital[100], Equity Residential[100], AvalonBay Communities[100], M&T Bank[100], Essex Property[100], Highwoods Properties[100], RLI [100]
Best Financial Stocks Year-to-Date:
Banco Macro[71.22%], Grupo Financiero[67.39%], EverQuote [51.55%], Mercury General[46.02%], Interactive Brokers[39.53%], GEO [35.36%], Progressive [31.92%], Barclays [29.76%], Deutsche Bank[29.74%], Nomura [27.83%], American Express[26.03%] Best Financial Stocks This Week:
Trustmark [11.28%], Deutsche Bank[10.5%], First Citizens[10.36%], Barclays [9.36%], KB [7.21%], CoStar [6.64%], Tanger Factory[6.37%], Synchrony [5.87%], Highwoods Properties[5.87%], Prosperity Bancshares[5.36%], Banco Santander[4.95%] Best Financial Stocks Daily:
Deutsche Bank[6.67%], Barclays [6.51%], First Citizens[5.49%], CME [1.48%], Trustmark [1.31%], Virtu [0.82%], Cboe Global[0.72%], India Fund[0.57%], ICICI Bank[0.57%], W. R.[0.42%], Banco Macro[0.33%]