
 Login Sign Up


| |||||
 |  | ||||

| 12Stocks.com Market Intelligence |
Best Europe Stocks
|
On this page, you will find the most comprehensive analysis of European stocks and ETFs - from latest trends to performances to charts ➞. First, here are the year-to-date (YTD) performances of the most requested Europe stocks at 12Stocks.com (click stock for review):
| Deutsche Bank 119% | ||
| British American 58% | ||
| HSBC 47% | ||
| UBS 43% | ||
| Novartis AG 31% | ||
| ASML Holding 26% | ||
| GSK 21% | ||
| Astrazeneca 20% | ||
| BP 19% | ||
| Fresenius Medical 18% | ||
| Koninklijke Philips 16% | ||
| Sap SE 5% | ||
| ABB 0% | ||
| Credit Suisse 0% | ||
| LionShares U.S. 0% | ||
| Unilever 0% | ||
| Transocean -12% | ||
| Diageo -19% | ||
| In a hurry? Europe Stocks Lists: Performance Trends Table, Stock Charts
Sort Europe stocks: Daily, Weekly, Year-to-Date, Market Cap & Trends. Filter Europe stocks list by sector: Show all, Tech, Finance, Energy, Staples, Retail, Industrial, Materials, Utilities and HealthCare Filter Europe stocks list by size:All Europe Large Medium Small and MicroCap |
| 12Stocks.com Europe Stocks Performances & Trends Daily | |||||||||
|
|  The overall Smart Investing & Trading Score is 90 (0-bearish to 100-bullish) which puts Europe index in short term bullish trend. The Smart Investing & Trading Score from previous trading session is 100 and hence a deterioration of trend.
| ||||||||
Here are the Smart Investing & Trading Scores of the most requested Europe stocks at 12Stocks.com (click stock name for detailed review):
|


| 12Stocks.com: Top Performing Europe Index Stocks | ||||||||||||||||||||||||||||||||||||||||||||||||
 The top performing Europe Index stocks year to date are
Now, more recently, over last week, the top performing Europe Index stocks on the move are


|
||||||||||||||||||||||||||||||||||||||||||||||||
| 12Stocks.com: Investing in Europe Index with Stocks | |
|
The following table helps investors and traders sort through current performance and trends (as measured by Smart Investing & Trading Score) of various
stocks in the Europe Index. Quick View: Move mouse or cursor over stock symbol (ticker) to view short-term technical chart and over stock name to view long term chart. Click on  to add stock symbol to your watchlist and to add stock symbol to your watchlist and  to view watchlist. Click on any ticker or stock name for detailed market intelligence report for that stock. to view watchlist. Click on any ticker or stock name for detailed market intelligence report for that stock. |
12Stocks.com Performance of Stocks in Europe Index
| Ticker | Stock Name | Watchlist | Category | Recent Price | Smart Investing & Trading Score | Change % | YTD Change% |
| EDAP | EDAP TMS |   | Health Care | 2.33 | 50 | -3.32% | -2.92% |
| NEON | Neonode | | Technology | 4.10 | 10 | 2.24% | -50.72% |
| EDTX | EdtechX | | Industrials | 63.24 | 30 | 0.00% | 0.00% |
| ERYP | ERYTECH Pharma | | Health Care | 0.79 | 20 | 0.00% | 0.00% |
| TRVG | Trivago NV | | Technology | 3.37 | 60 | 0.00% | 46.52% |
| MAMS | MAM Software | | Technology | 24.96 | 70 | -0.40% | 0.00% |
| AXGT | Axovant Gene | | Health Care | 5.53 | 20 | 1.28% | 0.00% |
| CH | Aberdeen Chile | | Financials | 0.02 | 20 | -20.00% | 0.00% |
| VVPR | VivoPower | | Technology | 4.97 | 30 | 0.20% | 252.48% |
| AMTD | AMTD IDEA | | Financials | 1.25 | 90 | 3.31% | 3.31% |
| SQNS | Sequans | | Technology | 0.96 | 50 | -0.24% | -72.73% |
| VJET | voxeljet AG | | Technology | 4.94 | 80 | 1.23% | 0.00% |
| APM | Aptorum | | Health Care | 1.85 | 40 | -5.61% | -15.91% |
| ADAP | Adaptimmune | | Health Care | 0.08 | 80 | 22.82% | -86.88% |
| ADXN | Addex | | Health Care | 9.36 | 50 | -2.70% | 24.12% |
| NCNA | NuCana | | Health Care | 4.42 | 70 | -1.78% | -98.22% |
| For chart view version of above stock list: Chart View ➞ 0 - 25 | ||
 | Click To Change The Sort Order: By Market Cap or Company Size Performance: Year-to-date, Week and Day |  |
|
Get the most comprehensive stock market coverage daily at 12Stocks.com ➞ Best Stocks Today ➞ Best Stocks Weekly ➞ Best Stocks Year-to-Date ➞ Best Stocks Trends ➞  Best Stocks Today 12Stocks.com Best Nasdaq Stocks ➞ Best S&P 500 Stocks ➞ Best Tech Stocks ➞ Best Biotech Stocks ➞ |
| Detailed Overview of Europe Stocks |
| Europe Technical Overview, Leaders & Laggards, Top Europe ETF Funds & Detailed Europe Stocks List, Charts, Trends & More |
| Europe: Technical Analysis, Trends & YTD Performance | |
 IEV Weekly Chart |
|
| Long Term Trend: Very Good | |
| Medium Term Trend: Very Good | |
 IEV Daily Chart |
|
| Short Term Trend: Very Good | |
| Overall Trend Score: 90 | |
| YTD Performance: 27.7064% | |
| **Trend Scores & Views Are Only For Educational Purposes And Not For Investing | |
| 12Stocks.com: Investing in Europe Index using Exchange Traded Funds | |
|
The following table shows list of key exchange traded funds (ETF) that
help investors play Europe stock market. For detailed view, check out our ETF Funds section of our website. Quick View: Move mouse or cursor over ETF symbol (ticker) to view short-term technical chart and over ETF name to view long term chart. Click on ticker or stock name for detailed view. Click on to add stock symbol to your watchlist and to view watchlist. |
12Stocks.com List of ETFs that track Europe Index
| Ticker | ETF Name | Watchlist | Recent Price | Smart Investing & Trading Score | Change % | Week % | Year-to-date % |
| FEU | Europe 50 | | 50.11 | 90 | 1.54002 | 4.63562 | 26.3171% |
| EUSC | Europe Hedged SmallCap | | 48.87 | 90 | 2.52507 | 4.7807 | 28.0278% |
| QESP | Spain StrategicFactors | | 38.26 | 36 | 0 | 9999 | NA |
| 12Stocks.com: Charts, Trends, Fundamental Data and Performances of Europe Stocks | |
|
We now take in-depth look at all Europe stocks including charts, multi-period performances and overall trends (as measured by Smart Investing & Trading Score). One can sort Europe stocks (click link to choose) by Daily, Weekly and by Year-to-Date performances. Also, one can sort by size of the company or by market capitalization. |
| Select Your Default Chart Type: | |||||
| |||||
| Click on stock symbol or name for detailed view. Click on to add stock symbol to your watchlist and to view watchlist. Quick View: Move mouse or cursor over "Daily" to quickly view daily technical stock chart and over "Weekly" to view weekly technical stock chart. | |||||

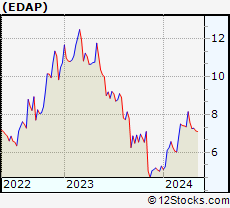 | EDAP EDAP TMS S.A. ADR |
| Sector: Health Care | |
| SubSector: Medical Distribution | |
| MarketCap: 94.22 Millions | |
| Recent Price: 2.33 Smart Investing & Trading Score: 50 | |
| Day Percent Change: -3.3195% Day Change: -0.03 | |
| Week Change: -7.53968% Year-to-date Change: -2.9% | |
| EDAP Links: Profile News Message Board | |
| Charts:- Daily , Weekly | |
| Add EDAP to Watchlist: View: Get Complete EDAP Trend Analysis ➞ | |
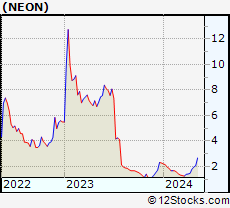 | NEON Neonode Inc |
| Sector: Technology | |
| SubSector: Electronic Components | |
| MarketCap: 85.76 Millions | |
| Recent Price: 4.10 Smart Investing & Trading Score: 10 | |
| Day Percent Change: 2.24439% Day Change: 0.9 | |
| Week Change: -15.4639% Year-to-date Change: -50.7% | |
| NEON Links: Profile News Message Board | |
| Charts:- Daily , Weekly | |
| Add NEON to Watchlist: View: Get Complete NEON Trend Analysis ➞ | |
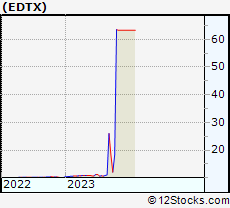 | EDTX EdtechX Holdings Acquisition Corp. |
| Sector: Industrials | |
| SubSector: Conglomerates | |
| MarketCap: 80.7848 Millions | |
| Recent Price: 63.24 Smart Investing & Trading Score: 30 | |
| Day Percent Change: 0% Day Change: -9999 | |
| Week Change: 0% Year-to-date Change: 0.0% | |
| EDTX Links: Profile News Message Board | |
| Charts:- Daily , Weekly | |
| Add EDTX to Watchlist: View: Get Complete EDTX Trend Analysis ➞ | |
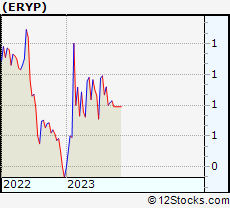 | ERYP ERYTECH Pharma S.A. |
| Sector: Health Care | |
| SubSector: Biotechnology | |
| MarketCap: 76.5785 Millions | |
| Recent Price: 0.79 Smart Investing & Trading Score: 20 | |
| Day Percent Change: 0% Day Change: -9999 | |
| Week Change: 0% Year-to-date Change: 0.0% | |
| ERYP Links: Profile News Message Board | |
| Charts:- Daily , Weekly | |
| Add ERYP to Watchlist: View: Get Complete ERYP Trend Analysis ➞ | |
 | TRVG Trivago NV ADR |
| Sector: Technology | |
| SubSector: Internet Content & Information | |
| MarketCap: 76.19 Millions | |
| Recent Price: 3.37 Smart Investing & Trading Score: 60 | |
| Day Percent Change: 0% Day Change: -0.04 | |
| Week Change: 3.69231% Year-to-date Change: 46.5% | |
| TRVG Links: Profile News Message Board | |
| Charts:- Daily , Weekly | |
| Add TRVG to Watchlist: View: Get Complete TRVG Trend Analysis ➞ | |
 | MAMS MAM Software Group, Inc. |
| Sector: Technology | |
| SubSector: Business Software & Services | |
| MarketCap: 76.07 Millions | |
| Recent Price: 24.96 Smart Investing & Trading Score: 70 | |
| Day Percent Change: -0.399042% Day Change: -9999 | |
| Week Change: 74.5455% Year-to-date Change: 0.0% | |
| MAMS Links: Profile News Message Board | |
| Charts:- Daily , Weekly | |
| Add MAMS to Watchlist: View: Get Complete MAMS Trend Analysis ➞ | |
 | AXGT Axovant Gene Therapies Ltd. |
| Sector: Health Care | |
| SubSector: Biotechnology | |
| MarketCap: 75.7785 Millions | |
| Recent Price: 5.53 Smart Investing & Trading Score: 20 | |
| Day Percent Change: 1.28205% Day Change: -9999 | |
| Week Change: -23.8292% Year-to-date Change: 0.0% | |
| AXGT Links: Profile News Message Board | |
| Charts:- Daily , Weekly | |
| Add AXGT to Watchlist: View: Get Complete AXGT Trend Analysis ➞ | |
 | CH Aberdeen Chile Fund, Inc. |
| Sector: Financials | |
| SubSector: Asset Management | |
| MarketCap: 62.05 Millions | |
| Recent Price: 0.02 Smart Investing & Trading Score: 20 | |
| Day Percent Change: -20% Day Change: -9999 | |
| Week Change: 33.3333% Year-to-date Change: 0.0% | |
| CH Links: Profile News Message Board | |
| Charts:- Daily , Weekly | |
| Add CH to Watchlist: View: Get Complete CH Trend Analysis ➞ | |
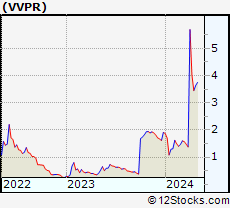 | VVPR VivoPower International PLC |
| Sector: Technology | |
| SubSector: Solar | |
| MarketCap: 48.49 Millions | |
| Recent Price: 4.97 Smart Investing & Trading Score: 30 | |
| Day Percent Change: 0.201613% Day Change: -0.06 | |
| Week Change: 0% Year-to-date Change: 252.5% | |
| VVPR Links: Profile News Message Board | |
| Charts:- Daily , Weekly | |
| Add VVPR to Watchlist: View: Get Complete VVPR Trend Analysis ➞ | |
 | AMTD AMTD IDEA Group ADR |
| Sector: Financials | |
| SubSector: Asset Management | |
| MarketCap: 41.27 Millions | |
| Recent Price: 1.25 Smart Investing & Trading Score: 90 | |
| Day Percent Change: 3.30579% Day Change: 0.04 | |
| Week Change: 20.1923% Year-to-date Change: 3.3% | |
| AMTD Links: Profile News Message Board | |
| Charts:- Daily , Weekly | |
| Add AMTD to Watchlist: View: Get Complete AMTD Trend Analysis ➞ | |
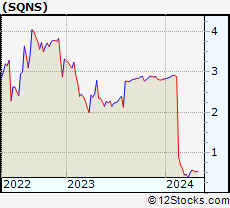 | SQNS Sequans Communications S.A ADR |
| Sector: Technology | |
| SubSector: Semiconductors | |
| MarketCap: 21.98 Millions | |
| Recent Price: 0.96 Smart Investing & Trading Score: 50 | |
| Day Percent Change: -0.239011% Day Change: -0.04 | |
| Week Change: 12.2807% Year-to-date Change: -72.7% | |
| SQNS Links: Profile News Message Board | |
| Charts:- Daily , Weekly | |
| Add SQNS to Watchlist: View: Get Complete SQNS Trend Analysis ➞ | |
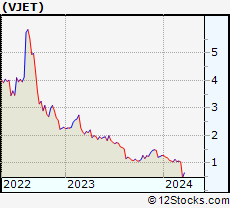 | VJET voxeljet AG |
| Sector: Technology | |
| SubSector: Computer Peripherals | |
| MarketCap: 18.0989 Millions | |
| Recent Price: 4.94 Smart Investing & Trading Score: 80 | |
| Day Percent Change: 1.22951% Day Change: -9999 | |
| Week Change: 744.444% Year-to-date Change: 0.0% | |
| VJET Links: Profile News Message Board | |
| Charts:- Daily , Weekly | |
| Add VJET to Watchlist: View: Get Complete VJET Trend Analysis ➞ | |
 | APM Aptorum Group Ltd |
| Sector: Health Care | |
| SubSector: Biotechnology | |
| MarketCap: 13.22 Millions | |
| Recent Price: 1.85 Smart Investing & Trading Score: 40 | |
| Day Percent Change: -5.61225% Day Change: 2.98 | |
| Week Change: 8.18713% Year-to-date Change: -15.9% | |
| APM Links: Profile News Message Board | |
| Charts:- Daily , Weekly | |
| Add APM to Watchlist: View: Get Complete APM Trend Analysis ➞ | |
 | ADAP Adaptimmune Therapeutics Plc ADR |
| Sector: Health Care | |
| SubSector: Biotechnology | |
| MarketCap: 10.87 Millions | |
| Recent Price: 0.08 Smart Investing & Trading Score: 80 | |
| Day Percent Change: 22.8228% Day Change: 0 | |
| Week Change: 92.4706% Year-to-date Change: -86.9% | |
| ADAP Links: Profile News Message Board | |
| Charts:- Daily , Weekly | |
| Add ADAP to Watchlist: View: Get Complete ADAP Trend Analysis ➞ | |
 | ADXN Addex Therapeutics Ltd ADR |
| Sector: Health Care | |
| SubSector: Biotechnology | |
| MarketCap: 6.37 Millions | |
| Recent Price: 9.36 Smart Investing & Trading Score: 50 | |
| Day Percent Change: -2.7027% Day Change: -9999 | |
| Week Change: 18.481% Year-to-date Change: 24.1% | |
| ADXN Links: Profile News Message Board | |
| Charts:- Daily , Weekly | |
| Add ADXN to Watchlist: View: Get Complete ADXN Trend Analysis ➞ | |
 | NCNA NuCana plc ADR |
| Sector: Health Care | |
| SubSector: Biotechnology | |
| MarketCap: 5.48 Millions | |
| Recent Price: 4.42 Smart Investing & Trading Score: 70 | |
| Day Percent Change: -1.77778% Day Change: 0.2 | |
| Week Change: 52.9412% Year-to-date Change: -98.2% | |
| NCNA Links: Profile News Message Board | |
| Charts:- Daily , Weekly | |
| Add NCNA to Watchlist: View: Get Complete NCNA Trend Analysis ➞ | |
| For tabular summary view of above stock list: Summary View ➞ 0 - 25 | ||
| Click To Change The Sort Order: By Market Cap or Company Size Performance: Year-to-date, Week and Day | |
| Select Chart Type: | ||
|
Best Stocks Today 12Stocks.com |
© 2025 12Stocks.com Terms & Conditions Privacy Contact Us
All Information Provided Only For Education And Not To Be Used For Investing or Trading. See Terms & Conditions


One More Thing ... Get Best Stocks Delivered Daily!
Never Ever Miss A Move With Our Top Ten Stocks Lists
Find Best Stocks In Any Market - Bull or Bear Market
Take A Peek At Our Top Ten Stocks Lists: Daily, Weekly, Year-to-Date & Top Trends
Find Best Stocks In Any Market - Bull or Bear Market
Take A Peek At Our Top Ten Stocks Lists: Daily, Weekly, Year-to-Date & Top Trends
Europe Stocks With Best Up Trends [0-bearish to 100-bullish]: Jumia [100], Transocean [100], Super [100], AC Immune[100], Logitech [100], Seadrill Partners[100], Weatherford [100], ASML Holding[100], Ensco [100], Genfit ADR[100], ECARX [90]
Best Europe Stocks Year-to-Date:
Nanobiotix ADR[235.872%], Jumia [204.615%], DBV [202.769%], ATAI Life[190.625%], AngloGold Ashanti[176.152%], Inventiva ADR[148.598%], Tiziana Life[145.3%], Verona Pharma[120.477%], IHS Holding[119.811%], Deutsche Bank[118.601%], Super [110.843%] Best Europe Stocks This Week:
Credit Suisse[63241.6%], Yandex N.V[2935.27%], Quotient [1782.35%], Weatherford [461.518%], ROYAL DTCH[232.805%], Chicago Bridge[205.472%], Advanced Accelerator[82.7231%], Seadrill Partners[56.1198%], ROYAL DTCH[49.5206%], Ensco [45.9434%], Centessa [35.6008%] Best Europe Stocks Daily:
Jumia [21.3483%], ECARX [12.6374%], DBV [9.74794%], CRISPR [5.79184%], Cellectis ADR[5.68562%], Evotec SE[5.42857%], Transocean [4.83384%], Polestar Automotive[4.69%], Nanobiotix ADR[4.5119%], Forafric Global[3.95683%], Adc [3.4375%]