
 Login Sign Up


| |||||
 |  | ||||

| 12Stocks.com Market Intelligence |
Best SmallCap Stocks
|
| In a hurry? Small Cap Stock Lists: Performance Trends Table, Stock Charts
Sort Small Cap stocks: Daily, Weekly, Year-to-Date, Market Cap & Trends. Filter Small Cap stocks list by sector: Show all, Tech, Finance, Energy, Staples, Retail, Industrial, Materials, Utilities and HealthCare Filter Small Cap stocks list by size: All Large Medium Small and MicroCap |
| 12Stocks.com Small Cap Stocks Performances & Trends Daily | |||||||||
|
|  The overall Smart Investing & Trading Score is 76 (0-bearish to 100-bullish) which puts Small Cap index in short term neutral to bullish trend. The Smart Investing & Trading Score from previous trading session is 90 and hence a deterioration of trend.
| ||||||||
Here are the Smart Investing & Trading Scores of the most requested small cap stocks at 12Stocks.com (click stock name for detailed review):
|


| 12Stocks.com: Investing in Smallcap Index with Stocks | |
|
The following table helps investors and traders sort through current performance and trends (as measured by Smart Investing & Trading Score) of various
stocks in the Smallcap Index. Quick View: Move mouse or cursor over stock symbol (ticker) to view short-term technical chart and over stock name to view long term chart. Click on  to add stock symbol to your watchlist and to add stock symbol to your watchlist and  to view watchlist. Click on any ticker or stock name for detailed market intelligence report for that stock. to view watchlist. Click on any ticker or stock name for detailed market intelligence report for that stock. |
12Stocks.com Performance of Stocks in Smallcap Index
| Ticker | Stock Name | Watchlist | Category | Recent Price | Smart Investing & Trading Score | Change % | Weekly Change% |
| AUB | Atlantic Union |   | Financials | 34.37 | 100 | 1.21% | 1.22% |
| BZH | Beazer Homes | | Industrials | 28.77 | 47 | 1.30% | 1.20% |
| UCBI | United Community | | Financials | 26.96 | 83 | 0.41% | 1.20% |
| ABCB | Ameris Bancorp | | Financials | 50.45 | 90 | 0.42% | 1.20% |
| INBX | Inhibrx | | Health Care | 34.70 | 57 | 0.61% | 1.20% |
| HCC | Warrior Met | | Materials | 64.67 | 58 | 1.38% | 1.19% |
| HTBK | Heritage Commerce | | Financials | 8.50 | 100 | 1.07% | 1.19% |
| FBMS | First Bancshares | | Financials | 25.80 | 90 | -0.35% | 1.18% |
| SR | Spire | | Utilities | 62.59 | 100 | 0.45% | 1.15% |
| DAKT | Daktronics | | Technology | 11.41 | 68 | -2.06% | 1.15% |
| VRTS | Virtus | | Financials | 233.34 | 60 | -0.88% | 1.15% |
| LXP | Lexington Realty | | Financials | 8.87 | 83 | -0.56% | 1.14% |
| CMCO | Columbus McKinnon | | Industrials | 44.84 | 76 | 0.52% | 1.13% |
| RMR | RMR Group | | Financials | 24.06 | 47 | -1.15% | 1.13% |
| FMBH | First Mid | | Financials | 33.22 | 90 | 0.67% | 1.13% |
| VRRM | Verra Mobility | | Services & Goods | 27.33 | 68 | -1.37% | 1.13% |
| PTVE | Pactiv Evergreen | | Services & Goods | 13.46 | 18 | 0.07% | 1.13% |
| MCY | Mercury General | | Financials | 58.20 | 90 | 0.41% | 1.11% |
| LAUR | Laureate Education | | Services & Goods | 16.34 | 83 | 0.99% | 1.11% |
| MTRN | Materion | | Materials | 117.00 | 49 | 1.62% | 1.11% |
| NTB | Bank of N.T. Butterfield & Son | | Financials | 35.72 | 83 | 0.25% | 1.11% |
| NABL | N-able | | Technology | 12.78 | 40 | -0.62% | 1.11% |
| BLX | Banco Latinoamericano | | Financials | 30.70 | 83 | 0.66% | 1.09% |
| CHEF | Chefs | | Consumer Staples | 38.92 | 76 | -1.52% | 1.09% |
| BDC | Belden | | Industrials | 93.50 | 76 | 0.13% | 1.08% |


| Too many stocks? View smallcap stocks filtered by marketcap & sector |
| Marketcap: All SmallCap Stocks (default-no microcap), Large, Mid-Range, Small |
| Smallcap Sector: Tech, Finance, Energy, Staples, Retail, Industrial, Materials, & Medical |
|
Get the most comprehensive stock market coverage daily at 12Stocks.com ➞ Best Stocks Today ➞ Best Stocks Weekly ➞ Best Stocks Year-to-Date ➞ Best Stocks Trends ➞  Best Stocks Today 12Stocks.com Best Nasdaq Stocks ➞ Best S&P 500 Stocks ➞ Best Tech Stocks ➞ Best Biotech Stocks ➞ |
| Detailed Overview of SmallCap Stocks |
| SmallCap Technical Overview, Leaders & Laggards, Top SmallCap ETF Funds & Detailed SmallCap Stocks List, Charts, Trends & More |
| Smallcap: Technical Analysis, Trends & YTD Performance | |
| SmallCap segment as represented by
IWM, an exchange-traded fund [ETF], holds basket of thousands of smallcap stocks from across all major sectors of the US stock market. The smallcap index (contains stocks like Riverbed & Sotheby's) is up by 3.67% and is currently underperforming the overall market by -6.9% year-to-date. Below is a quick view of technical charts and trends: | |
 IWM Weekly Chart |
|
| Long Term Trend: Very Good | |
| Medium Term Trend: Very Good | |
 IWM Daily Chart |
|
| Short Term Trend: Good | |
| Overall Trend Score: 76 | |
| YTD Performance: 3.67% | |
| **Trend Scores & Views Are Only For Educational Purposes And Not For Investing | |
| 12Stocks.com: Top Performing Small Cap Index Stocks | ||||||||||||||||||||||||||||||||||||||||||||||||
 The top performing Small Cap Index stocks year to date are
Now, more recently, over last week, the top performing Small Cap Index stocks on the move are


|
||||||||||||||||||||||||||||||||||||||||||||||||
| 12Stocks.com: Investing in Smallcap Index using Exchange Traded Funds | |
|
The following table shows list of key exchange traded funds (ETF) that
help investors track Smallcap index. The following list also includes leveraged ETF funds that track twice or thrice the daily returns of Smallcap indices. Short or inverse ETF funds move in the opposite direction to the index they track and are useful during market pullbacks or during bear markets. Quick View: Move mouse or cursor over ETF symbol (ticker) to view short-term technical chart and over ETF name to view long term chart. Click on ticker or stock name for detailed view. Click on to add stock symbol to your watchlist and to view watchlist. |
12Stocks.com List of ETFs that track Smallcap Index
| Ticker | ETF Name | Watchlist | Recent Price | Smart Investing & Trading Score | Change % | Week % | Year-to-date % |
| IWM | iShares Russell 2000 | | 208.08 | 76 | 0.07 | 1.85 | 3.67% |
| VTWO | Vanguard Russell 2000 ETF | | 84.11 | 71 | 0.00 | 1.8 | 3.71% |
| IJR | iShares Core S&P Small-Cap | | 110.39 | 68 | -0.22 | 1.29 | 1.98% |
| IWN | iShares Russell 2000 Value | | 158.71 | 76 | -0.07 | 1.61 | 2.18% |
| IWO | iShares Russell 2000 Growth | | 265.15 | 63 | -0.75 | 2.01 | 5.13% |
| IJS | iShares S&P Small-Cap 600 Value | | 101.87 | 76 | -0.15 | 1.34 | -1.16% |
| IJT | iShares S&P Small-Cap 600 Growth | | 131.34 | 71 | 0.04 | 1.14 | 4.95% |
| XSLV | PowerShares S&P SmallCap Low Volatil ETF | | 44.48 | 83 | -0.01 | 0.55 | 0.74% |
| SAA | ProShares Ultra SmallCap600 | | 24.90 | 71 | 0.50 | 2.28 | -0.18% |
| SMLV | SPDR SSGA US Small Cap Low Volatil ETF | | 113.28 | 95 | 0.43 | 1.85 | 0.68% |
| SDD | ProShares UltraShort SmallCap600 | | 17.84 | 35 | 0.96 | -2.41 | -3.19% |
| SBB | ProShares Short SmallCap600 | | 15.77 | 25 | 0.41 | -1.14 | -0.98% |
| 12Stocks.com: Charts, Trends, Fundamental Data and Performances of SmallCap Stocks | |
|
We now take in-depth look at all SmallCap stocks including charts, multi-period performances and overall trends (as measured by Smart Investing & Trading Score). One can sort SmallCap stocks (click link to choose) by Daily, Weekly and by Year-to-Date performances. Also, one can sort by size of the company or by market capitalization. |
| Select Your Default Chart Type: | |||||
| |||||
| Click on stock symbol or name for detailed view. Click on to add stock symbol to your watchlist and to view watchlist. Quick View: Move mouse or cursor over "Daily" to quickly view daily technical stock chart and over "Weekly" to view weekly technical stock chart. | |||||

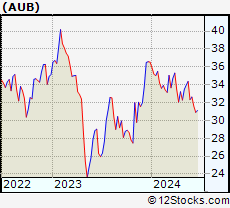 | AUB Atlantic Union Bankshares Corporation |
| Sector: Financials | |
| SubSector: Regional - Mid-Atlantic Banks | |
| MarketCap: 1728.79 Millions | |
| Recent Price: 34.37 Smart Investing & Trading Score: 100 | |
| Day Percent Change: 1.21% Day Change: 0.41 | |
| Week Change: 1.22% Year-to-date Change: -5.9% | |
| AUB Links: Profile News Message Board | |
| Charts:- Daily , Weekly | |
| Add AUB to Watchlist: View: Get Complete AUB Trend Analysis ➞ | |
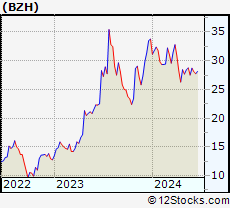 | BZH Beazer Homes USA, Inc. |
| Sector: Industrials | |
| SubSector: Residential Construction | |
| MarketCap: 180.106 Millions | |
| Recent Price: 28.77 Smart Investing & Trading Score: 47 | |
| Day Percent Change: 1.30% Day Change: 0.37 | |
| Week Change: 1.2% Year-to-date Change: -14.9% | |
| BZH Links: Profile News Message Board | |
| Charts:- Daily , Weekly | |
| Add BZH to Watchlist: View: Get Complete BZH Trend Analysis ➞ | |
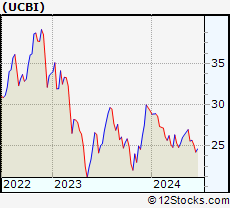 | UCBI United Community Banks, Inc. |
| Sector: Financials | |
| SubSector: Regional - Mid-Atlantic Banks | |
| MarketCap: 1593.99 Millions | |
| Recent Price: 26.96 Smart Investing & Trading Score: 83 | |
| Day Percent Change: 0.41% Day Change: 0.11 | |
| Week Change: 1.2% Year-to-date Change: -7.9% | |
| UCBI Links: Profile News Message Board | |
| Charts:- Daily , Weekly | |
| Add UCBI to Watchlist: View: Get Complete UCBI Trend Analysis ➞ | |
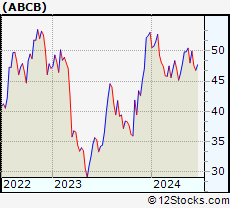 | ABCB Ameris Bancorp |
| Sector: Financials | |
| SubSector: Regional - Mid-Atlantic Banks | |
| MarketCap: 1537.79 Millions | |
| Recent Price: 50.45 Smart Investing & Trading Score: 90 | |
| Day Percent Change: 0.42% Day Change: 0.21 | |
| Week Change: 1.2% Year-to-date Change: -4.9% | |
| ABCB Links: Profile News Message Board | |
| Charts:- Daily , Weekly | |
| Add ABCB to Watchlist: View: Get Complete ABCB Trend Analysis ➞ | |
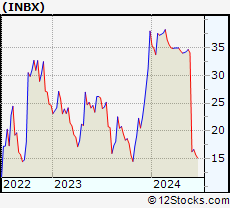 | INBX Inhibrx, Inc. |
| Sector: Health Care | |
| SubSector: Biotechnology | |
| MarketCap: 14187 Millions | |
| Recent Price: 34.70 Smart Investing & Trading Score: 57 | |
| Day Percent Change: 0.61% Day Change: 0.21 | |
| Week Change: 1.2% Year-to-date Change: -8.7% | |
| INBX Links: Profile News Message Board | |
| Charts:- Daily , Weekly | |
| Add INBX to Watchlist: View: Get Complete INBX Trend Analysis ➞ | |
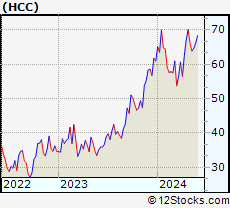 | HCC Warrior Met Coal, Inc. |
| Sector: Materials | |
| SubSector: Industrial Metals & Minerals | |
| MarketCap: 748.81 Millions | |
| Recent Price: 64.67 Smart Investing & Trading Score: 58 | |
| Day Percent Change: 1.38% Day Change: 0.88 | |
| Week Change: 1.19% Year-to-date Change: 6.1% | |
| HCC Links: Profile News Message Board | |
| Charts:- Daily , Weekly | |
| Add HCC to Watchlist: View: Get Complete HCC Trend Analysis ➞ | |
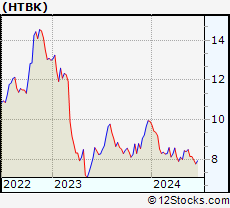 | HTBK Heritage Commerce Corp |
| Sector: Financials | |
| SubSector: Regional - Pacific Banks | |
| MarketCap: 416.129 Millions | |
| Recent Price: 8.50 Smart Investing & Trading Score: 100 | |
| Day Percent Change: 1.07% Day Change: 0.09 | |
| Week Change: 1.19% Year-to-date Change: -14.3% | |
| HTBK Links: Profile News Message Board | |
| Charts:- Daily , Weekly | |
| Add HTBK to Watchlist: View: Get Complete HTBK Trend Analysis ➞ | |
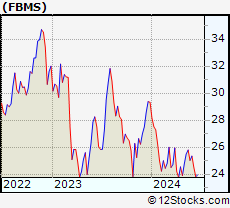 | FBMS The First Bancshares, Inc. |
| Sector: Financials | |
| SubSector: Regional - Southeast Banks | |
| MarketCap: 359.535 Millions | |
| Recent Price: 25.80 Smart Investing & Trading Score: 90 | |
| Day Percent Change: -0.35% Day Change: -0.09 | |
| Week Change: 1.18% Year-to-date Change: -12.0% | |
| FBMS Links: Profile News Message Board | |
| Charts:- Daily , Weekly | |
| Add FBMS to Watchlist: View: Get Complete FBMS Trend Analysis ➞ | |
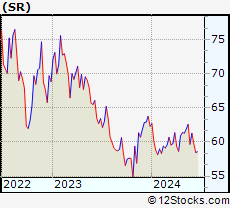 | SR Spire Inc. |
| Sector: Utilities | |
| SubSector: Gas Utilities | |
| MarketCap: 3745.87 Millions | |
| Recent Price: 62.59 Smart Investing & Trading Score: 100 | |
| Day Percent Change: 0.45% Day Change: 0.28 | |
| Week Change: 1.15% Year-to-date Change: 0.4% | |
| SR Links: Profile News Message Board | |
| Charts:- Daily , Weekly | |
| Add SR to Watchlist: View: Get Complete SR Trend Analysis ➞ | |
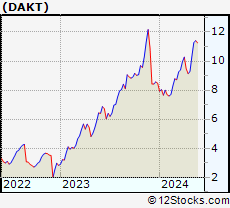 | DAKT Daktronics, Inc. |
| Sector: Technology | |
| SubSector: Computer Based Systems | |
| MarketCap: 223.539 Millions | |
| Recent Price: 11.41 Smart Investing & Trading Score: 68 | |
| Day Percent Change: -2.06% Day Change: -0.24 | |
| Week Change: 1.15% Year-to-date Change: 34.6% | |
| DAKT Links: Profile News Message Board | |
| Charts:- Daily , Weekly | |
| Add DAKT to Watchlist: View: Get Complete DAKT Trend Analysis ➞ | |
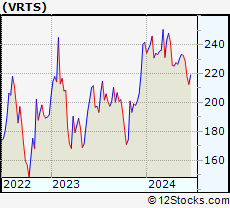 | VRTS Virtus Investment Partners, Inc. |
| Sector: Financials | |
| SubSector: Asset Management | |
| MarketCap: 601.303 Millions | |
| Recent Price: 233.34 Smart Investing & Trading Score: 60 | |
| Day Percent Change: -0.88% Day Change: -2.07 | |
| Week Change: 1.15% Year-to-date Change: -3.5% | |
| VRTS Links: Profile News Message Board | |
| Charts:- Daily , Weekly | |
| Add VRTS to Watchlist: View: Get Complete VRTS Trend Analysis ➞ | |
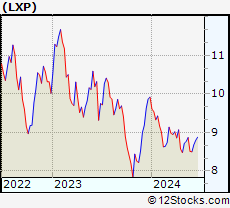 | LXP Lexington Realty Trust |
| Sector: Financials | |
| SubSector: REIT - Diversified | |
| MarketCap: 2483.43 Millions | |
| Recent Price: 8.87 Smart Investing & Trading Score: 83 | |
| Day Percent Change: -0.56% Day Change: -0.05 | |
| Week Change: 1.14% Year-to-date Change: -10.6% | |
| LXP Links: Profile News Message Board | |
| Charts:- Daily , Weekly | |
| Add LXP to Watchlist: View: Get Complete LXP Trend Analysis ➞ | |
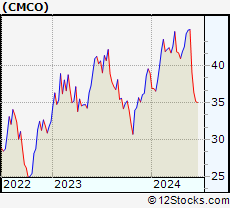 | CMCO Columbus McKinnon Corporation |
| Sector: Industrials | |
| SubSector: Farm & Construction Machinery | |
| MarketCap: 598.807 Millions | |
| Recent Price: 44.84 Smart Investing & Trading Score: 76 | |
| Day Percent Change: 0.52% Day Change: 0.23 | |
| Week Change: 1.13% Year-to-date Change: 14.9% | |
| CMCO Links: Profile News Message Board | |
| Charts:- Daily , Weekly | |
| Add CMCO to Watchlist: View: Get Complete CMCO Trend Analysis ➞ | |
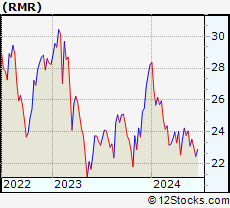 | RMR The RMR Group Inc. |
| Sector: Financials | |
| SubSector: Real Estate Development | |
| MarketCap: 797.419 Millions | |
| Recent Price: 24.06 Smart Investing & Trading Score: 47 | |
| Day Percent Change: -1.15% Day Change: -0.28 | |
| Week Change: 1.13% Year-to-date Change: -14.8% | |
| RMR Links: Profile News Message Board | |
| Charts:- Daily , Weekly | |
| Add RMR to Watchlist: View: Get Complete RMR Trend Analysis ➞ | |
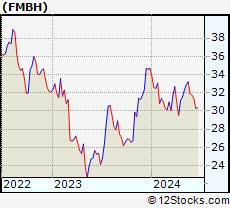 | FMBH First Mid Bancshares, Inc. |
| Sector: Financials | |
| SubSector: Regional - Midwest Banks | |
| MarketCap: 373.27 Millions | |
| Recent Price: 33.22 Smart Investing & Trading Score: 90 | |
| Day Percent Change: 0.67% Day Change: 0.22 | |
| Week Change: 1.13% Year-to-date Change: -4.2% | |
| FMBH Links: Profile News Message Board | |
| Charts:- Daily , Weekly | |
| Add FMBH to Watchlist: View: Get Complete FMBH Trend Analysis ➞ | |
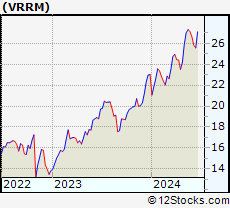 | VRRM Verra Mobility Corporation |
| Sector: Services & Goods | |
| SubSector: Security & Protection Services | |
| MarketCap: 1265.03 Millions | |
| Recent Price: 27.33 Smart Investing & Trading Score: 68 | |
| Day Percent Change: -1.37% Day Change: -0.38 | |
| Week Change: 1.13% Year-to-date Change: 18.7% | |
| VRRM Links: Profile News Message Board | |
| Charts:- Daily , Weekly | |
| Add VRRM to Watchlist: View: Get Complete VRRM Trend Analysis ➞ | |
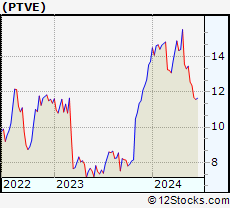 | PTVE Pactiv Evergreen Inc. |
| Sector: Services & Goods | |
| SubSector: Packaging & Containers | |
| MarketCap: 33427 Millions | |
| Recent Price: 13.46 Smart Investing & Trading Score: 18 | |
| Day Percent Change: 0.07% Day Change: 0.01 | |
| Week Change: 1.13% Year-to-date Change: -1.9% | |
| PTVE Links: Profile News Message Board | |
| Charts:- Daily , Weekly | |
| Add PTVE to Watchlist: View: Get Complete PTVE Trend Analysis ➞ | |
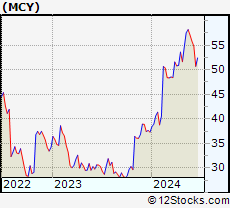 | MCY Mercury General Corporation |
| Sector: Financials | |
| SubSector: Property & Casualty Insurance | |
| MarketCap: 2122.12 Millions | |
| Recent Price: 58.20 Smart Investing & Trading Score: 90 | |
| Day Percent Change: 0.41% Day Change: 0.24 | |
| Week Change: 1.11% Year-to-date Change: 56.0% | |
| MCY Links: Profile News Message Board | |
| Charts:- Daily , Weekly | |
| Add MCY to Watchlist: View: Get Complete MCY Trend Analysis ➞ | |
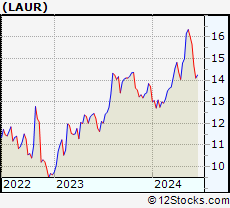 | LAUR Laureate Education, Inc. |
| Sector: Services & Goods | |
| SubSector: Education & Training Services | |
| MarketCap: 2258.56 Millions | |
| Recent Price: 16.34 Smart Investing & Trading Score: 83 | |
| Day Percent Change: 0.99% Day Change: 0.16 | |
| Week Change: 1.11% Year-to-date Change: 19.2% | |
| LAUR Links: Profile News Message Board | |
| Charts:- Daily , Weekly | |
| Add LAUR to Watchlist: View: Get Complete LAUR Trend Analysis ➞ | |
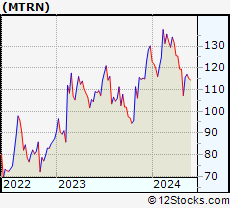 | MTRN Materion Corporation |
| Sector: Materials | |
| SubSector: Industrial Metals & Minerals | |
| MarketCap: 703.71 Millions | |
| Recent Price: 117.00 Smart Investing & Trading Score: 49 | |
| Day Percent Change: 1.62% Day Change: 1.86 | |
| Week Change: 1.11% Year-to-date Change: -10.1% | |
| MTRN Links: Profile News Message Board | |
| Charts:- Daily , Weekly | |
| Add MTRN to Watchlist: View: Get Complete MTRN Trend Analysis ➞ | |
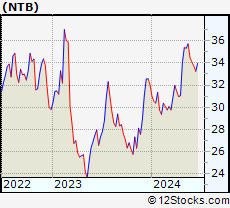 | NTB The Bank of N.T. Butterfield & Son Limited |
| Sector: Financials | |
| SubSector: Foreign Regional Banks | |
| MarketCap: 889.379 Millions | |
| Recent Price: 35.72 Smart Investing & Trading Score: 83 | |
| Day Percent Change: 0.25% Day Change: 0.09 | |
| Week Change: 1.11% Year-to-date Change: 11.6% | |
| NTB Links: Profile News Message Board | |
| Charts:- Daily , Weekly | |
| Add NTB to Watchlist: View: Get Complete NTB Trend Analysis ➞ | |
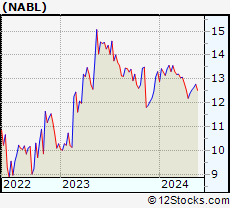 | NABL N-able, Inc. |
| Sector: Technology | |
| SubSector: Information Technology Services | |
| MarketCap: 2590 Millions | |
| Recent Price: 12.78 Smart Investing & Trading Score: 40 | |
| Day Percent Change: -0.62% Day Change: -0.08 | |
| Week Change: 1.11% Year-to-date Change: -4.0% | |
| NABL Links: Profile News Message Board | |
| Charts:- Daily , Weekly | |
| Add NABL to Watchlist: View: Get Complete NABL Trend Analysis ➞ | |
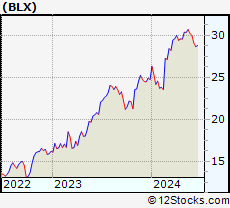 | BLX Banco Latinoamericano de Comercio Exterior, S.A |
| Sector: Financials | |
| SubSector: Foreign Money Center Banks | |
| MarketCap: 390.471 Millions | |
| Recent Price: 30.70 Smart Investing & Trading Score: 83 | |
| Day Percent Change: 0.66% Day Change: 0.20 | |
| Week Change: 1.09% Year-to-date Change: 24.1% | |
| BLX Links: Profile News Message Board | |
| Charts:- Daily , Weekly | |
| Add BLX to Watchlist: View: Get Complete BLX Trend Analysis ➞ | |
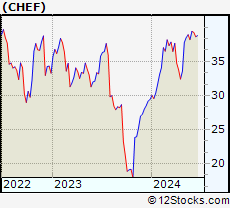 | CHEF The Chefs Warehouse, Inc. |
| Sector: Consumer Staples | |
| SubSector: Food Wholesale | |
| MarketCap: 207.529 Millions | |
| Recent Price: 38.92 Smart Investing & Trading Score: 76 | |
| Day Percent Change: -1.52% Day Change: -0.60 | |
| Week Change: 1.09% Year-to-date Change: 32.3% | |
| CHEF Links: Profile News Message Board | |
| Charts:- Daily , Weekly | |
| Add CHEF to Watchlist: View: Get Complete CHEF Trend Analysis ➞ | |
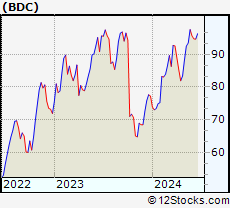 | BDC Belden Inc. |
| Sector: Industrials | |
| SubSector: Industrial Electrical Equipment | |
| MarketCap: 1490.59 Millions | |
| Recent Price: 93.50 Smart Investing & Trading Score: 76 | |
| Day Percent Change: 0.13% Day Change: 0.12 | |
| Week Change: 1.08% Year-to-date Change: 21.0% | |
| BDC Links: Profile News Message Board | |
| Charts:- Daily , Weekly | |
| Add BDC to Watchlist: View: Get Complete BDC Trend Analysis ➞ | |
| Too many stocks? View smallcap stocks filtered by marketcap & sector |
| Marketcap: All SmallCap Stocks (default-no microcap), Large, Mid-Range, Small & MicroCap |
| Sector: Tech, Finance, Energy, Staples, Retail, Industrial, Materials, Utilities & Medical |
|
Best Stocks Today 12Stocks.com |
© 2024 12Stocks.com Terms & Conditions Privacy Contact Us
All Information Provided Only For Education And Not To Be Used For Investing or Trading. See Terms & Conditions


One More Thing ... Get Best Stocks Delivered Daily!
Never Ever Miss A Move With Our Top Ten Stocks Lists
Find Best Stocks In Any Market - Bull or Bear Market
Take A Peek At Our Top Ten Stocks Lists: Daily, Weekly, Year-to-Date & Top Trends
Find Best Stocks In Any Market - Bull or Bear Market
Take A Peek At Our Top Ten Stocks Lists: Daily, Weekly, Year-to-Date & Top Trends
Smallcap Stocks With Best Up Trends [0-bearish to 100-bullish]: CommScope Holding[100], Coeur Mining[100], Hecla Mining[100], MicroStrategy [100], Enovix [100], Rayonier Advanced[100], Nurix [100], Energy Fuels[100], NovaGold Resources[100], Piedmont Lithium[100], Wave Life[100]
Best Smallcap Stocks Year-to-Date:
CareMax [495.88%], Bakkt [413.9%], Janux [338.34%], Viking [260.02%], Alpine Immune[241.23%], Longboard [238.63%], Avidity Biosciences[226.33%], Super Micro[212.35%], Arcutis Bio[184.83%], Sweetgreen [180.97%], Novavax [171.04%] Best Smallcap Stocks This Week:
Vaxxinity [58.82%], Novavax [46.51%], Vicarious Surgical[45.62%], Harrow Health[44.48%], ProKidney [44.31%], Workhorse Group[36.06%], Maxeon Solar[35.94%], Fossil Group[35.44%], Humacyte [34.68%], MicroStrategy [34.23%], Cadiz [33.48%] Best Smallcap Stocks Daily:
Vaxxinity [45.95%], Presto Automation[31.90%], Vicarious Surgical[27.93%], Orchestra BioMed[12.77%], CommScope Holding[11.86%], Coeur Mining[11.57%], Hecla Mining[11.11%], MicroStrategy [10.04%], Tenaya [9.65%], Bakkt [9.25%], Enovix [9.25%]