
 Login Sign Up


| |||||
 |  | ||||

| 12Stocks.com Market Intelligence |
Best SmallCap Stocks
|
| In a hurry? Small Cap Stock Lists: Performance Trends Table, Stock Charts
Sort Small Cap stocks: Daily, Weekly, Year-to-Date, Market Cap & Trends. Filter Small Cap stocks list by sector: Show all, Tech, Finance, Energy, Staples, Retail, Industrial, Materials, Utilities and HealthCare Filter Small Cap stocks list by size: All Large Medium Small and MicroCap |
| 12Stocks.com Small Cap Stocks Performances & Trends Daily | |||||||||
|
|  The overall Smart Investing & Trading Score is 76 (0-bearish to 100-bullish) which puts Small Cap index in short term neutral to bullish trend. The Smart Investing & Trading Score from previous trading session is 90 and hence a deterioration of trend.
| ||||||||
Here are the Smart Investing & Trading Scores of the most requested small cap stocks at 12Stocks.com (click stock name for detailed review):
|


| 12Stocks.com: Investing in Smallcap Index with Stocks | |
|
The following table helps investors and traders sort through current performance and trends (as measured by Smart Investing & Trading Score) of various
stocks in the Smallcap Index. Quick View: Move mouse or cursor over stock symbol (ticker) to view short-term technical chart and over stock name to view long term chart. Click on  to add stock symbol to your watchlist and to add stock symbol to your watchlist and  to view watchlist. Click on any ticker or stock name for detailed market intelligence report for that stock. to view watchlist. Click on any ticker or stock name for detailed market intelligence report for that stock. |
12Stocks.com Performance of Stocks in Smallcap Index
| Ticker | Stock Name | Watchlist | Category | Recent Price | Smart Investing & Trading Score | Change % | Weekly Change% |
| MEG | Montrose Environmental |   | Industrials | 47.99 | 93 | 0.95% | 9.34% |
| CATO | Cato | | Services & Goods | 5.31 | 69 | -0.38% | 9.26% |
| ARCT | Arcturus | | Health Care | 29.78 | 45 | -2.36% | 9.24% |
| NGVC | Natural Grocers | | Services & Goods | 21.32 | 88 | 1.19% | 9.22% |
| KODK | Eastman Kodak | | Technology | 4.98 | 62 | -1.39% | 9.21% |
| NMRK | Newmark Group | | Financials | 11.22 | 100 | 2.75% | 9.20% |
| HWKN | Hawkins | | Materials | 85.25 | 100 | 1.85% | 9.17% |
| GCBC | Greene County | | Financials | 32.22 | 88 | -0.56% | 9.15% |
| SLVM | Sylvamo | | Materials | 70.30 | 90 | 0.10% | 9.13% |
| BOWL | Bowlero | | Services & Goods | 11.98 | 59 | 2.66% | 9.11% |
| OCUL | Ocular Therapeutix | | Health Care | 6.17 | 52 | -1.59% | 9.01% |
| CRMT | America s | | Services & Goods | 64.50 | 42 | 0.06% | 8.99% |
| BLBD | Blue Bird | | Consumer Staples | 53.08 | 90 | 1.18% | 8.90% |
| PTGX | Protagonist | | Health Care | 30.74 | 83 | -3.76% | 8.89% |
| LOVE | Lovesac | | Consumer Staples | 27.56 | 90 | 1.06% | 8.89% |
| ACET | Aceto | | Materials | 1.60 | 57 | 1.91% | 8.84% |
| TELA | TELA Bio | | Health Care | 6.28 | 69 | -1.26% | 8.84% |
| PWSC | PowerSchool | | Technology | 19.71 | 57 | 3.57% | 8.83% |
| RCKY | Rocky Brands | | Consumer Staples | 37.41 | 83 | -0.51% | 8.78% |
| BJRI | BJ s | | Services & Goods | 36.71 | 95 | -1.87% | 8.77% |
| VNDA | Vanda | | Health Care | 5.48 | 100 | -1.79% | 8.73% |
| NRIM | Northrim BanCorp | | Financials | 56.25 | 95 | 0.07% | 8.70% |
| CURV | Torrid | | Services & Goods | 6.00 | 90 | 0.67% | 8.70% |
| PRCT | PROCEPT BioRobotics | | Health Care | 68.10 | 83 | -0.06% | 8.70% |
| PGEN | Precigen | | Health Care | 1.38 | 30 | -1.43% | 8.66% |


| Too many stocks? View smallcap stocks filtered by marketcap & sector |
| Marketcap: All SmallCap Stocks (default-no microcap), Large, Mid-Range, Small |
| Smallcap Sector: Tech, Finance, Energy, Staples, Retail, Industrial, Materials, & Medical |
|
Get the most comprehensive stock market coverage daily at 12Stocks.com ➞ Best Stocks Today ➞ Best Stocks Weekly ➞ Best Stocks Year-to-Date ➞ Best Stocks Trends ➞  Best Stocks Today 12Stocks.com Best Nasdaq Stocks ➞ Best S&P 500 Stocks ➞ Best Tech Stocks ➞ Best Biotech Stocks ➞ |
| Detailed Overview of SmallCap Stocks |
| SmallCap Technical Overview, Leaders & Laggards, Top SmallCap ETF Funds & Detailed SmallCap Stocks List, Charts, Trends & More |
| Smallcap: Technical Analysis, Trends & YTD Performance | |
| SmallCap segment as represented by
IWM, an exchange-traded fund [ETF], holds basket of thousands of smallcap stocks from across all major sectors of the US stock market. The smallcap index (contains stocks like Riverbed & Sotheby's) is up by 3.67% and is currently underperforming the overall market by -6.9% year-to-date. Below is a quick view of technical charts and trends: | |
 IWM Weekly Chart |
|
| Long Term Trend: Very Good | |
| Medium Term Trend: Very Good | |
 IWM Daily Chart |
|
| Short Term Trend: Good | |
| Overall Trend Score: 76 | |
| YTD Performance: 3.67% | |
| **Trend Scores & Views Are Only For Educational Purposes And Not For Investing | |
| 12Stocks.com: Top Performing Small Cap Index Stocks | ||||||||||||||||||||||||||||||||||||||||||||||||
 The top performing Small Cap Index stocks year to date are
Now, more recently, over last week, the top performing Small Cap Index stocks on the move are


|
||||||||||||||||||||||||||||||||||||||||||||||||
| 12Stocks.com: Investing in Smallcap Index using Exchange Traded Funds | |
|
The following table shows list of key exchange traded funds (ETF) that
help investors track Smallcap index. The following list also includes leveraged ETF funds that track twice or thrice the daily returns of Smallcap indices. Short or inverse ETF funds move in the opposite direction to the index they track and are useful during market pullbacks or during bear markets. Quick View: Move mouse or cursor over ETF symbol (ticker) to view short-term technical chart and over ETF name to view long term chart. Click on ticker or stock name for detailed view. Click on to add stock symbol to your watchlist and to view watchlist. |
12Stocks.com List of ETFs that track Smallcap Index
| Ticker | ETF Name | Watchlist | Recent Price | Smart Investing & Trading Score | Change % | Week % | Year-to-date % |
| IWM | iShares Russell 2000 | | 208.08 | 76 | 0.07 | 1.85 | 3.67% |
| VTWO | Vanguard Russell 2000 ETF | | 84.11 | 71 | 0.00 | 1.8 | 3.71% |
| IJR | iShares Core S&P Small-Cap | | 110.39 | 68 | -0.22 | 1.29 | 1.98% |
| IWN | iShares Russell 2000 Value | | 158.71 | 76 | -0.07 | 1.61 | 2.18% |
| IWO | iShares Russell 2000 Growth | | 265.15 | 63 | -0.75 | 2.01 | 5.13% |
| IJS | iShares S&P Small-Cap 600 Value | | 101.87 | 76 | -0.15 | 1.34 | -1.16% |
| IJT | iShares S&P Small-Cap 600 Growth | | 131.34 | 71 | 0.04 | 1.14 | 4.95% |
| XSLV | PowerShares S&P SmallCap Low Volatil ETF | | 44.48 | 83 | -0.01 | 0.55 | 0.74% |
| SAA | ProShares Ultra SmallCap600 | | 24.90 | 71 | 0.50 | 2.28 | -0.18% |
| SMLV | SPDR SSGA US Small Cap Low Volatil ETF | | 113.28 | 95 | 0.43 | 1.85 | 0.68% |
| SDD | ProShares UltraShort SmallCap600 | | 17.84 | 35 | 0.96 | -2.41 | -3.19% |
| SBB | ProShares Short SmallCap600 | | 15.77 | 25 | 0.41 | -1.14 | -0.98% |
| 12Stocks.com: Charts, Trends, Fundamental Data and Performances of SmallCap Stocks | |
|
We now take in-depth look at all SmallCap stocks including charts, multi-period performances and overall trends (as measured by Smart Investing & Trading Score). One can sort SmallCap stocks (click link to choose) by Daily, Weekly and by Year-to-Date performances. Also, one can sort by size of the company or by market capitalization. |
| Select Your Default Chart Type: | |||||
| |||||
| Click on stock symbol or name for detailed view. Click on to add stock symbol to your watchlist and to view watchlist. Quick View: Move mouse or cursor over "Daily" to quickly view daily technical stock chart and over "Weekly" to view weekly technical stock chart. | |||||

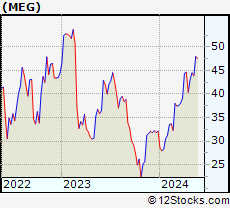 | MEG Montrose Environmental Group, Inc. |
| Sector: Industrials | |
| SubSector: Waste Management | |
| MarketCap: 71627 Millions | |
| Recent Price: 47.99 Smart Investing & Trading Score: 93 | |
| Day Percent Change: 0.95% Day Change: 0.45 | |
| Week Change: 9.34% Year-to-date Change: 49.2% | |
| MEG Links: Profile News Message Board | |
| Charts:- Daily , Weekly | |
| Add MEG to Watchlist: View: Get Complete MEG Trend Analysis ➞ | |
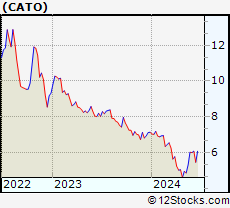 | CATO The Cato Corporation |
| Sector: Services & Goods | |
| SubSector: Apparel Stores | |
| MarketCap: 305.208 Millions | |
| Recent Price: 5.31 Smart Investing & Trading Score: 69 | |
| Day Percent Change: -0.38% Day Change: -0.02 | |
| Week Change: 9.26% Year-to-date Change: -25.6% | |
| CATO Links: Profile News Message Board | |
| Charts:- Daily , Weekly | |
| Add CATO to Watchlist: View: Get Complete CATO Trend Analysis ➞ | |
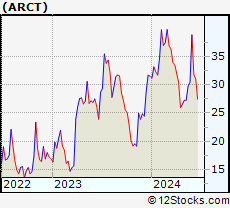 | ARCT Arcturus Therapeutics Holdings Inc. |
| Sector: Health Care | |
| SubSector: Biotechnology | |
| MarketCap: 241.385 Millions | |
| Recent Price: 29.78 Smart Investing & Trading Score: 45 | |
| Day Percent Change: -2.36% Day Change: -0.72 | |
| Week Change: 9.24% Year-to-date Change: -5.6% | |
| ARCT Links: Profile News Message Board | |
| Charts:- Daily , Weekly | |
| Add ARCT to Watchlist: View: Get Complete ARCT Trend Analysis ➞ | |
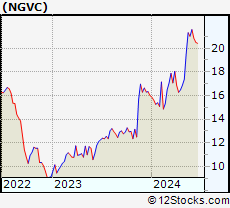 | NGVC Natural Grocers by Vitamin Cottage, Inc. |
| Sector: Services & Goods | |
| SubSector: Grocery Stores | |
| MarketCap: 185.475 Millions | |
| Recent Price: 21.32 Smart Investing & Trading Score: 88 | |
| Day Percent Change: 1.19% Day Change: 0.25 | |
| Week Change: 9.22% Year-to-date Change: 33.3% | |
| NGVC Links: Profile News Message Board | |
| Charts:- Daily , Weekly | |
| Add NGVC to Watchlist: View: Get Complete NGVC Trend Analysis ➞ | |
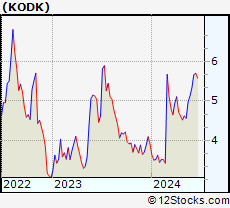 | KODK Eastman Kodak Company |
| Sector: Technology | |
| SubSector: Electronic Equipment | |
| MarketCap: 78.47 Millions | |
| Recent Price: 4.98 Smart Investing & Trading Score: 62 | |
| Day Percent Change: -1.39% Day Change: -0.07 | |
| Week Change: 9.21% Year-to-date Change: 27.7% | |
| KODK Links: Profile News Message Board | |
| Charts:- Daily , Weekly | |
| Add KODK to Watchlist: View: Get Complete KODK Trend Analysis ➞ | |
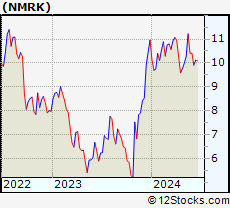 | NMRK Newmark Group, Inc. |
| Sector: Financials | |
| SubSector: Property Management | |
| MarketCap: 767.542 Millions | |
| Recent Price: 11.22 Smart Investing & Trading Score: 100 | |
| Day Percent Change: 2.75% Day Change: 0.30 | |
| Week Change: 9.2% Year-to-date Change: 2.4% | |
| NMRK Links: Profile News Message Board | |
| Charts:- Daily , Weekly | |
| Add NMRK to Watchlist: View: Get Complete NMRK Trend Analysis ➞ | |
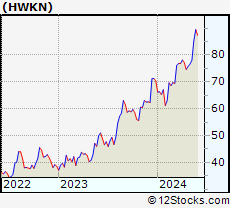 | HWKN Hawkins, Inc. |
| Sector: Materials | |
| SubSector: Specialty Chemicals | |
| MarketCap: 398.957 Millions | |
| Recent Price: 85.25 Smart Investing & Trading Score: 100 | |
| Day Percent Change: 1.85% Day Change: 1.55 | |
| Week Change: 9.17% Year-to-date Change: 21.1% | |
| HWKN Links: Profile News Message Board | |
| Charts:- Daily , Weekly | |
| Add HWKN to Watchlist: View: Get Complete HWKN Trend Analysis ➞ | |
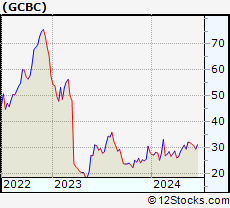 | GCBC Greene County Bancorp, Inc. |
| Sector: Financials | |
| SubSector: Savings & Loans | |
| MarketCap: 314.83 Millions | |
| Recent Price: 32.22 Smart Investing & Trading Score: 88 | |
| Day Percent Change: -0.56% Day Change: -0.18 | |
| Week Change: 9.15% Year-to-date Change: 14.3% | |
| GCBC Links: Profile News Message Board | |
| Charts:- Daily , Weekly | |
| Add GCBC to Watchlist: View: Get Complete GCBC Trend Analysis ➞ | |
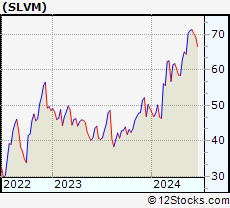 | SLVM Sylvamo Corporation |
| Sector: Materials | |
| SubSector: Paper & Paper Products | |
| MarketCap: 1710 Millions | |
| Recent Price: 70.30 Smart Investing & Trading Score: 90 | |
| Day Percent Change: 0.10% Day Change: 0.07 | |
| Week Change: 9.13% Year-to-date Change: 43.2% | |
| SLVM Links: Profile News Message Board | |
| Charts:- Daily , Weekly | |
| Add SLVM to Watchlist: View: Get Complete SLVM Trend Analysis ➞ | |
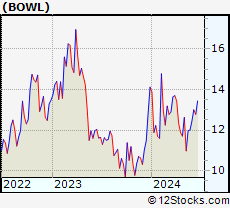 | BOWL Bowlero Corp. |
| Sector: Services & Goods | |
| SubSector: Leisure | |
| MarketCap: 2000 Millions | |
| Recent Price: 11.98 Smart Investing & Trading Score: 59 | |
| Day Percent Change: 2.66% Day Change: 0.31 | |
| Week Change: 9.11% Year-to-date Change: -15.2% | |
| BOWL Links: Profile News Message Board | |
| Charts:- Daily , Weekly | |
| Add BOWL to Watchlist: View: Get Complete BOWL Trend Analysis ➞ | |
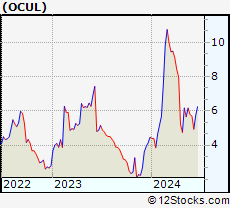 | OCUL Ocular Therapeutix, Inc. |
| Sector: Health Care | |
| SubSector: Biotechnology | |
| MarketCap: 249.985 Millions | |
| Recent Price: 6.17 Smart Investing & Trading Score: 52 | |
| Day Percent Change: -1.59% Day Change: -0.10 | |
| Week Change: 9.01% Year-to-date Change: 38.3% | |
| OCUL Links: Profile News Message Board | |
| Charts:- Daily , Weekly | |
| Add OCUL to Watchlist: View: Get Complete OCUL Trend Analysis ➞ | |
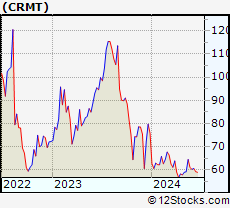 | CRMT America s Car-Mart, Inc. |
| Sector: Services & Goods | |
| SubSector: Auto Dealerships | |
| MarketCap: 329.921 Millions | |
| Recent Price: 64.50 Smart Investing & Trading Score: 42 | |
| Day Percent Change: 0.06% Day Change: 0.04 | |
| Week Change: 8.99% Year-to-date Change: -14.9% | |
| CRMT Links: Profile News Message Board | |
| Charts:- Daily , Weekly | |
| Add CRMT to Watchlist: View: Get Complete CRMT Trend Analysis ➞ | |
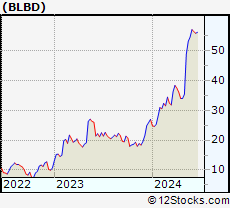 | BLBD Blue Bird Corporation |
| Sector: Consumer Staples | |
| SubSector: Auto Manufacturers - Major | |
| MarketCap: 345.371 Millions | |
| Recent Price: 53.08 Smart Investing & Trading Score: 90 | |
| Day Percent Change: 1.18% Day Change: 0.62 | |
| Week Change: 8.9% Year-to-date Change: 96.9% | |
| BLBD Links: Profile News Message Board | |
| Charts:- Daily , Weekly | |
| Add BLBD to Watchlist: View: Get Complete BLBD Trend Analysis ➞ | |
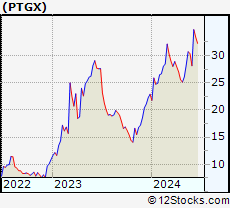 | PTGX Protagonist Therapeutics, Inc. |
| Sector: Health Care | |
| SubSector: Biotechnology | |
| MarketCap: 165.285 Millions | |
| Recent Price: 30.74 Smart Investing & Trading Score: 83 | |
| Day Percent Change: -3.76% Day Change: -1.20 | |
| Week Change: 8.89% Year-to-date Change: 34.1% | |
| PTGX Links: Profile News Message Board | |
| Charts:- Daily , Weekly | |
| Add PTGX to Watchlist: View: Get Complete PTGX Trend Analysis ➞ | |
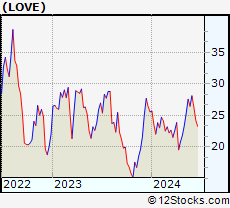 | LOVE The Lovesac Company |
| Sector: Consumer Staples | |
| SubSector: Home Furnishings & Fixtures | |
| MarketCap: 112.835 Millions | |
| Recent Price: 27.56 Smart Investing & Trading Score: 90 | |
| Day Percent Change: 1.06% Day Change: 0.29 | |
| Week Change: 8.89% Year-to-date Change: 7.9% | |
| LOVE Links: Profile News Message Board | |
| Charts:- Daily , Weekly | |
| Add LOVE to Watchlist: View: Get Complete LOVE Trend Analysis ➞ | |
 | ACET Aceto Corporation |
| Sector: Materials | |
| SubSector: Chemicals - Major Diversified | |
| MarketCap: 453.16 Millions | |
| Recent Price: 1.60 Smart Investing & Trading Score: 57 | |
| Day Percent Change: 1.91% Day Change: 0.03 | |
| Week Change: 8.84% Year-to-date Change: -15.3% | |
| ACET Links: Profile News Message Board | |
| Charts:- Daily , Weekly | |
| Add ACET to Watchlist: View: Get Complete ACET Trend Analysis ➞ | |
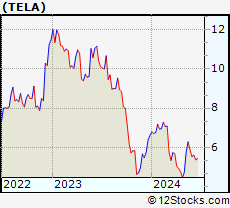 | TELA TELA Bio, Inc. |
| Sector: Health Care | |
| SubSector: Medical Appliances & Equipment | |
| MarketCap: 81.808 Millions | |
| Recent Price: 6.28 Smart Investing & Trading Score: 69 | |
| Day Percent Change: -1.26% Day Change: -0.08 | |
| Week Change: 8.84% Year-to-date Change: -5.1% | |
| TELA Links: Profile News Message Board | |
| Charts:- Daily , Weekly | |
| Add TELA to Watchlist: View: Get Complete TELA Trend Analysis ➞ | |
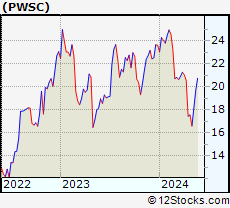 | PWSC PowerSchool Holdings, Inc. |
| Sector: Technology | |
| SubSector: Software - Application | |
| MarketCap: 3870 Millions | |
| Recent Price: 19.71 Smart Investing & Trading Score: 57 | |
| Day Percent Change: 3.57% Day Change: 0.68 | |
| Week Change: 8.83% Year-to-date Change: -16.6% | |
| PWSC Links: Profile News Message Board | |
| Charts:- Daily , Weekly | |
| Add PWSC to Watchlist: View: Get Complete PWSC Trend Analysis ➞ | |
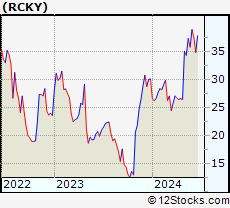 | RCKY Rocky Brands, Inc. |
| Sector: Consumer Staples | |
| SubSector: Textile - Apparel Footwear & Accessories | |
| MarketCap: 137.47 Millions | |
| Recent Price: 37.41 Smart Investing & Trading Score: 83 | |
| Day Percent Change: -0.51% Day Change: -0.19 | |
| Week Change: 8.78% Year-to-date Change: 24.0% | |
| RCKY Links: Profile News Message Board | |
| Charts:- Daily , Weekly | |
| Add RCKY to Watchlist: View: Get Complete RCKY Trend Analysis ➞ | |
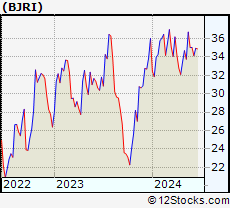 | BJRI BJ s Restaurants, Inc. |
| Sector: Services & Goods | |
| SubSector: Restaurants | |
| MarketCap: 183.67 Millions | |
| Recent Price: 36.71 Smart Investing & Trading Score: 95 | |
| Day Percent Change: -1.87% Day Change: -0.70 | |
| Week Change: 8.77% Year-to-date Change: 1.9% | |
| BJRI Links: Profile News Message Board | |
| Charts:- Daily , Weekly | |
| Add BJRI to Watchlist: View: Get Complete BJRI Trend Analysis ➞ | |
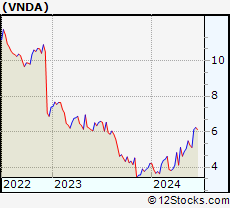 | VNDA Vanda Pharmaceuticals Inc. |
| Sector: Health Care | |
| SubSector: Biotechnology | |
| MarketCap: 464.585 Millions | |
| Recent Price: 5.48 Smart Investing & Trading Score: 100 | |
| Day Percent Change: -1.79% Day Change: -0.10 | |
| Week Change: 8.73% Year-to-date Change: 29.9% | |
| VNDA Links: Profile News Message Board | |
| Charts:- Daily , Weekly | |
| Add VNDA to Watchlist: View: Get Complete VNDA Trend Analysis ➞ | |
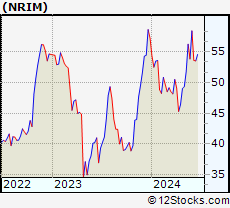 | NRIM Northrim BanCorp, Inc. |
| Sector: Financials | |
| SubSector: Regional - Pacific Banks | |
| MarketCap: 147.629 Millions | |
| Recent Price: 56.25 Smart Investing & Trading Score: 95 | |
| Day Percent Change: 0.07% Day Change: 0.04 | |
| Week Change: 8.7% Year-to-date Change: -1.7% | |
| NRIM Links: Profile News Message Board | |
| Charts:- Daily , Weekly | |
| Add NRIM to Watchlist: View: Get Complete NRIM Trend Analysis ➞ | |
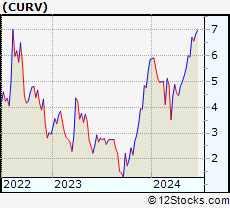 | CURV Torrid Holdings Inc. |
| Sector: Services & Goods | |
| SubSector: Apparel Retail | |
| MarketCap: 278 Millions | |
| Recent Price: 6.00 Smart Investing & Trading Score: 90 | |
| Day Percent Change: 0.67% Day Change: 0.04 | |
| Week Change: 8.7% Year-to-date Change: 2.6% | |
| CURV Links: Profile News Message Board | |
| Charts:- Daily , Weekly | |
| Add CURV to Watchlist: View: Get Complete CURV Trend Analysis ➞ | |
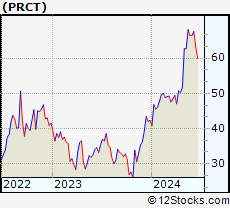 | PRCT PROCEPT BioRobotics Corporation |
| Sector: Health Care | |
| SubSector: Medical Devices | |
| MarketCap: 1600 Millions | |
| Recent Price: 68.10 Smart Investing & Trading Score: 83 | |
| Day Percent Change: -0.06% Day Change: -0.04 | |
| Week Change: 8.7% Year-to-date Change: 60.8% | |
| PRCT Links: Profile News Message Board | |
| Charts:- Daily , Weekly | |
| Add PRCT to Watchlist: View: Get Complete PRCT Trend Analysis ➞ | |
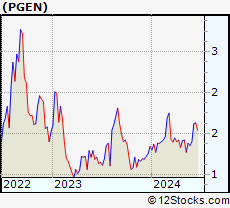 | PGEN Precigen, Inc. |
| Sector: Health Care | |
| SubSector: Biotechnology | |
| MarketCap: 564.785 Millions | |
| Recent Price: 1.38 Smart Investing & Trading Score: 30 | |
| Day Percent Change: -1.43% Day Change: -0.02 | |
| Week Change: 8.66% Year-to-date Change: 3.0% | |
| PGEN Links: Profile News Message Board | |
| Charts:- Daily , Weekly | |
| Add PGEN to Watchlist: View: Get Complete PGEN Trend Analysis ➞ | |
| Too many stocks? View smallcap stocks filtered by marketcap & sector |
| Marketcap: All SmallCap Stocks (default-no microcap), Large, Mid-Range, Small & MicroCap |
| Sector: Tech, Finance, Energy, Staples, Retail, Industrial, Materials, Utilities & Medical |
|
Best Stocks Today 12Stocks.com |
© 2024 12Stocks.com Terms & Conditions Privacy Contact Us
All Information Provided Only For Education And Not To Be Used For Investing or Trading. See Terms & Conditions


One More Thing ... Get Best Stocks Delivered Daily!
Never Ever Miss A Move With Our Top Ten Stocks Lists
Find Best Stocks In Any Market - Bull or Bear Market
Take A Peek At Our Top Ten Stocks Lists: Daily, Weekly, Year-to-Date & Top Trends
Find Best Stocks In Any Market - Bull or Bear Market
Take A Peek At Our Top Ten Stocks Lists: Daily, Weekly, Year-to-Date & Top Trends
Smallcap Stocks With Best Up Trends [0-bearish to 100-bullish]: CommScope Holding[100], Coeur Mining[100], Hecla Mining[100], MicroStrategy [100], Enovix [100], Rayonier Advanced[100], Nurix [100], Energy Fuels[100], NovaGold Resources[100], Piedmont Lithium[100], Wave Life[100]
Best Smallcap Stocks Year-to-Date:
CareMax [495.88%], Bakkt [413.9%], Janux [338.34%], Viking [260.02%], Alpine Immune[241.23%], Longboard [238.63%], Avidity Biosciences[226.33%], Super Micro[212.35%], Arcutis Bio[184.83%], Sweetgreen [180.97%], Novavax [171.04%] Best Smallcap Stocks This Week:
Vaxxinity [58.82%], Novavax [46.51%], Vicarious Surgical[45.62%], Harrow Health[44.48%], ProKidney [44.31%], Workhorse Group[36.06%], Maxeon Solar[35.94%], Fossil Group[35.44%], Humacyte [34.68%], MicroStrategy [34.23%], Cadiz [33.48%] Best Smallcap Stocks Daily:
Vaxxinity [45.95%], Presto Automation[31.90%], Vicarious Surgical[27.93%], Orchestra BioMed[12.77%], CommScope Holding[11.86%], Coeur Mining[11.57%], Hecla Mining[11.11%], MicroStrategy [10.04%], Tenaya [9.65%], Bakkt [9.25%], Enovix [9.25%]