
 Login Sign Up


| |||||
 |  | ||||

| 12Stocks.com Market Intelligence |
Best SmallCap Stocks
|
| In a hurry? Small Cap Stock Lists: Performance Trends Table, Stock Charts
Sort Small Cap stocks: Daily, Weekly, Year-to-Date, Market Cap & Trends. Filter Small Cap stocks list by sector: Show all, Tech, Finance, Energy, Staples, Retail, Industrial, Materials, Utilities and HealthCare Filter Small Cap stocks list by size: All Large Medium Small and MicroCap |
| 12Stocks.com Small Cap Stocks Performances & Trends Daily | |||||||||
|
|  The overall Smart Investing & Trading Score is 76 (0-bearish to 100-bullish) which puts Small Cap index in short term neutral to bullish trend. The Smart Investing & Trading Score from previous trading session is 90 and hence a deterioration of trend.
| ||||||||
Here are the Smart Investing & Trading Scores of the most requested small cap stocks at 12Stocks.com (click stock name for detailed review):
|


| 12Stocks.com: Investing in Smallcap Index with Stocks | |
|
The following table helps investors and traders sort through current performance and trends (as measured by Smart Investing & Trading Score) of various
stocks in the Smallcap Index. Quick View: Move mouse or cursor over stock symbol (ticker) to view short-term technical chart and over stock name to view long term chart. Click on  to add stock symbol to your watchlist and to add stock symbol to your watchlist and  to view watchlist. Click on any ticker or stock name for detailed market intelligence report for that stock. to view watchlist. Click on any ticker or stock name for detailed market intelligence report for that stock. |
12Stocks.com Performance of Stocks in Smallcap Index
| Ticker | Stock Name | Watchlist | Category | Recent Price | Smart Investing & Trading Score | Change % | Weekly Change% |
| SAVA | Cassava Sciences |   | Health Care | 23.12 | 72 | 7.24% | 14.29% |
| PHR | Phreesia | | Technology | 24.31 | 74 | 1.08% | 14.21% |
| TMCI | Treace Medical | | Health Care | 5.00 | 10 | -11.19% | 14.16% |
| BEAM | Beam | | Health Care | 24.62 | 64 | 3.49% | 14.14% |
| PACB | Pacific Biosciences | | Health Care | 2.02 | 32 | -7.76% | 14.12% |
| DC | Dakota Gold | | Materials | 3.00 | 100 | -0.33% | 14.07% |
| CVRX | CVRx | | Health Care | 8.29 | 42 | 2.60% | 14.03% |
| HL | Hecla Mining | | Materials | 6.10 | 100 | 11.11% | 14.02% |
| CERS | Cerus | | Health Care | 1.97 | 42 | 0.51% | 13.87% |
| RNA | Avidity Biosciences | | Health Care | 29.50 | 100 | 2.72% | 13.64% |
| MEI | Methode Electronics | | Technology | 12.35 | 67 | 0.65% | 13.62% |
| DOUG | Douglas Elliman | | Financials | 1.34 | 57 | -4.96% | 13.56% |
| SKYT | SkyWater | | Technology | 8.67 | 32 | 6.91% | 13.48% |
| ACDC | ProFrac Holding | | Energy | 9.01 | 100 | 5.38% | 13.48% |
| PHAT | Phathom | | Health Care | 10.54 | 55 | -1.40% | 12.61% |
| IMMR | Immersion | | Technology | 9.34 | 88 | 0.00% | 12.53% |
| XERS | Xeris | | Health Care | 1.98 | 47 | -1.98% | 12.50% |
| BHIL | Benson Hill | | Materials | 0.23 | 52 | -0.70% | 12.50% |
| CWK | Cushman & Wakefield | | Financials | 11.72 | 100 | 0.60% | 12.42% |
| BLFS | BioLife Solutions | | Health Care | 21.96 | 68 | -2.31% | 12.38% |
| ARWR | Arrowhead | | Health Care | 24.79 | 50 | -0.86% | 12.27% |
| PETS | PetMed Express | | Health Care | 4.58 | 42 | -0.33% | 12.25% |
| SFIX | Stitch Fix | | Services & Goods | 2.35 | 37 | -1.67% | 11.90% |
| TWST | Twist Bioscience | | Health Care | 47.01 | 68 | 1.10% | 11.80% |
| CYH | Community Health | | Health Care | 3.61 | 68 | -2.70% | 11.76% |


| Too many stocks? View smallcap stocks filtered by marketcap & sector |
| Marketcap: All SmallCap Stocks (default-no microcap), Large, Mid-Range, Small |
| Smallcap Sector: Tech, Finance, Energy, Staples, Retail, Industrial, Materials, & Medical |
|
Get the most comprehensive stock market coverage daily at 12Stocks.com ➞ Best Stocks Today ➞ Best Stocks Weekly ➞ Best Stocks Year-to-Date ➞ Best Stocks Trends ➞  Best Stocks Today 12Stocks.com Best Nasdaq Stocks ➞ Best S&P 500 Stocks ➞ Best Tech Stocks ➞ Best Biotech Stocks ➞ |
| Detailed Overview of SmallCap Stocks |
| SmallCap Technical Overview, Leaders & Laggards, Top SmallCap ETF Funds & Detailed SmallCap Stocks List, Charts, Trends & More |
| Smallcap: Technical Analysis, Trends & YTD Performance | |
| SmallCap segment as represented by
IWM, an exchange-traded fund [ETF], holds basket of thousands of smallcap stocks from across all major sectors of the US stock market. The smallcap index (contains stocks like Riverbed & Sotheby's) is up by 3.67% and is currently underperforming the overall market by -6.9% year-to-date. Below is a quick view of technical charts and trends: | |
 IWM Weekly Chart |
|
| Long Term Trend: Very Good | |
| Medium Term Trend: Very Good | |
 IWM Daily Chart |
|
| Short Term Trend: Good | |
| Overall Trend Score: 76 | |
| YTD Performance: 3.67% | |
| **Trend Scores & Views Are Only For Educational Purposes And Not For Investing | |
| 12Stocks.com: Top Performing Small Cap Index Stocks | ||||||||||||||||||||||||||||||||||||||||||||||||
 The top performing Small Cap Index stocks year to date are
Now, more recently, over last week, the top performing Small Cap Index stocks on the move are


|
||||||||||||||||||||||||||||||||||||||||||||||||
| 12Stocks.com: Investing in Smallcap Index using Exchange Traded Funds | |
|
The following table shows list of key exchange traded funds (ETF) that
help investors track Smallcap index. The following list also includes leveraged ETF funds that track twice or thrice the daily returns of Smallcap indices. Short or inverse ETF funds move in the opposite direction to the index they track and are useful during market pullbacks or during bear markets. Quick View: Move mouse or cursor over ETF symbol (ticker) to view short-term technical chart and over ETF name to view long term chart. Click on ticker or stock name for detailed view. Click on to add stock symbol to your watchlist and to view watchlist. |
12Stocks.com List of ETFs that track Smallcap Index
| Ticker | ETF Name | Watchlist | Recent Price | Smart Investing & Trading Score | Change % | Week % | Year-to-date % |
| IWM | iShares Russell 2000 | | 208.08 | 76 | 0.07 | 1.85 | 3.67% |
| VTWO | Vanguard Russell 2000 ETF | | 84.11 | 71 | 0.00 | 1.8 | 3.71% |
| IJR | iShares Core S&P Small-Cap | | 110.39 | 68 | -0.22 | 1.29 | 1.98% |
| IWN | iShares Russell 2000 Value | | 158.71 | 76 | -0.07 | 1.61 | 2.18% |
| IWO | iShares Russell 2000 Growth | | 265.15 | 63 | -0.75 | 2.01 | 5.13% |
| IJS | iShares S&P Small-Cap 600 Value | | 101.87 | 76 | -0.15 | 1.34 | -1.16% |
| IJT | iShares S&P Small-Cap 600 Growth | | 131.34 | 71 | 0.04 | 1.14 | 4.95% |
| XSLV | PowerShares S&P SmallCap Low Volatil ETF | | 44.48 | 83 | -0.01 | 0.55 | 0.74% |
| SAA | ProShares Ultra SmallCap600 | | 24.90 | 71 | 0.50 | 2.28 | -0.18% |
| SMLV | SPDR SSGA US Small Cap Low Volatil ETF | | 113.28 | 95 | 0.43 | 1.85 | 0.68% |
| SDD | ProShares UltraShort SmallCap600 | | 17.84 | 35 | 0.96 | -2.41 | -3.19% |
| SBB | ProShares Short SmallCap600 | | 15.77 | 25 | 0.41 | -1.14 | -0.98% |
| 12Stocks.com: Charts, Trends, Fundamental Data and Performances of SmallCap Stocks | |
|
We now take in-depth look at all SmallCap stocks including charts, multi-period performances and overall trends (as measured by Smart Investing & Trading Score). One can sort SmallCap stocks (click link to choose) by Daily, Weekly and by Year-to-Date performances. Also, one can sort by size of the company or by market capitalization. |
| Select Your Default Chart Type: | |||||
| |||||
| Click on stock symbol or name for detailed view. Click on to add stock symbol to your watchlist and to view watchlist. Quick View: Move mouse or cursor over "Daily" to quickly view daily technical stock chart and over "Weekly" to view weekly technical stock chart. | |||||

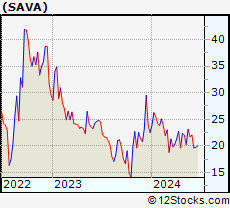 | SAVA Cassava Sciences, Inc. |
| Sector: Health Care | |
| SubSector: Biotechnology | |
| MarketCap: 86.6785 Millions | |
| Recent Price: 23.12 Smart Investing & Trading Score: 72 | |
| Day Percent Change: 7.24% Day Change: 1.56 | |
| Week Change: 14.29% Year-to-date Change: 2.7% | |
| SAVA Links: Profile News Message Board | |
| Charts:- Daily , Weekly | |
| Add SAVA to Watchlist: View: Get Complete SAVA Trend Analysis ➞ | |
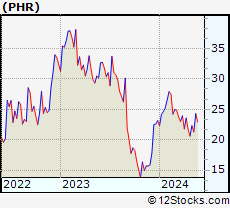 | PHR Phreesia, Inc. |
| Sector: Technology | |
| SubSector: Healthcare Information Services | |
| MarketCap: 810.255 Millions | |
| Recent Price: 24.31 Smart Investing & Trading Score: 74 | |
| Day Percent Change: 1.08% Day Change: 0.26 | |
| Week Change: 14.21% Year-to-date Change: 5.0% | |
| PHR Links: Profile News Message Board | |
| Charts:- Daily , Weekly | |
| Add PHR to Watchlist: View: Get Complete PHR Trend Analysis ➞ | |
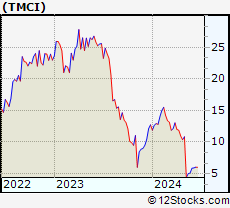 | TMCI Treace Medical Concepts, Inc. |
| Sector: Health Care | |
| SubSector: Medical Devices | |
| MarketCap: 1550 Millions | |
| Recent Price: 5.00 Smart Investing & Trading Score: 10 | |
| Day Percent Change: -11.19% Day Change: -0.63 | |
| Week Change: 14.16% Year-to-date Change: -60.8% | |
| TMCI Links: Profile News Message Board | |
| Charts:- Daily , Weekly | |
| Add TMCI to Watchlist: View: Get Complete TMCI Trend Analysis ➞ | |
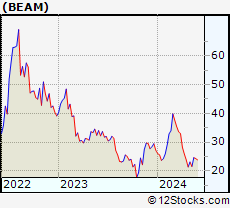 | BEAM Beam Therapeutics Inc. |
| Sector: Health Care | |
| SubSector: Biotechnology | |
| MarketCap: 44987 Millions | |
| Recent Price: 24.62 Smart Investing & Trading Score: 64 | |
| Day Percent Change: 3.49% Day Change: 0.83 | |
| Week Change: 14.14% Year-to-date Change: -9.6% | |
| BEAM Links: Profile News Message Board | |
| Charts:- Daily , Weekly | |
| Add BEAM to Watchlist: View: Get Complete BEAM Trend Analysis ➞ | |
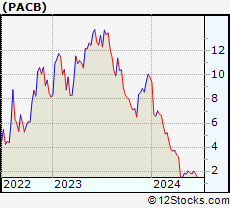 | PACB Pacific Biosciences of California, Inc. |
| Sector: Health Care | |
| SubSector: Biotechnology | |
| MarketCap: 470.685 Millions | |
| Recent Price: 2.02 Smart Investing & Trading Score: 32 | |
| Day Percent Change: -7.76% Day Change: -0.17 | |
| Week Change: 14.12% Year-to-date Change: -79.4% | |
| PACB Links: Profile News Message Board | |
| Charts:- Daily , Weekly | |
| Add PACB to Watchlist: View: Get Complete PACB Trend Analysis ➞ | |
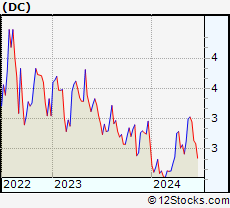 | DC Dakota Gold Corp. |
| Sector: Materials | |
| SubSector: Gold | |
| MarketCap: 218 Millions | |
| Recent Price: 3.00 Smart Investing & Trading Score: 100 | |
| Day Percent Change: -0.33% Day Change: -0.01 | |
| Week Change: 14.07% Year-to-date Change: 15.4% | |
| DC Links: Profile News Message Board | |
| Charts:- Daily , Weekly | |
| Add DC to Watchlist: View: Get Complete DC Trend Analysis ➞ | |
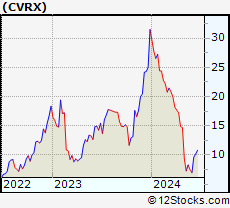 | CVRX CVRx, Inc. |
| Sector: Health Care | |
| SubSector: Medical Devices | |
| MarketCap: 327 Millions | |
| Recent Price: 8.29 Smart Investing & Trading Score: 42 | |
| Day Percent Change: 2.60% Day Change: 0.21 | |
| Week Change: 14.03% Year-to-date Change: -73.7% | |
| CVRX Links: Profile News Message Board | |
| Charts:- Daily , Weekly | |
| Add CVRX to Watchlist: View: Get Complete CVRX Trend Analysis ➞ | |
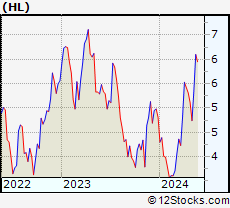 | HL Hecla Mining Company |
| Sector: Materials | |
| SubSector: Gold | |
| MarketCap: 1048.49 Millions | |
| Recent Price: 6.10 Smart Investing & Trading Score: 100 | |
| Day Percent Change: 11.11% Day Change: 0.61 | |
| Week Change: 14.02% Year-to-date Change: 26.8% | |
| HL Links: Profile News Message Board | |
| Charts:- Daily , Weekly | |
| Add HL to Watchlist: View: Get Complete HL Trend Analysis ➞ | |
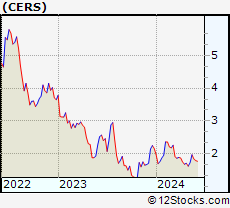 | CERS Cerus Corporation |
| Sector: Health Care | |
| SubSector: Biotechnology | |
| MarketCap: 607.185 Millions | |
| Recent Price: 1.97 Smart Investing & Trading Score: 42 | |
| Day Percent Change: 0.51% Day Change: 0.01 | |
| Week Change: 13.87% Year-to-date Change: -8.8% | |
| CERS Links: Profile News Message Board | |
| Charts:- Daily , Weekly | |
| Add CERS to Watchlist: View: Get Complete CERS Trend Analysis ➞ | |
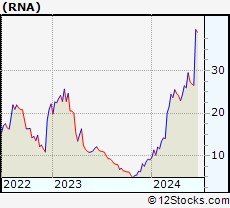 | RNA Avidity Biosciences, Inc. |
| Sector: Health Care | |
| SubSector: Biotechnology | |
| MarketCap: 12287 Millions | |
| Recent Price: 29.50 Smart Investing & Trading Score: 100 | |
| Day Percent Change: 2.72% Day Change: 0.78 | |
| Week Change: 13.64% Year-to-date Change: 226.3% | |
| RNA Links: Profile News Message Board | |
| Charts:- Daily , Weekly | |
| Add RNA to Watchlist: View: Get Complete RNA Trend Analysis ➞ | |
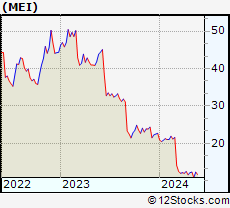 | MEI Methode Electronics, Inc. |
| Sector: Technology | |
| SubSector: Diversified Electronics | |
| MarketCap: 941.896 Millions | |
| Recent Price: 12.35 Smart Investing & Trading Score: 67 | |
| Day Percent Change: 0.65% Day Change: 0.08 | |
| Week Change: 13.62% Year-to-date Change: -45.7% | |
| MEI Links: Profile News Message Board | |
| Charts:- Daily , Weekly | |
| Add MEI to Watchlist: View: Get Complete MEI Trend Analysis ➞ | |
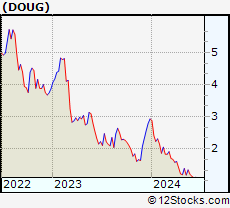 | DOUG Douglas Elliman Inc. |
| Sector: Financials | |
| SubSector: Financials Services | |
| MarketCap: 197 Millions | |
| Recent Price: 1.34 Smart Investing & Trading Score: 57 | |
| Day Percent Change: -4.96% Day Change: -0.07 | |
| Week Change: 13.56% Year-to-date Change: -54.3% | |
| DOUG Links: Profile News Message Board | |
| Charts:- Daily , Weekly | |
| Add DOUG to Watchlist: View: Get Complete DOUG Trend Analysis ➞ | |
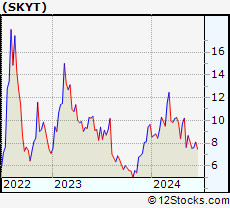 | SKYT SkyWater Technology, Inc. |
| Sector: Technology | |
| SubSector: Semiconductors | |
| MarketCap: 394 Millions | |
| Recent Price: 8.67 Smart Investing & Trading Score: 32 | |
| Day Percent Change: 6.91% Day Change: 0.56 | |
| Week Change: 13.48% Year-to-date Change: -10.1% | |
| SKYT Links: Profile News Message Board | |
| Charts:- Daily , Weekly | |
| Add SKYT to Watchlist: View: Get Complete SKYT Trend Analysis ➞ | |
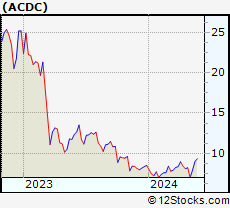 | ACDC ProFrac Holding Corp. |
| Sector: Energy | |
| SubSector: Oil & Gas Equipment & Services | |
| MarketCap: 1830 Millions | |
| Recent Price: 9.01 Smart Investing & Trading Score: 100 | |
| Day Percent Change: 5.38% Day Change: 0.46 | |
| Week Change: 13.48% Year-to-date Change: 5.9% | |
| ACDC Links: Profile News Message Board | |
| Charts:- Daily , Weekly | |
| Add ACDC to Watchlist: View: Get Complete ACDC Trend Analysis ➞ | |
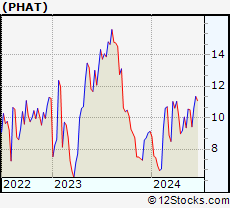 | PHAT Phathom Pharmaceuticals, Inc. |
| Sector: Health Care | |
| SubSector: Biotechnology | |
| MarketCap: 728.785 Millions | |
| Recent Price: 10.54 Smart Investing & Trading Score: 55 | |
| Day Percent Change: -1.40% Day Change: -0.15 | |
| Week Change: 12.61% Year-to-date Change: 15.4% | |
| PHAT Links: Profile News Message Board | |
| Charts:- Daily , Weekly | |
| Add PHAT to Watchlist: View: Get Complete PHAT Trend Analysis ➞ | |
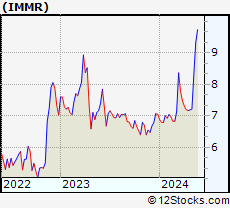 | IMMR Immersion Corporation |
| Sector: Technology | |
| SubSector: Application Software | |
| MarketCap: 173.462 Millions | |
| Recent Price: 9.34 Smart Investing & Trading Score: 88 | |
| Day Percent Change: 0.00% Day Change: 0.00 | |
| Week Change: 12.53% Year-to-date Change: 32.3% | |
| IMMR Links: Profile News Message Board | |
| Charts:- Daily , Weekly | |
| Add IMMR to Watchlist: View: Get Complete IMMR Trend Analysis ➞ | |
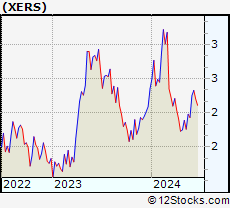 | XERS Xeris Pharmaceuticals, Inc. |
| Sector: Health Care | |
| SubSector: Biotechnology | |
| MarketCap: 74.5785 Millions | |
| Recent Price: 1.98 Smart Investing & Trading Score: 47 | |
| Day Percent Change: -1.98% Day Change: -0.04 | |
| Week Change: 12.5% Year-to-date Change: -15.9% | |
| XERS Links: Profile News Message Board | |
| Charts:- Daily , Weekly | |
| Add XERS to Watchlist: View: Get Complete XERS Trend Analysis ➞ | |
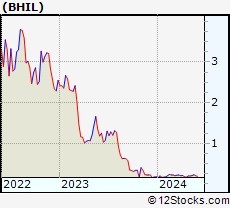 | BHIL Benson Hill, Inc. |
| Sector: Materials | |
| SubSector: Agricultural Inputs | |
| MarketCap: 236 Millions | |
| Recent Price: 0.23 Smart Investing & Trading Score: 52 | |
| Day Percent Change: -0.70% Day Change: 0.00 | |
| Week Change: 12.5% Year-to-date Change: 28.6% | |
| BHIL Links: Profile News Message Board | |
| Charts:- Daily , Weekly | |
| Add BHIL to Watchlist: View: Get Complete BHIL Trend Analysis ➞ | |
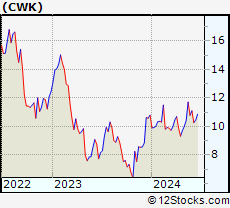 | CWK Cushman & Wakefield plc |
| Sector: Financials | |
| SubSector: Property Management | |
| MarketCap: 2651.62 Millions | |
| Recent Price: 11.72 Smart Investing & Trading Score: 100 | |
| Day Percent Change: 0.60% Day Change: 0.07 | |
| Week Change: 12.42% Year-to-date Change: 8.5% | |
| CWK Links: Profile News Message Board | |
| Charts:- Daily , Weekly | |
| Add CWK to Watchlist: View: Get Complete CWK Trend Analysis ➞ | |
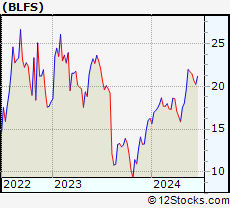 | BLFS BioLife Solutions, Inc. |
| Sector: Health Care | |
| SubSector: Medical Instruments & Supplies | |
| MarketCap: 264.36 Millions | |
| Recent Price: 21.96 Smart Investing & Trading Score: 68 | |
| Day Percent Change: -2.31% Day Change: -0.52 | |
| Week Change: 12.38% Year-to-date Change: 35.1% | |
| BLFS Links: Profile News Message Board | |
| Charts:- Daily , Weekly | |
| Add BLFS to Watchlist: View: Get Complete BLFS Trend Analysis ➞ | |
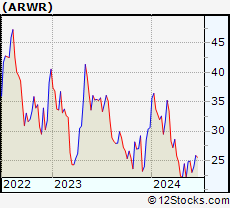 | ARWR Arrowhead Pharmaceuticals, Inc. |
| Sector: Health Care | |
| SubSector: Biotechnology | |
| MarketCap: 3226.15 Millions | |
| Recent Price: 24.79 Smart Investing & Trading Score: 50 | |
| Day Percent Change: -0.86% Day Change: -0.21 | |
| Week Change: 12.27% Year-to-date Change: -19.0% | |
| ARWR Links: Profile News Message Board | |
| Charts:- Daily , Weekly | |
| Add ARWR to Watchlist: View: Get Complete ARWR Trend Analysis ➞ | |
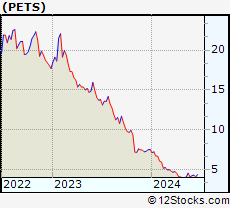 | PETS PetMed Express, Inc. |
| Sector: Health Care | |
| SubSector: Drug Delivery | |
| MarketCap: 528.23 Millions | |
| Recent Price: 4.58 Smart Investing & Trading Score: 42 | |
| Day Percent Change: -0.33% Day Change: -0.01 | |
| Week Change: 12.25% Year-to-date Change: -39.4% | |
| PETS Links: Profile News Message Board | |
| Charts:- Daily , Weekly | |
| Add PETS to Watchlist: View: Get Complete PETS Trend Analysis ➞ | |
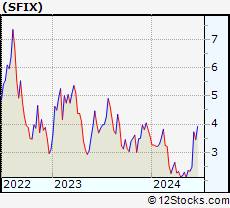 | SFIX Stitch Fix, Inc. |
| Sector: Services & Goods | |
| SubSector: Specialty Retail, Other | |
| MarketCap: 1693.64 Millions | |
| Recent Price: 2.35 Smart Investing & Trading Score: 37 | |
| Day Percent Change: -1.67% Day Change: -0.04 | |
| Week Change: 11.9% Year-to-date Change: -34.2% | |
| SFIX Links: Profile News Message Board | |
| Charts:- Daily , Weekly | |
| Add SFIX to Watchlist: View: Get Complete SFIX Trend Analysis ➞ | |
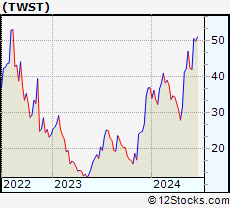 | TWST Twist Bioscience Corporation |
| Sector: Health Care | |
| SubSector: Medical Laboratories & Research | |
| MarketCap: 1065 Millions | |
| Recent Price: 47.01 Smart Investing & Trading Score: 68 | |
| Day Percent Change: 1.10% Day Change: 0.51 | |
| Week Change: 11.8% Year-to-date Change: 27.5% | |
| TWST Links: Profile News Message Board | |
| Charts:- Daily , Weekly | |
| Add TWST to Watchlist: View: Get Complete TWST Trend Analysis ➞ | |
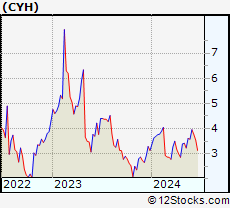 | CYH Community Health Systems, Inc. |
| Sector: Health Care | |
| SubSector: Hospitals | |
| MarketCap: 371.546 Millions | |
| Recent Price: 3.61 Smart Investing & Trading Score: 68 | |
| Day Percent Change: -2.70% Day Change: -0.10 | |
| Week Change: 11.76% Year-to-date Change: 15.3% | |
| CYH Links: Profile News Message Board | |
| Charts:- Daily , Weekly | |
| Add CYH to Watchlist: View: Get Complete CYH Trend Analysis ➞ | |
| Too many stocks? View smallcap stocks filtered by marketcap & sector |
| Marketcap: All SmallCap Stocks (default-no microcap), Large, Mid-Range, Small & MicroCap |
| Sector: Tech, Finance, Energy, Staples, Retail, Industrial, Materials, Utilities & Medical |
|
Best Stocks Today 12Stocks.com |
© 2024 12Stocks.com Terms & Conditions Privacy Contact Us
All Information Provided Only For Education And Not To Be Used For Investing or Trading. See Terms & Conditions


One More Thing ... Get Best Stocks Delivered Daily!
Never Ever Miss A Move With Our Top Ten Stocks Lists
Find Best Stocks In Any Market - Bull or Bear Market
Take A Peek At Our Top Ten Stocks Lists: Daily, Weekly, Year-to-Date & Top Trends
Find Best Stocks In Any Market - Bull or Bear Market
Take A Peek At Our Top Ten Stocks Lists: Daily, Weekly, Year-to-Date & Top Trends
Smallcap Stocks With Best Up Trends [0-bearish to 100-bullish]: CommScope Holding[100], Coeur Mining[100], Hecla Mining[100], MicroStrategy [100], Enovix [100], Rayonier Advanced[100], Nurix [100], Energy Fuels[100], NovaGold Resources[100], Piedmont Lithium[100], Wave Life[100]
Best Smallcap Stocks Year-to-Date:
CareMax [495.88%], Bakkt [413.9%], Janux [338.34%], Viking [260.02%], Alpine Immune[241.23%], Longboard [238.63%], Avidity Biosciences[226.33%], Super Micro[212.35%], Arcutis Bio[184.83%], Sweetgreen [180.97%], Novavax [171.04%] Best Smallcap Stocks This Week:
Vaxxinity [58.82%], Novavax [46.51%], Vicarious Surgical[45.62%], Harrow Health[44.48%], ProKidney [44.31%], Workhorse Group[36.06%], Maxeon Solar[35.94%], Fossil Group[35.44%], Humacyte [34.68%], MicroStrategy [34.23%], Cadiz [33.48%] Best Smallcap Stocks Daily:
Vaxxinity [45.95%], Presto Automation[31.90%], Vicarious Surgical[27.93%], Orchestra BioMed[12.77%], CommScope Holding[11.86%], Coeur Mining[11.57%], Hecla Mining[11.11%], MicroStrategy [10.04%], Tenaya [9.65%], Bakkt [9.25%], Enovix [9.25%]