
 Login Sign Up


| |||||
 |  | ||||

| 12Stocks.com Market Intelligence |
Best SmallCap Stocks
|
| In a hurry? Small Cap Stock Lists: Performance Trends Table, Stock Charts
Sort Small Cap stocks: Daily, Weekly, Year-to-Date, Market Cap & Trends. Filter Small Cap stocks list by sector: Show all, Tech, Finance, Energy, Staples, Retail, Industrial, Materials, Utilities and HealthCare Filter Small Cap stocks list by size: All Large Medium Small and MicroCap |
| 12Stocks.com Small Cap Stocks Performances & Trends Daily | |||||||||
|
|  The overall Smart Investing & Trading Score is 76 (0-bearish to 100-bullish) which puts Small Cap index in short term neutral to bullish trend. The Smart Investing & Trading Score from previous trading session is 90 and hence a deterioration of trend.
| ||||||||
Here are the Smart Investing & Trading Scores of the most requested small cap stocks at 12Stocks.com (click stock name for detailed review):
|


| 12Stocks.com: Investing in Smallcap Index with Stocks | |
|
The following table helps investors and traders sort through current performance and trends (as measured by Smart Investing & Trading Score) of various
stocks in the Smallcap Index. Quick View: Move mouse or cursor over stock symbol (ticker) to view short-term technical chart and over stock name to view long term chart. Click on  to add stock symbol to your watchlist and to add stock symbol to your watchlist and  to view watchlist. Click on any ticker or stock name for detailed market intelligence report for that stock. to view watchlist. Click on any ticker or stock name for detailed market intelligence report for that stock. |
12Stocks.com Performance of Stocks in Smallcap Index
| Ticker | Stock Name | Watchlist | Category | Recent Price | Smart Investing & Trading Score | Change % | Weekly Change% |
| FA | First Advantage |   | Industrials | 16.40 | 73 | 0.37% | 2.56% |
| DNOW | NOW | | Energy | 13.62 | 8 | -2.71% | 2.56% |
| FBNC | First Bancorp | | Financials | 32.60 | 74 | 1.09% | 2.52% |
| FCF | First Commonwealth | | Financials | 14.24 | 100 | 0.85% | 2.52% |
| ROIC | Retail Opportunity | | Financials | 12.75 | 74 | 0.79% | 2.49% |
| MORF | Morphic Holding | | Health Care | 29.23 | 50 | -9.92% | 2.49% |
| NSSC | Napco Security | | Services & Goods | 45.50 | 95 | 1.54% | 2.48% |
| CAC | Camden National | | Financials | 33.19 | 83 | 0.24% | 2.47% |
| OEC | Orion Engineered | | Materials | 25.69 | 95 | -0.16% | 2.47% |
| VLY | Valley National | | Financials | 7.92 | 42 | 1.28% | 2.46% |
| OFIX | Orthofix Medical | | Health Care | 15.00 | 68 | -0.73% | 2.46% |
| PWOD | Penns Woods | | Financials | 19.57 | 90 | 0.46% | 2.46% |
| KW | Kennedy-Wilson | | Financials | 10.40 | 68 | -0.67% | 2.46% |
| LZB | La-Z-Boy | | Consumer Staples | 36.33 | 59 | 0.83% | 2.45% |
| MTW | Manitowoc | | Industrials | 12.56 | 25 | -0.16% | 2.45% |
| HLF | Herbalife Nutrition | | Consumer Staples | 10.89 | 68 | -1.71% | 2.45% |
| CALX | Calix | | Technology | 31.38 | 42 | 0.61% | 2.45% |
| XNCR | Xencor | | Health Care | 23.03 | 80 | 2.54% | 2.45% |
| LNZA | LanzaTech Global | | Industrials | 2.51 | 32 | -1.18% | 2.45% |
| INVA | Innoviva | | Health Care | 15.98 | 70 | 0.00% | 2.44% |
| BWFG | Bankwell Financial | | Financials | 24.32 | 64 | 1.67% | 2.44% |
| WSBC | WesBanco | | Financials | 29.11 | 87 | 1.15% | 2.43% |
| HQY | HealthEquity | | Technology | 79.21 | 42 | 1.03% | 2.43% |
| FCPT | Four Corners | | Financials | 25.05 | 76 | 0.20% | 2.43% |
| INST | Instructure | | Technology | 20.27 | 64 | 0.20% | 2.43% |


| Too many stocks? View smallcap stocks filtered by marketcap & sector |
| Marketcap: All SmallCap Stocks (default-no microcap), Large, Mid-Range, Small |
| Smallcap Sector: Tech, Finance, Energy, Staples, Retail, Industrial, Materials, & Medical |
|
Get the most comprehensive stock market coverage daily at 12Stocks.com ➞ Best Stocks Today ➞ Best Stocks Weekly ➞ Best Stocks Year-to-Date ➞ Best Stocks Trends ➞  Best Stocks Today 12Stocks.com Best Nasdaq Stocks ➞ Best S&P 500 Stocks ➞ Best Tech Stocks ➞ Best Biotech Stocks ➞ |
| Detailed Overview of SmallCap Stocks |
| SmallCap Technical Overview, Leaders & Laggards, Top SmallCap ETF Funds & Detailed SmallCap Stocks List, Charts, Trends & More |
| Smallcap: Technical Analysis, Trends & YTD Performance | |
| SmallCap segment as represented by
IWM, an exchange-traded fund [ETF], holds basket of thousands of smallcap stocks from across all major sectors of the US stock market. The smallcap index (contains stocks like Riverbed & Sotheby's) is up by 3.67% and is currently underperforming the overall market by -6.9% year-to-date. Below is a quick view of technical charts and trends: | |
 IWM Weekly Chart |
|
| Long Term Trend: Very Good | |
| Medium Term Trend: Very Good | |
 IWM Daily Chart |
|
| Short Term Trend: Good | |
| Overall Trend Score: 76 | |
| YTD Performance: 3.67% | |
| **Trend Scores & Views Are Only For Educational Purposes And Not For Investing | |
| 12Stocks.com: Top Performing Small Cap Index Stocks | ||||||||||||||||||||||||||||||||||||||||||||||||
 The top performing Small Cap Index stocks year to date are
Now, more recently, over last week, the top performing Small Cap Index stocks on the move are


|
||||||||||||||||||||||||||||||||||||||||||||||||
| 12Stocks.com: Investing in Smallcap Index using Exchange Traded Funds | |
|
The following table shows list of key exchange traded funds (ETF) that
help investors track Smallcap index. The following list also includes leveraged ETF funds that track twice or thrice the daily returns of Smallcap indices. Short or inverse ETF funds move in the opposite direction to the index they track and are useful during market pullbacks or during bear markets. Quick View: Move mouse or cursor over ETF symbol (ticker) to view short-term technical chart and over ETF name to view long term chart. Click on ticker or stock name for detailed view. Click on to add stock symbol to your watchlist and to view watchlist. |
12Stocks.com List of ETFs that track Smallcap Index
| Ticker | ETF Name | Watchlist | Recent Price | Smart Investing & Trading Score | Change % | Week % | Year-to-date % |
| IWM | iShares Russell 2000 | | 208.08 | 76 | 0.07 | 1.85 | 3.67% |
| VTWO | Vanguard Russell 2000 ETF | | 84.11 | 71 | 0.00 | 1.8 | 3.71% |
| IJR | iShares Core S&P Small-Cap | | 110.39 | 68 | -0.22 | 1.29 | 1.98% |
| IWN | iShares Russell 2000 Value | | 158.71 | 76 | -0.07 | 1.61 | 2.18% |
| IWO | iShares Russell 2000 Growth | | 265.15 | 63 | -0.75 | 2.01 | 5.13% |
| IJS | iShares S&P Small-Cap 600 Value | | 101.87 | 76 | -0.15 | 1.34 | -1.16% |
| IJT | iShares S&P Small-Cap 600 Growth | | 131.34 | 71 | 0.04 | 1.14 | 4.95% |
| XSLV | PowerShares S&P SmallCap Low Volatil ETF | | 44.48 | 83 | -0.01 | 0.55 | 0.74% |
| SAA | ProShares Ultra SmallCap600 | | 24.90 | 71 | 0.50 | 2.28 | -0.18% |
| SMLV | SPDR SSGA US Small Cap Low Volatil ETF | | 113.28 | 95 | 0.43 | 1.85 | 0.68% |
| SDD | ProShares UltraShort SmallCap600 | | 17.84 | 35 | 0.96 | -2.41 | -3.19% |
| SBB | ProShares Short SmallCap600 | | 15.77 | 25 | 0.41 | -1.14 | -0.98% |
| 12Stocks.com: Charts, Trends, Fundamental Data and Performances of SmallCap Stocks | |
|
We now take in-depth look at all SmallCap stocks including charts, multi-period performances and overall trends (as measured by Smart Investing & Trading Score). One can sort SmallCap stocks (click link to choose) by Daily, Weekly and by Year-to-Date performances. Also, one can sort by size of the company or by market capitalization. |
| Select Your Default Chart Type: | |||||
| |||||
| Click on stock symbol or name for detailed view. Click on to add stock symbol to your watchlist and to view watchlist. Quick View: Move mouse or cursor over "Daily" to quickly view daily technical stock chart and over "Weekly" to view weekly technical stock chart. | |||||

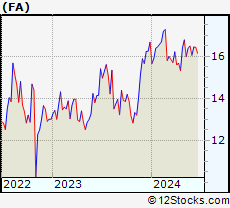 | FA First Advantage Corporation |
| Sector: Industrials | |
| SubSector: Specialty Business Services | |
| MarketCap: 2170 Millions | |
| Recent Price: 16.40 Smart Investing & Trading Score: 73 | |
| Day Percent Change: 0.37% Day Change: 0.06 | |
| Week Change: 2.56% Year-to-date Change: -1.7% | |
| FA Links: Profile News Message Board | |
| Charts:- Daily , Weekly | |
| Add FA to Watchlist: View: Get Complete FA Trend Analysis ➞ | |
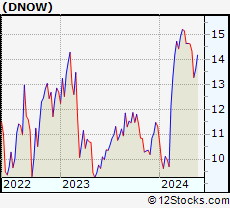 | DNOW NOW Inc. |
| Sector: Energy | |
| SubSector: Oil & Gas Equipment & Services | |
| MarketCap: 679.661 Millions | |
| Recent Price: 13.62 Smart Investing & Trading Score: 8 | |
| Day Percent Change: -2.71% Day Change: -0.38 | |
| Week Change: 2.56% Year-to-date Change: 20.3% | |
| DNOW Links: Profile News Message Board | |
| Charts:- Daily , Weekly | |
| Add DNOW to Watchlist: View: Get Complete DNOW Trend Analysis ➞ | |
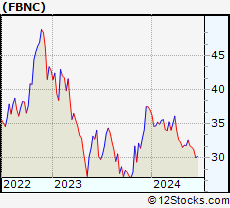 | FBNC First Bancorp |
| Sector: Financials | |
| SubSector: Regional - Mid-Atlantic Banks | |
| MarketCap: 664.959 Millions | |
| Recent Price: 32.60 Smart Investing & Trading Score: 74 | |
| Day Percent Change: 1.09% Day Change: 0.35 | |
| Week Change: 2.52% Year-to-date Change: -11.9% | |
| FBNC Links: Profile News Message Board | |
| Charts:- Daily , Weekly | |
| Add FBNC to Watchlist: View: Get Complete FBNC Trend Analysis ➞ | |
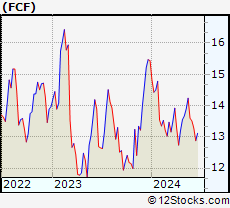 | FCF First Commonwealth Financial Corporation |
| Sector: Financials | |
| SubSector: Regional - Northeast Banks | |
| MarketCap: 900.299 Millions | |
| Recent Price: 14.24 Smart Investing & Trading Score: 100 | |
| Day Percent Change: 0.85% Day Change: 0.12 | |
| Week Change: 2.52% Year-to-date Change: -7.8% | |
| FCF Links: Profile News Message Board | |
| Charts:- Daily , Weekly | |
| Add FCF to Watchlist: View: Get Complete FCF Trend Analysis ➞ | |
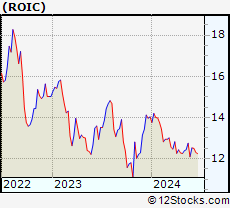 | ROIC Retail Opportunity Investments Corp. |
| Sector: Financials | |
| SubSector: REIT - Retail | |
| MarketCap: 943.414 Millions | |
| Recent Price: 12.75 Smart Investing & Trading Score: 74 | |
| Day Percent Change: 0.79% Day Change: 0.10 | |
| Week Change: 2.49% Year-to-date Change: -9.1% | |
| ROIC Links: Profile News Message Board | |
| Charts:- Daily , Weekly | |
| Add ROIC to Watchlist: View: Get Complete ROIC Trend Analysis ➞ | |
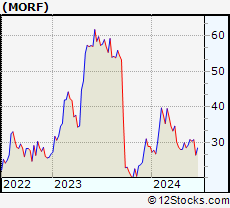 | MORF Morphic Holding, Inc. |
| Sector: Health Care | |
| SubSector: Biotechnology | |
| MarketCap: 484.885 Millions | |
| Recent Price: 29.23 Smart Investing & Trading Score: 50 | |
| Day Percent Change: -9.92% Day Change: -3.22 | |
| Week Change: 2.49% Year-to-date Change: 1.2% | |
| MORF Links: Profile News Message Board | |
| Charts:- Daily , Weekly | |
| Add MORF to Watchlist: View: Get Complete MORF Trend Analysis ➞ | |
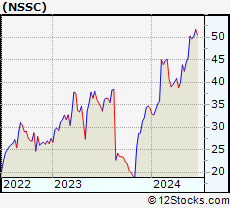 | NSSC Napco Security Technologies, Inc. |
| Sector: Services & Goods | |
| SubSector: Security & Protection Services | |
| MarketCap: 339.103 Millions | |
| Recent Price: 45.50 Smart Investing & Trading Score: 95 | |
| Day Percent Change: 1.54% Day Change: 0.69 | |
| Week Change: 2.48% Year-to-date Change: 32.9% | |
| NSSC Links: Profile News Message Board | |
| Charts:- Daily , Weekly | |
| Add NSSC to Watchlist: View: Get Complete NSSC Trend Analysis ➞ | |
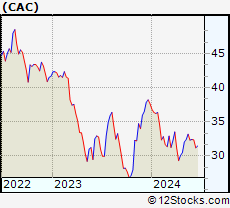 | CAC Camden National Corporation |
| Sector: Financials | |
| SubSector: Regional - Northeast Banks | |
| MarketCap: 550.999 Millions | |
| Recent Price: 33.19 Smart Investing & Trading Score: 83 | |
| Day Percent Change: 0.24% Day Change: 0.08 | |
| Week Change: 2.47% Year-to-date Change: -11.8% | |
| CAC Links: Profile News Message Board | |
| Charts:- Daily , Weekly | |
| Add CAC to Watchlist: View: Get Complete CAC Trend Analysis ➞ | |
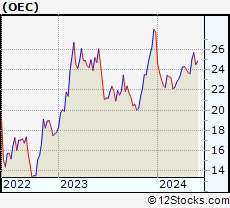 | OEC Orion Engineered Carbons S.A. |
| Sector: Materials | |
| SubSector: Specialty Chemicals | |
| MarketCap: 493.457 Millions | |
| Recent Price: 25.69 Smart Investing & Trading Score: 95 | |
| Day Percent Change: -0.16% Day Change: -0.04 | |
| Week Change: 2.47% Year-to-date Change: -7.4% | |
| OEC Links: Profile News Message Board | |
| Charts:- Daily , Weekly | |
| Add OEC to Watchlist: View: Get Complete OEC Trend Analysis ➞ | |
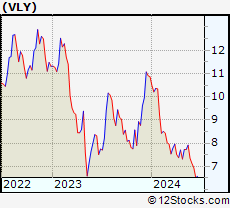 | VLY Valley National Bancorp |
| Sector: Financials | |
| SubSector: Regional - Northeast Banks | |
| MarketCap: 2843.09 Millions | |
| Recent Price: 7.92 Smart Investing & Trading Score: 42 | |
| Day Percent Change: 1.28% Day Change: 0.10 | |
| Week Change: 2.46% Year-to-date Change: -27.1% | |
| VLY Links: Profile News Message Board | |
| Charts:- Daily , Weekly | |
| Add VLY to Watchlist: View: Get Complete VLY Trend Analysis ➞ | |
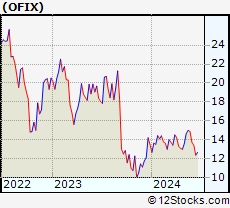 | OFIX Orthofix Medical Inc. |
| Sector: Health Care | |
| SubSector: Medical Appliances & Equipment | |
| MarketCap: 508.18 Millions | |
| Recent Price: 15.00 Smart Investing & Trading Score: 68 | |
| Day Percent Change: -0.73% Day Change: -0.11 | |
| Week Change: 2.46% Year-to-date Change: 11.3% | |
| OFIX Links: Profile News Message Board | |
| Charts:- Daily , Weekly | |
| Add OFIX to Watchlist: View: Get Complete OFIX Trend Analysis ➞ | |
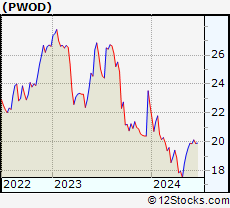 | PWOD Penns Woods Bancorp, Inc. |
| Sector: Financials | |
| SubSector: Regional - Mid-Atlantic Banks | |
| MarketCap: 152.559 Millions | |
| Recent Price: 19.57 Smart Investing & Trading Score: 90 | |
| Day Percent Change: 0.46% Day Change: 0.09 | |
| Week Change: 2.46% Year-to-date Change: -13.1% | |
| PWOD Links: Profile News Message Board | |
| Charts:- Daily , Weekly | |
| Add PWOD to Watchlist: View: Get Complete PWOD Trend Analysis ➞ | |
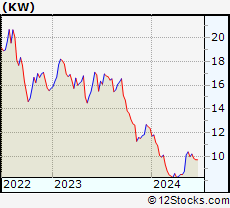 | KW Kennedy-Wilson Holdings, Inc. |
| Sector: Financials | |
| SubSector: Property Management | |
| MarketCap: 2025.42 Millions | |
| Recent Price: 10.40 Smart Investing & Trading Score: 68 | |
| Day Percent Change: -0.67% Day Change: -0.07 | |
| Week Change: 2.46% Year-to-date Change: -16.0% | |
| KW Links: Profile News Message Board | |
| Charts:- Daily , Weekly | |
| Add KW to Watchlist: View: Get Complete KW Trend Analysis ➞ | |
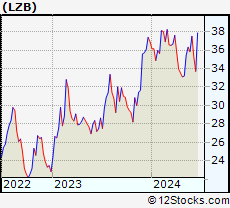 | LZB La-Z-Boy Incorporated |
| Sector: Consumer Staples | |
| SubSector: Home Furnishings & Fixtures | |
| MarketCap: 951.635 Millions | |
| Recent Price: 36.33 Smart Investing & Trading Score: 59 | |
| Day Percent Change: 0.83% Day Change: 0.30 | |
| Week Change: 2.45% Year-to-date Change: -1.6% | |
| LZB Links: Profile News Message Board | |
| Charts:- Daily , Weekly | |
| Add LZB to Watchlist: View: Get Complete LZB Trend Analysis ➞ | |
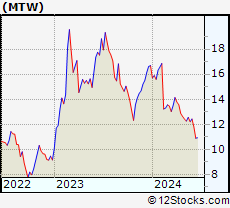 | MTW The Manitowoc Company, Inc. |
| Sector: Industrials | |
| SubSector: Farm & Construction Machinery | |
| MarketCap: 373.707 Millions | |
| Recent Price: 12.56 Smart Investing & Trading Score: 25 | |
| Day Percent Change: -0.16% Day Change: -0.02 | |
| Week Change: 2.45% Year-to-date Change: -24.8% | |
| MTW Links: Profile News Message Board | |
| Charts:- Daily , Weekly | |
| Add MTW to Watchlist: View: Get Complete MTW Trend Analysis ➞ | |
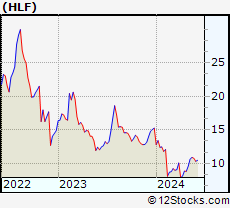 | HLF Herbalife Nutrition Ltd. |
| Sector: Consumer Staples | |
| SubSector: Personal Products | |
| MarketCap: 4884.65 Millions | |
| Recent Price: 10.89 Smart Investing & Trading Score: 68 | |
| Day Percent Change: -1.71% Day Change: -0.19 | |
| Week Change: 2.45% Year-to-date Change: -28.6% | |
| HLF Links: Profile News Message Board | |
| Charts:- Daily , Weekly | |
| Add HLF to Watchlist: View: Get Complete HLF Trend Analysis ➞ | |
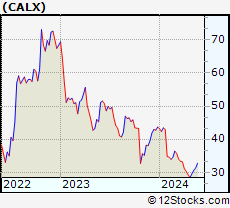 | CALX Calix, Inc. |
| Sector: Technology | |
| SubSector: Communication Equipment | |
| MarketCap: 390.039 Millions | |
| Recent Price: 31.38 Smart Investing & Trading Score: 42 | |
| Day Percent Change: 0.61% Day Change: 0.19 | |
| Week Change: 2.45% Year-to-date Change: -28.2% | |
| CALX Links: Profile News Message Board | |
| Charts:- Daily , Weekly | |
| Add CALX to Watchlist: View: Get Complete CALX Trend Analysis ➞ | |
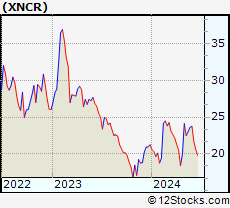 | XNCR Xencor, Inc. |
| Sector: Health Care | |
| SubSector: Biotechnology | |
| MarketCap: 1744.35 Millions | |
| Recent Price: 23.03 Smart Investing & Trading Score: 80 | |
| Day Percent Change: 2.54% Day Change: 0.57 | |
| Week Change: 2.45% Year-to-date Change: 8.5% | |
| XNCR Links: Profile News Message Board | |
| Charts:- Daily , Weekly | |
| Add XNCR to Watchlist: View: Get Complete XNCR Trend Analysis ➞ | |
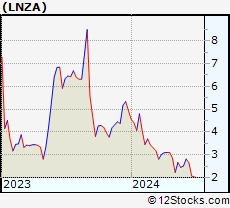 | LNZA LanzaTech Global, Inc. |
| Sector: Industrials | |
| SubSector: Waste Management | |
| MarketCap: 1340 Millions | |
| Recent Price: 2.51 Smart Investing & Trading Score: 32 | |
| Day Percent Change: -1.18% Day Change: -0.03 | |
| Week Change: 2.45% Year-to-date Change: -49.2% | |
| LNZA Links: Profile News Message Board | |
| Charts:- Daily , Weekly | |
| Add LNZA to Watchlist: View: Get Complete LNZA Trend Analysis ➞ | |
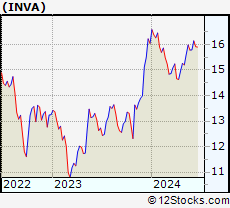 | INVA Innoviva, Inc. |
| Sector: Health Care | |
| SubSector: Biotechnology | |
| MarketCap: 1023.15 Millions | |
| Recent Price: 15.98 Smart Investing & Trading Score: 70 | |
| Day Percent Change: 0.00% Day Change: 0.00 | |
| Week Change: 2.44% Year-to-date Change: -0.4% | |
| INVA Links: Profile News Message Board | |
| Charts:- Daily , Weekly | |
| Add INVA to Watchlist: View: Get Complete INVA Trend Analysis ➞ | |
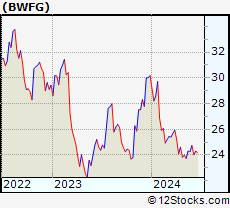 | BWFG Bankwell Financial Group, Inc. |
| Sector: Financials | |
| SubSector: Regional - Northeast Banks | |
| MarketCap: 142.899 Millions | |
| Recent Price: 24.32 Smart Investing & Trading Score: 64 | |
| Day Percent Change: 1.67% Day Change: 0.40 | |
| Week Change: 2.44% Year-to-date Change: -19.4% | |
| BWFG Links: Profile News Message Board | |
| Charts:- Daily , Weekly | |
| Add BWFG to Watchlist: View: Get Complete BWFG Trend Analysis ➞ | |
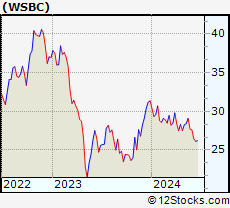 | WSBC WesBanco, Inc. |
| Sector: Financials | |
| SubSector: Regional - Mid-Atlantic Banks | |
| MarketCap: 1575.79 Millions | |
| Recent Price: 29.11 Smart Investing & Trading Score: 87 | |
| Day Percent Change: 1.15% Day Change: 0.33 | |
| Week Change: 2.43% Year-to-date Change: -7.2% | |
| WSBC Links: Profile News Message Board | |
| Charts:- Daily , Weekly | |
| Add WSBC to Watchlist: View: Get Complete WSBC Trend Analysis ➞ | |
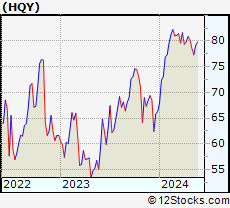 | HQY HealthEquity, Inc. |
| Sector: Technology | |
| SubSector: Healthcare Information Services | |
| MarketCap: 3369.75 Millions | |
| Recent Price: 79.21 Smart Investing & Trading Score: 42 | |
| Day Percent Change: 1.03% Day Change: 0.81 | |
| Week Change: 2.43% Year-to-date Change: 19.5% | |
| HQY Links: Profile News Message Board | |
| Charts:- Daily , Weekly | |
| Add HQY to Watchlist: View: Get Complete HQY Trend Analysis ➞ | |
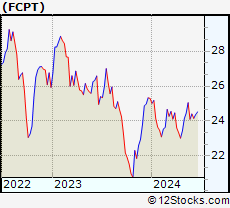 | FCPT Four Corners Property Trust, Inc. |
| Sector: Financials | |
| SubSector: REIT - Hotel/Motel | |
| MarketCap: 1218.94 Millions | |
| Recent Price: 25.05 Smart Investing & Trading Score: 76 | |
| Day Percent Change: 0.20% Day Change: 0.05 | |
| Week Change: 2.43% Year-to-date Change: -1.0% | |
| FCPT Links: Profile News Message Board | |
| Charts:- Daily , Weekly | |
| Add FCPT to Watchlist: View: Get Complete FCPT Trend Analysis ➞ | |
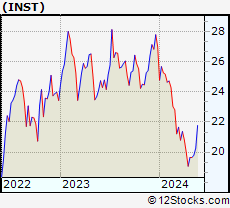 | INST Instructure Holdings, Inc. |
| Sector: Technology | |
| SubSector: Software - Application | |
| MarketCap: 3580 Millions | |
| Recent Price: 20.27 Smart Investing & Trading Score: 64 | |
| Day Percent Change: 0.20% Day Change: 0.04 | |
| Week Change: 2.43% Year-to-date Change: -25.0% | |
| INST Links: Profile News Message Board | |
| Charts:- Daily , Weekly | |
| Add INST to Watchlist: View: Get Complete INST Trend Analysis ➞ | |
| Too many stocks? View smallcap stocks filtered by marketcap & sector |
| Marketcap: All SmallCap Stocks (default-no microcap), Large, Mid-Range, Small & MicroCap |
| Sector: Tech, Finance, Energy, Staples, Retail, Industrial, Materials, Utilities & Medical |
|
Best Stocks Today 12Stocks.com |
© 2024 12Stocks.com Terms & Conditions Privacy Contact Us
All Information Provided Only For Education And Not To Be Used For Investing or Trading. See Terms & Conditions


One More Thing ... Get Best Stocks Delivered Daily!
Never Ever Miss A Move With Our Top Ten Stocks Lists
Find Best Stocks In Any Market - Bull or Bear Market
Take A Peek At Our Top Ten Stocks Lists: Daily, Weekly, Year-to-Date & Top Trends
Find Best Stocks In Any Market - Bull or Bear Market
Take A Peek At Our Top Ten Stocks Lists: Daily, Weekly, Year-to-Date & Top Trends
Smallcap Stocks With Best Up Trends [0-bearish to 100-bullish]: CommScope Holding[100], Coeur Mining[100], Hecla Mining[100], MicroStrategy [100], Enovix [100], Rayonier Advanced[100], Nurix [100], Energy Fuels[100], NovaGold Resources[100], Piedmont Lithium[100], Wave Life[100]
Best Smallcap Stocks Year-to-Date:
CareMax [495.88%], Bakkt [413.9%], Janux [338.34%], Viking [260.02%], Alpine Immune[241.23%], Longboard [238.63%], Avidity Biosciences[226.33%], Super Micro[212.35%], Arcutis Bio[184.83%], Sweetgreen [180.97%], Novavax [171.04%] Best Smallcap Stocks This Week:
Vaxxinity [58.82%], Novavax [46.51%], Vicarious Surgical[45.62%], Harrow Health[44.48%], ProKidney [44.31%], Workhorse Group[36.06%], Maxeon Solar[35.94%], Fossil Group[35.44%], Humacyte [34.68%], MicroStrategy [34.23%], Cadiz [33.48%] Best Smallcap Stocks Daily:
Vaxxinity [45.95%], Presto Automation[31.90%], Vicarious Surgical[27.93%], Orchestra BioMed[12.77%], CommScope Holding[11.86%], Coeur Mining[11.57%], Hecla Mining[11.11%], MicroStrategy [10.04%], Tenaya [9.65%], Bakkt [9.25%], Enovix [9.25%]