
 Login Sign Up


| |||||
 |  | ||||

| 12Stocks.com Market Intelligence |
Best SmallCap Stocks
|
| In a hurry? Small Cap Stock Lists: Performance Trends Table, Stock Charts
Sort Small Cap stocks: Daily, Weekly, Year-to-Date, Market Cap & Trends. Filter Small Cap stocks list by sector: Show all, Tech, Finance, Energy, Staples, Retail, Industrial, Materials, Utilities and HealthCare Filter Small Cap stocks list by size: All Large Medium Small and MicroCap |
| 12Stocks.com Small Cap Stocks Performances & Trends Daily | |||||||||
|
|  The overall Smart Investing & Trading Score is 76 (0-bearish to 100-bullish) which puts Small Cap index in short term neutral to bullish trend. The Smart Investing & Trading Score from previous trading session is 90 and hence a deterioration of trend.
| ||||||||
Here are the Smart Investing & Trading Scores of the most requested small cap stocks at 12Stocks.com (click stock name for detailed review):
|


| 12Stocks.com: Investing in Smallcap Index with Stocks | |
|
The following table helps investors and traders sort through current performance and trends (as measured by Smart Investing & Trading Score) of various
stocks in the Smallcap Index. Quick View: Move mouse or cursor over stock symbol (ticker) to view short-term technical chart and over stock name to view long term chart. Click on  to add stock symbol to your watchlist and to add stock symbol to your watchlist and  to view watchlist. Click on any ticker or stock name for detailed market intelligence report for that stock. to view watchlist. Click on any ticker or stock name for detailed market intelligence report for that stock. |
12Stocks.com Performance of Stocks in Smallcap Index
| Ticker | Stock Name | Watchlist | Category | Recent Price | Smart Investing & Trading Score | Change % | Weekly Change% |
| PAYO | Payoneer Global |   | Technology | 5.87 | 69 | 0.17% | 0.51% |
| ULCC | Frontier Group | | Industrials | 5.92 | 17 | -1.82% | 0.51% |
| TDW | Tidewater | | Energy | 105.28 | 51 | -1.61% | 0.50% |
| DCOM | Dime Community | | Financials | 19.99 | 90 | 1.01% | 0.50% |
| FIBK | First Interstate | | Financials | 27.89 | 83 | 0.87% | 0.50% |
| TLYS | Tilly s | | Services & Goods | 6.07 | 32 | -2.57% | 0.50% |
| GBTG | Global Business | | Technology | 6.01 | 10 | -0.66% | 0.50% |
| CBNK | Capital Bancorp | | Financials | 20.46 | 63 | -0.63% | 0.49% |
| CBT | Cabot | | Materials | 102.40 | 83 | 0.83% | 0.48% |
| SUPN | Supernus | | Health Care | 29.10 | 18 | -0.21% | 0.48% |
| SMR | NuScale Power | | Industrials | 6.31 | 58 | 3.61% | 0.48% |
| JJSF | J & J Snack Foods | | Consumer Staples | 164.15 | 90 | -0.86% | 0.47% |
| REPL | Replimune Group | | Health Care | 6.44 | 30 | -4.17% | 0.47% |
| BSIG | BrightSphere | | Financials | 22.81 | 53 | -2.77% | 0.46% |
| CDLX | Cardlytics | | Technology | 8.79 | 36 | -5.18% | 0.46% |
| SBCF | Seacoast Banking | | Financials | 24.41 | 100 | 1.41% | 0.45% |
| MNRO | Monro | | Consumer Staples | 26.65 | 17 | -3.76% | 0.45% |
| DGICA | Donegal Group | | Financials | 13.35 | 42 | 0.15% | 0.45% |
| TNET | TriNet Group | | Services & Goods | 103.92 | 42 | 0.71% | 0.44% |
| AVDX | AvidXchange | | Technology | 11.29 | 25 | 0.09% | 0.44% |
| VALU | Value Line | | Services & Goods | 39.96 | 74 | 3.36% | 0.43% |
| ALKS | Alkermes | | Health Care | 24.15 | 24 | -1.27% | 0.42% |
| BMI | Badger Meter | | Technology | 197.21 | 90 | 0.45% | 0.42% |
| REZI | Resideo | | Services & Goods | 21.59 | 42 | -0.78% | 0.42% |
| BL | BlackLine | | Technology | 58.46 | 58 | -1.03% | 0.41% |


| Too many stocks? View smallcap stocks filtered by marketcap & sector |
| Marketcap: All SmallCap Stocks (default-no microcap), Large, Mid-Range, Small |
| Smallcap Sector: Tech, Finance, Energy, Staples, Retail, Industrial, Materials, & Medical |
|
Get the most comprehensive stock market coverage daily at 12Stocks.com ➞ Best Stocks Today ➞ Best Stocks Weekly ➞ Best Stocks Year-to-Date ➞ Best Stocks Trends ➞  Best Stocks Today 12Stocks.com Best Nasdaq Stocks ➞ Best S&P 500 Stocks ➞ Best Tech Stocks ➞ Best Biotech Stocks ➞ |
| Detailed Overview of SmallCap Stocks |
| SmallCap Technical Overview, Leaders & Laggards, Top SmallCap ETF Funds & Detailed SmallCap Stocks List, Charts, Trends & More |
| Smallcap: Technical Analysis, Trends & YTD Performance | |
| SmallCap segment as represented by
IWM, an exchange-traded fund [ETF], holds basket of thousands of smallcap stocks from across all major sectors of the US stock market. The smallcap index (contains stocks like Riverbed & Sotheby's) is up by 3.67% and is currently underperforming the overall market by -6.9% year-to-date. Below is a quick view of technical charts and trends: | |
 IWM Weekly Chart |
|
| Long Term Trend: Very Good | |
| Medium Term Trend: Very Good | |
 IWM Daily Chart |
|
| Short Term Trend: Good | |
| Overall Trend Score: 76 | |
| YTD Performance: 3.67% | |
| **Trend Scores & Views Are Only For Educational Purposes And Not For Investing | |
| 12Stocks.com: Top Performing Small Cap Index Stocks | ||||||||||||||||||||||||||||||||||||||||||||||||
 The top performing Small Cap Index stocks year to date are
Now, more recently, over last week, the top performing Small Cap Index stocks on the move are


|
||||||||||||||||||||||||||||||||||||||||||||||||
| 12Stocks.com: Investing in Smallcap Index using Exchange Traded Funds | |
|
The following table shows list of key exchange traded funds (ETF) that
help investors track Smallcap index. The following list also includes leveraged ETF funds that track twice or thrice the daily returns of Smallcap indices. Short or inverse ETF funds move in the opposite direction to the index they track and are useful during market pullbacks or during bear markets. Quick View: Move mouse or cursor over ETF symbol (ticker) to view short-term technical chart and over ETF name to view long term chart. Click on ticker or stock name for detailed view. Click on to add stock symbol to your watchlist and to view watchlist. |
12Stocks.com List of ETFs that track Smallcap Index
| Ticker | ETF Name | Watchlist | Recent Price | Smart Investing & Trading Score | Change % | Week % | Year-to-date % |
| IWM | iShares Russell 2000 | | 208.08 | 76 | 0.07 | 1.85 | 3.67% |
| VTWO | Vanguard Russell 2000 ETF | | 84.11 | 71 | 0.00 | 1.8 | 3.71% |
| IJR | iShares Core S&P Small-Cap | | 110.39 | 68 | -0.22 | 1.29 | 1.98% |
| IWN | iShares Russell 2000 Value | | 158.71 | 76 | -0.07 | 1.61 | 2.18% |
| IWO | iShares Russell 2000 Growth | | 265.15 | 63 | -0.75 | 2.01 | 5.13% |
| IJS | iShares S&P Small-Cap 600 Value | | 101.87 | 76 | -0.15 | 1.34 | -1.16% |
| IJT | iShares S&P Small-Cap 600 Growth | | 131.34 | 71 | 0.04 | 1.14 | 4.95% |
| XSLV | PowerShares S&P SmallCap Low Volatil ETF | | 44.48 | 83 | -0.01 | 0.55 | 0.74% |
| SAA | ProShares Ultra SmallCap600 | | 24.90 | 71 | 0.50 | 2.28 | -0.18% |
| SMLV | SPDR SSGA US Small Cap Low Volatil ETF | | 113.28 | 95 | 0.43 | 1.85 | 0.68% |
| SDD | ProShares UltraShort SmallCap600 | | 17.84 | 35 | 0.96 | -2.41 | -3.19% |
| SBB | ProShares Short SmallCap600 | | 15.77 | 25 | 0.41 | -1.14 | -0.98% |
| 12Stocks.com: Charts, Trends, Fundamental Data and Performances of SmallCap Stocks | |
|
We now take in-depth look at all SmallCap stocks including charts, multi-period performances and overall trends (as measured by Smart Investing & Trading Score). One can sort SmallCap stocks (click link to choose) by Daily, Weekly and by Year-to-Date performances. Also, one can sort by size of the company or by market capitalization. |
| Select Your Default Chart Type: | |||||
| |||||
| Click on stock symbol or name for detailed view. Click on to add stock symbol to your watchlist and to view watchlist. Quick View: Move mouse or cursor over "Daily" to quickly view daily technical stock chart and over "Weekly" to view weekly technical stock chart. | |||||

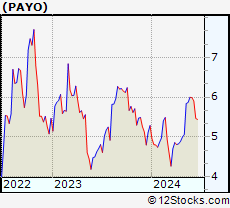 | PAYO Payoneer Global Inc. |
| Sector: Technology | |
| SubSector: Software - Infrastructure | |
| MarketCap: 1710 Millions | |
| Recent Price: 5.87 Smart Investing & Trading Score: 69 | |
| Day Percent Change: 0.17% Day Change: 0.01 | |
| Week Change: 0.51% Year-to-date Change: 11.0% | |
| PAYO Links: Profile News Message Board | |
| Charts:- Daily , Weekly | |
| Add PAYO to Watchlist: View: Get Complete PAYO Trend Analysis ➞ | |
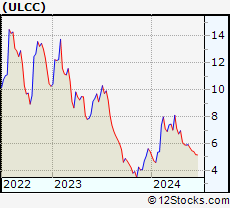 | ULCC Frontier Group Holdings, Inc. |
| Sector: Industrials | |
| SubSector: Airlines | |
| MarketCap: 2160 Millions | |
| Recent Price: 5.92 Smart Investing & Trading Score: 17 | |
| Day Percent Change: -1.82% Day Change: -0.11 | |
| Week Change: 0.51% Year-to-date Change: 9.0% | |
| ULCC Links: Profile News Message Board | |
| Charts:- Daily , Weekly | |
| Add ULCC to Watchlist: View: Get Complete ULCC Trend Analysis ➞ | |
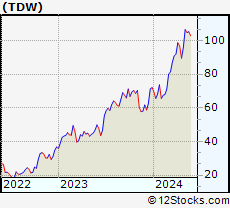 | TDW Tidewater Inc. |
| Sector: Energy | |
| SubSector: Oil & Gas Equipment & Services | |
| MarketCap: 295.061 Millions | |
| Recent Price: 105.28 Smart Investing & Trading Score: 51 | |
| Day Percent Change: -1.61% Day Change: -1.72 | |
| Week Change: 0.5% Year-to-date Change: 46.0% | |
| TDW Links: Profile News Message Board | |
| Charts:- Daily , Weekly | |
| Add TDW to Watchlist: View: Get Complete TDW Trend Analysis ➞ | |
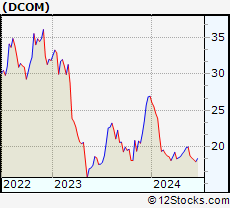 | DCOM Dime Community Bancshares, Inc. |
| Sector: Financials | |
| SubSector: Savings & Loans | |
| MarketCap: 477.83 Millions | |
| Recent Price: 19.99 Smart Investing & Trading Score: 90 | |
| Day Percent Change: 1.01% Day Change: 0.20 | |
| Week Change: 0.5% Year-to-date Change: -25.8% | |
| DCOM Links: Profile News Message Board | |
| Charts:- Daily , Weekly | |
| Add DCOM to Watchlist: View: Get Complete DCOM Trend Analysis ➞ | |
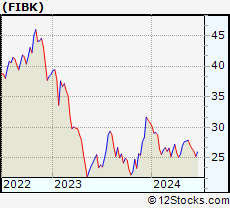 | FIBK First Interstate BancSystem, Inc. |
| Sector: Financials | |
| SubSector: Regional - Pacific Banks | |
| MarketCap: 1797.69 Millions | |
| Recent Price: 27.89 Smart Investing & Trading Score: 83 | |
| Day Percent Change: 0.87% Day Change: 0.24 | |
| Week Change: 0.5% Year-to-date Change: -9.3% | |
| FIBK Links: Profile News Message Board | |
| Charts:- Daily , Weekly | |
| Add FIBK to Watchlist: View: Get Complete FIBK Trend Analysis ➞ | |
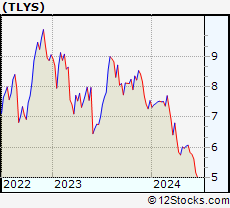 | TLYS Tilly s, Inc. |
| Sector: Services & Goods | |
| SubSector: Apparel Stores | |
| MarketCap: 127.408 Millions | |
| Recent Price: 6.07 Smart Investing & Trading Score: 32 | |
| Day Percent Change: -2.57% Day Change: -0.16 | |
| Week Change: 0.5% Year-to-date Change: -19.5% | |
| TLYS Links: Profile News Message Board | |
| Charts:- Daily , Weekly | |
| Add TLYS to Watchlist: View: Get Complete TLYS Trend Analysis ➞ | |
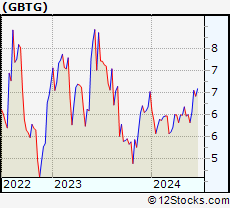 | GBTG Global Business Travel Group, Inc. |
| Sector: Technology | |
| SubSector: Software - Application | |
| MarketCap: 3440 Millions | |
| Recent Price: 6.01 Smart Investing & Trading Score: 10 | |
| Day Percent Change: -0.66% Day Change: -0.04 | |
| Week Change: 0.5% Year-to-date Change: -8.0% | |
| GBTG Links: Profile News Message Board | |
| Charts:- Daily , Weekly | |
| Add GBTG to Watchlist: View: Get Complete GBTG Trend Analysis ➞ | |
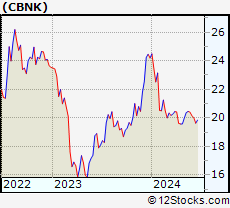 | CBNK Capital Bancorp, Inc. |
| Sector: Financials | |
| SubSector: Savings & Loans | |
| MarketCap: 174.93 Millions | |
| Recent Price: 20.46 Smart Investing & Trading Score: 63 | |
| Day Percent Change: -0.63% Day Change: -0.13 | |
| Week Change: 0.49% Year-to-date Change: -15.5% | |
| CBNK Links: Profile News Message Board | |
| Charts:- Daily , Weekly | |
| Add CBNK to Watchlist: View: Get Complete CBNK Trend Analysis ➞ | |
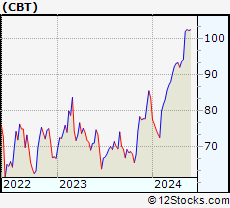 | CBT Cabot Corporation |
| Sector: Materials | |
| SubSector: Specialty Chemicals | |
| MarketCap: 1261.47 Millions | |
| Recent Price: 102.40 Smart Investing & Trading Score: 83 | |
| Day Percent Change: 0.83% Day Change: 0.84 | |
| Week Change: 0.48% Year-to-date Change: 22.6% | |
| CBT Links: Profile News Message Board | |
| Charts:- Daily , Weekly | |
| Add CBT to Watchlist: View: Get Complete CBT Trend Analysis ➞ | |
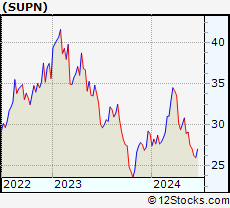 | SUPN Supernus Pharmaceuticals, Inc. |
| Sector: Health Care | |
| SubSector: Drugs - Generic | |
| MarketCap: 833.585 Millions | |
| Recent Price: 29.10 Smart Investing & Trading Score: 18 | |
| Day Percent Change: -0.21% Day Change: -0.06 | |
| Week Change: 0.48% Year-to-date Change: 0.6% | |
| SUPN Links: Profile News Message Board | |
| Charts:- Daily , Weekly | |
| Add SUPN to Watchlist: View: Get Complete SUPN Trend Analysis ➞ | |
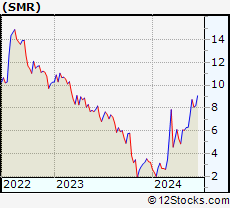 | SMR NuScale Power Corporation |
| Sector: Industrials | |
| SubSector: Specialty Industrial Machinery | |
| MarketCap: 1510 Millions | |
| Recent Price: 6.31 Smart Investing & Trading Score: 58 | |
| Day Percent Change: 3.61% Day Change: 0.22 | |
| Week Change: 0.48% Year-to-date Change: 95.7% | |
| SMR Links: Profile News Message Board | |
| Charts:- Daily , Weekly | |
| Add SMR to Watchlist: View: Get Complete SMR Trend Analysis ➞ | |
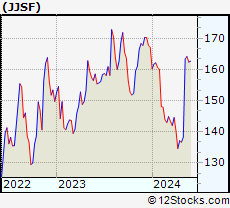 | JJSF J & J Snack Foods Corp. |
| Sector: Consumer Staples | |
| SubSector: Processed & Packaged Goods | |
| MarketCap: 2706.28 Millions | |
| Recent Price: 164.15 Smart Investing & Trading Score: 90 | |
| Day Percent Change: -0.86% Day Change: -1.43 | |
| Week Change: 0.47% Year-to-date Change: -1.8% | |
| JJSF Links: Profile News Message Board | |
| Charts:- Daily , Weekly | |
| Add JJSF to Watchlist: View: Get Complete JJSF Trend Analysis ➞ | |
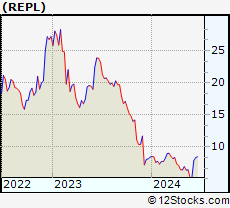 | REPL Replimune Group, Inc. |
| Sector: Health Care | |
| SubSector: Biotechnology | |
| MarketCap: 367.885 Millions | |
| Recent Price: 6.44 Smart Investing & Trading Score: 30 | |
| Day Percent Change: -4.17% Day Change: -0.28 | |
| Week Change: 0.47% Year-to-date Change: -23.6% | |
| REPL Links: Profile News Message Board | |
| Charts:- Daily , Weekly | |
| Add REPL to Watchlist: View: Get Complete REPL Trend Analysis ➞ | |
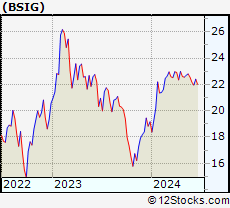 | BSIG BrightSphere Investment Group Inc. |
| Sector: Financials | |
| SubSector: Asset Management | |
| MarketCap: 430.103 Millions | |
| Recent Price: 22.81 Smart Investing & Trading Score: 53 | |
| Day Percent Change: -2.77% Day Change: -0.65 | |
| Week Change: 0.46% Year-to-date Change: 19.1% | |
| BSIG Links: Profile News Message Board | |
| Charts:- Daily , Weekly | |
| Add BSIG to Watchlist: View: Get Complete BSIG Trend Analysis ➞ | |
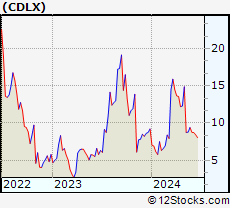 | CDLX Cardlytics, Inc. |
| Sector: Technology | |
| SubSector: Internet Information Providers | |
| MarketCap: 855.48 Millions | |
| Recent Price: 8.79 Smart Investing & Trading Score: 36 | |
| Day Percent Change: -5.18% Day Change: -0.48 | |
| Week Change: 0.46% Year-to-date Change: -4.6% | |
| CDLX Links: Profile News Message Board | |
| Charts:- Daily , Weekly | |
| Add CDLX to Watchlist: View: Get Complete CDLX Trend Analysis ➞ | |
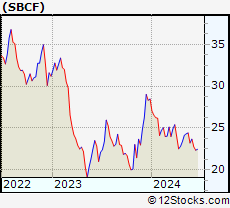 | SBCF Seacoast Banking Corporation of Florida |
| Sector: Financials | |
| SubSector: Regional - Mid-Atlantic Banks | |
| MarketCap: 881.559 Millions | |
| Recent Price: 24.41 Smart Investing & Trading Score: 100 | |
| Day Percent Change: 1.41% Day Change: 0.34 | |
| Week Change: 0.45% Year-to-date Change: -14.2% | |
| SBCF Links: Profile News Message Board | |
| Charts:- Daily , Weekly | |
| Add SBCF to Watchlist: View: Get Complete SBCF Trend Analysis ➞ | |
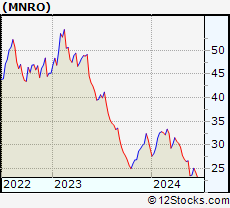 | MNRO Monro, Inc. |
| Sector: Consumer Staples | |
| SubSector: Auto Parts | |
| MarketCap: 1514.89 Millions | |
| Recent Price: 26.65 Smart Investing & Trading Score: 17 | |
| Day Percent Change: -3.76% Day Change: -1.04 | |
| Week Change: 0.45% Year-to-date Change: -9.2% | |
| MNRO Links: Profile News Message Board | |
| Charts:- Daily , Weekly | |
| Add MNRO to Watchlist: View: Get Complete MNRO Trend Analysis ➞ | |
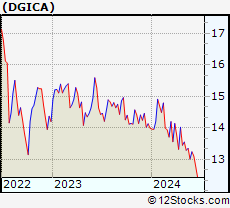 | DGICA Donegal Group Inc. |
| Sector: Financials | |
| SubSector: Property & Casualty Insurance | |
| MarketCap: 350.512 Millions | |
| Recent Price: 13.35 Smart Investing & Trading Score: 42 | |
| Day Percent Change: 0.15% Day Change: 0.02 | |
| Week Change: 0.45% Year-to-date Change: -4.6% | |
| DGICA Links: Profile News Message Board | |
| Charts:- Daily , Weekly | |
| Add DGICA to Watchlist: View: Get Complete DGICA Trend Analysis ➞ | |
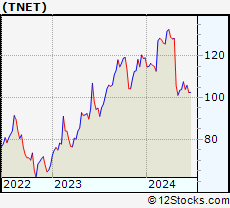 | TNET TriNet Group, Inc. |
| Sector: Services & Goods | |
| SubSector: Business Services | |
| MarketCap: 2648.72 Millions | |
| Recent Price: 103.92 Smart Investing & Trading Score: 42 | |
| Day Percent Change: 0.71% Day Change: 0.73 | |
| Week Change: 0.44% Year-to-date Change: -12.6% | |
| TNET Links: Profile News Message Board | |
| Charts:- Daily , Weekly | |
| Add TNET to Watchlist: View: Get Complete TNET Trend Analysis ➞ | |
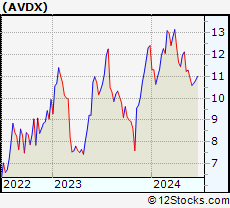 | AVDX AvidXchange Holdings, Inc. |
| Sector: Technology | |
| SubSector: Software - Infrastructure | |
| MarketCap: 2120 Millions | |
| Recent Price: 11.29 Smart Investing & Trading Score: 25 | |
| Day Percent Change: 0.09% Day Change: 0.01 | |
| Week Change: 0.44% Year-to-date Change: -9.1% | |
| AVDX Links: Profile News Message Board | |
| Charts:- Daily , Weekly | |
| Add AVDX to Watchlist: View: Get Complete AVDX Trend Analysis ➞ | |
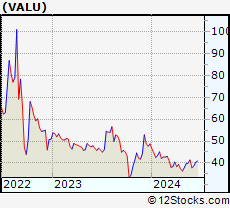 | VALU Value Line, Inc. |
| Sector: Services & Goods | |
| SubSector: Publishing - Periodicals | |
| MarketCap: 254.3 Millions | |
| Recent Price: 39.96 Smart Investing & Trading Score: 74 | |
| Day Percent Change: 3.36% Day Change: 1.30 | |
| Week Change: 0.43% Year-to-date Change: -18.0% | |
| VALU Links: Profile News Message Board | |
| Charts:- Daily , Weekly | |
| Add VALU to Watchlist: View: Get Complete VALU Trend Analysis ➞ | |
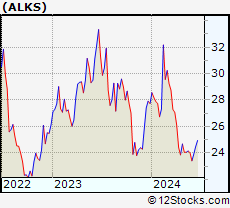 | ALKS Alkermes plc |
| Sector: Health Care | |
| SubSector: Biotechnology | |
| MarketCap: 2311.95 Millions | |
| Recent Price: 24.15 Smart Investing & Trading Score: 24 | |
| Day Percent Change: -1.27% Day Change: -0.31 | |
| Week Change: 0.42% Year-to-date Change: -12.9% | |
| ALKS Links: Profile News Message Board | |
| Charts:- Daily , Weekly | |
| Add ALKS to Watchlist: View: Get Complete ALKS Trend Analysis ➞ | |
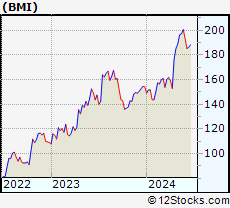 | BMI Badger Meter, Inc. |
| Sector: Technology | |
| SubSector: Scientific & Technical Instruments | |
| MarketCap: 1530.53 Millions | |
| Recent Price: 197.21 Smart Investing & Trading Score: 90 | |
| Day Percent Change: 0.45% Day Change: 0.88 | |
| Week Change: 0.42% Year-to-date Change: 27.8% | |
| BMI Links: Profile News Message Board | |
| Charts:- Daily , Weekly | |
| Add BMI to Watchlist: View: Get Complete BMI Trend Analysis ➞ | |
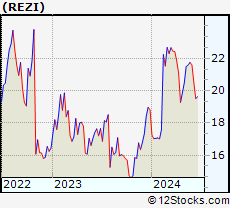 | REZI Resideo Technologies, Inc. |
| Sector: Services & Goods | |
| SubSector: Security & Protection Services | |
| MarketCap: 712.603 Millions | |
| Recent Price: 21.59 Smart Investing & Trading Score: 42 | |
| Day Percent Change: -0.78% Day Change: -0.17 | |
| Week Change: 0.42% Year-to-date Change: 14.7% | |
| REZI Links: Profile News Message Board | |
| Charts:- Daily , Weekly | |
| Add REZI to Watchlist: View: Get Complete REZI Trend Analysis ➞ | |
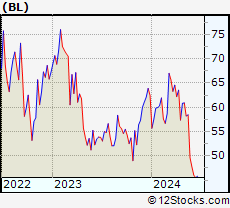 | BL BlackLine, Inc. |
| Sector: Technology | |
| SubSector: Application Software | |
| MarketCap: 2972.62 Millions | |
| Recent Price: 58.46 Smart Investing & Trading Score: 58 | |
| Day Percent Change: -1.03% Day Change: -0.61 | |
| Week Change: 0.41% Year-to-date Change: -6.4% | |
| BL Links: Profile News Message Board | |
| Charts:- Daily , Weekly | |
| Add BL to Watchlist: View: Get Complete BL Trend Analysis ➞ | |
| Too many stocks? View smallcap stocks filtered by marketcap & sector |
| Marketcap: All SmallCap Stocks (default-no microcap), Large, Mid-Range, Small & MicroCap |
| Sector: Tech, Finance, Energy, Staples, Retail, Industrial, Materials, Utilities & Medical |
|
Best Stocks Today 12Stocks.com |
© 2024 12Stocks.com Terms & Conditions Privacy Contact Us
All Information Provided Only For Education And Not To Be Used For Investing or Trading. See Terms & Conditions


One More Thing ... Get Best Stocks Delivered Daily!
Never Ever Miss A Move With Our Top Ten Stocks Lists
Find Best Stocks In Any Market - Bull or Bear Market
Take A Peek At Our Top Ten Stocks Lists: Daily, Weekly, Year-to-Date & Top Trends
Find Best Stocks In Any Market - Bull or Bear Market
Take A Peek At Our Top Ten Stocks Lists: Daily, Weekly, Year-to-Date & Top Trends
Smallcap Stocks With Best Up Trends [0-bearish to 100-bullish]: CommScope Holding[100], Coeur Mining[100], Hecla Mining[100], MicroStrategy [100], Enovix [100], Rayonier Advanced[100], Nurix [100], Energy Fuels[100], NovaGold Resources[100], Piedmont Lithium[100], Wave Life[100]
Best Smallcap Stocks Year-to-Date:
CareMax [495.88%], Bakkt [413.9%], Janux [338.34%], Viking [260.02%], Alpine Immune[241.23%], Longboard [238.63%], Avidity Biosciences[226.33%], Super Micro[212.35%], Arcutis Bio[184.83%], Sweetgreen [180.97%], Novavax [171.04%] Best Smallcap Stocks This Week:
Vaxxinity [58.82%], Novavax [46.51%], Vicarious Surgical[45.62%], Harrow Health[44.48%], ProKidney [44.31%], Workhorse Group[36.06%], Maxeon Solar[35.94%], Fossil Group[35.44%], Humacyte [34.68%], MicroStrategy [34.23%], Cadiz [33.48%] Best Smallcap Stocks Daily:
Vaxxinity [45.95%], Presto Automation[31.90%], Vicarious Surgical[27.93%], Orchestra BioMed[12.77%], CommScope Holding[11.86%], Coeur Mining[11.57%], Hecla Mining[11.11%], MicroStrategy [10.04%], Tenaya [9.65%], Bakkt [9.25%], Enovix [9.25%]